What is really happening in the Calgary Real Estate Market?

What is really happening in the Calgary Real Estate Market?
Stay ahead of everyone else by following our Monthly Market Snapshot of the Calgary Real Estate Market. This shows what’s really happening! The market is driven by supply and demand so here we show the inventory (supply) and sales (demand) and most importantly the relationship between the two and how it affects the price of Calgary Real Estate. A simple way to keep up to date with how the market is trending and to stay ahead of most! All numbers are taken from the Calgary Real Estate Boards Stats package for Realtors. I have also included some general comments which are simply my opinion.
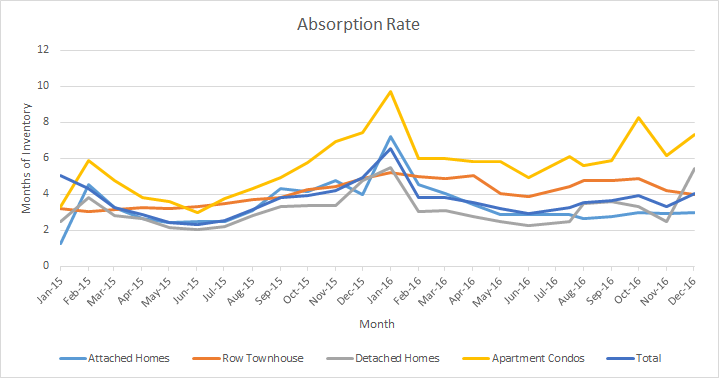
Months of Inventory/Absorption Rate – the inventory divided by the number of sales in the last month). What does this mean you might ask?
| Buyer’s Market | >4.0 | Drives prices down |
| Balanced Market | Between 2.4 to 4.0 | Prices typically remain stable |
| Seller’s Market | <2.4 | Drives prices up |
Current Months of Inventory: If we did not list any more homes this is how many months it would take to deplete inventory. In November there were some ups and some downs with the most significant being the Apartment Condo sector that went from 7.12 months to 5.49 months, which is a significant drop and is now the lowest Apartment Condos have been in well over a year. One month does not make a trend and I speculate that this is largely do to listings expiring and people are leaving them off till the new year. All categories are still in a “Buyers Market” position.
| End of | Oct 2018 | Nov 2018 | Change |
| Detached | 4.80 | 5.14 | 0.35 |
| Semi Detached | 6.53 | 6.94 | 0.40 |
| Attached – Row | 6.59 | 6.56 | -0.04 |
| Apartment | 7.12 | 5.49 | -1.63 |
| Total City | 5.56 | 5.55 | -0.01 |
Calgary Listing Inventory
In November, our inventory decreased in all sectors and overall, the highest decrease was in the Detached home sector followed by the Apartment Condo sector. This is normal at this time of year and we should expect this trend to continue for the rest of the year as consumers move their focus to Christmas.
| Inventory | Oct 2018 | Nov 2018 | Change |
| Detached | 3976 | 3491 | -485 |
| Semi Detached | 823 | 749 | -74 |
| Attached – Row | 1009 | 944 | -65 |
| Apartment | 1509 | 1317 | -192 |
| Total Calgary | 7345 | 6501 | -844 |
Calgary Sales:
In November we saw a slight increase in Sales in the Apartment Condo Sector over last month while other sectors saw a decrease in sales. Sales decreasing at this time of year is normal with Christmas approaching.
| Calgary Sales | Oct 2018 | Nov 2018 | Change | % Change |
| Detached | 829 | 679 | -150 | -18.09% |
| Semi Detached | 126 | 108 | -18 | -14.29% |
| Attached – Row | 153 | 144 | -9 | -5.88% |
| Apartment | 212 | 240 | 28 | 13.21% |
| Total City | 1322 | 1171 | -151 | -11.42% |
***Sales Compared to last year:
As you can see from the chart below comparing sales to last year there have been some substantial changes. In the first half of the year we were trending up and in the last 6 months we are trending down rather quickly. My belief is that this is due to the Economic conditions in Calgary and declining consumer confidence.
| Jan | Feb | Mar | Apr | May | June | July | Aug | Sept | Oct | Nov | Dec |
| 102% | 82% | 72% | 80% | 82% | 89% | 95% | 93% | 85.9% | 89.9% | 83.0 |
Calgary Real Estate Sales Prices:
November saw prices decrease in all sectors with the largest decrease being in the Detached home sector. This is expected with the high number of months of inventory on the market. Unless something changes we can expect to see this trend for a few more months.
| Sales Prices | Oct 2018 Benchmark Price | Nov 2018 Benchmark Price | Change |
| Detached | 490,200 | 486,000 | -4,200 |
| Semi Detached | 403,400 | 400,700 | -2,700 |
| Attached – Row | 293,400 | 292,900 | -500 |
| Apartment | 257,200 | 252,800 | -4,400 |
| Total City | 426,300 | 422,600 | -3,700 |
Sales Prices “Year to Date”
| Sales Prices | Jan 1, 2018 Benchmark Price | Nov 2018 Benchmark Price | Change
$ |
% Change |
| Detached | 499,600 | 486,000 | -13,600 | -2.72% |
| Semi Detached | 416,600 | 400,700 | -15,900 | -3.82% |
| Attached – Row | 299,500 | 292,900 | -6,600 | -2.20% |
| Apartment | 257,700 | 252,800 | -4,900 | -1.90% |
| Total City | 433,200 | 422,600 | -10,600 | -2.45% |
**Please note that these numbers include only Calgary homes and do change on a community basis and more so for towns. This report does not include rural properties and does not take into account differences in different price ranges. If you would like to find stats on your community just let me know. If you have any questions about this summary or about Real Estate in general, please feel free to contact TSW Real Estate Group here.