What is really happening in the Calgary Real Estate Market?

If you are new to our Monthly Snapshot please scroll down for my explanation.
Current Report : April 1, 2019
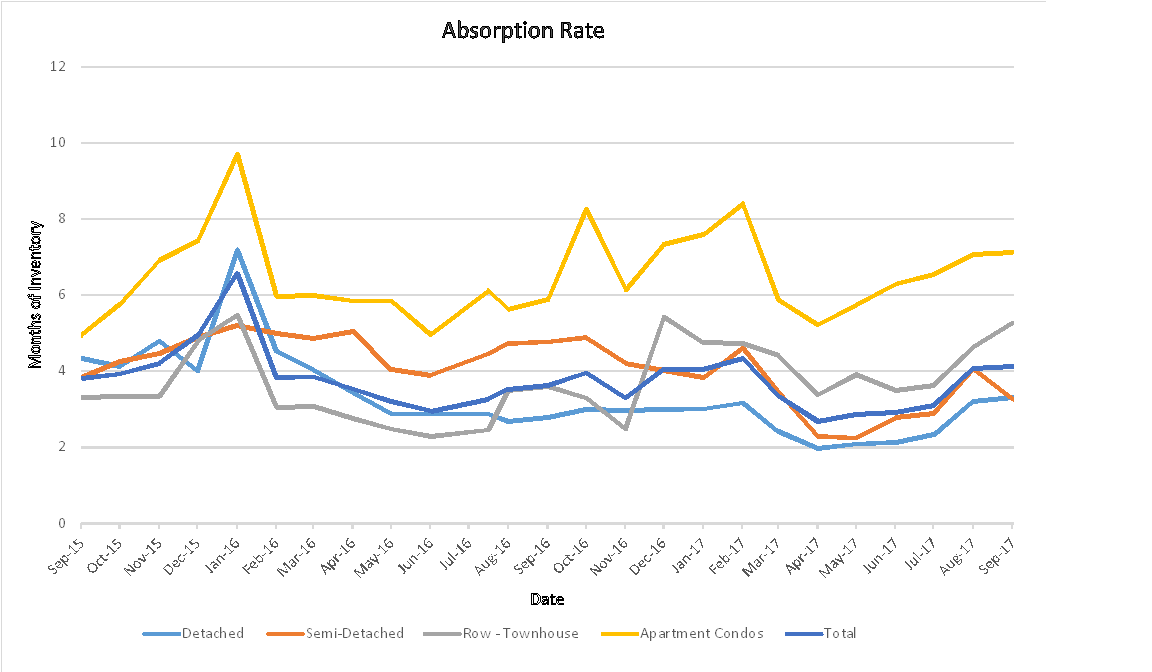
Current Months of Inventory:
Good news for the Calgary Real Estate Market. Two months in a row we have a trend of the months of inventory decreasing. March saw all sectors decrease with the largest decrease in Semi-Detached and Attached-Row houses. Noteworthy is that Detached homes are nearing a balanced market again.
| End of | Jan 2019 | Feb 2019 | Change |
| Detached | 5.04 | 4.15 | -0.89 |
| Semi Detached | 6.63 | 5.32 | -1.31 |
| Attached – Row | 6.98 | 5.44 | -1.54 |
| Apartment | 8.73 | 7.87 | -0.86 |
| Total City | 6.03 | 4.96 | -1.07 |
Calgary Listing Inventory
In March, our inventory increased in all categories. This increase is totally expected as we starting to enter the spring market. As long as the increase is balanced with an increase in sales the market will continue to get healthier.
| Inventory (End of) | Jan 2019 | Feb 2019 | Change |
| Detached | 2987 | 3393 | 406 |
| Semi Detached | 689 | 787 | 98 |
| Attached – Row | 908 | 947 | 39 |
| Apartment | 1301 | 1488 | 187 |
| Total Calgary | 5885 | 6595 | 710 |
Calgary Sales:
Sales for March increased in all sectors compared to February. Sales increasing is again an expected change as we move into the spring market. In my opinion the % increase is quite substantial with an overall increase over February of 36.2%.
| Calgary Sales | Jan 2019 | Feb 2019 | Change | % Change |
| Detached | 593 | 818 | 225 | 37.94% |
| Semi Detached | 104 | 148 | 44 | 42.31% |
| Attached – Row | 130 | 174 | 44 | 33.85% |
| Apartment | 149 | 189 | 40 | 26.85% |
| Total City | 976 | 1329 | 353 | 36.17% |
***Sales Compared to last year***
In March our sales were 97.1% of last years sales so a decrease of 2.9%. I am also starting to see and hear from clients who are getting ready to take advantage of the low prices which may kickstart things a little. Of interest we are also starting to see competing offers again.
| Jan | Feb | Mar | Apr | May | June | July | Aug | Sept | Oct | Nov | Dec | |
| 2018 | 102% | 82% | 72% | 80% | 82% | 89% | 95% | 93% | 85.9% | 89.9% | 83.0 | 78.6 |
| 2019 | 83.8% | 89.6% | 97.1% |
Calgary Real Estate Sales Prices:
March saw a small decrease in prices in Semi-Detached and Apartments while Detached and Attached Row houses showed slight increases in prices.
| Sales Prices | Jan 2018 Benchmark Price | Feb 2019 Benchmark Price | Change |
| Detached | 475,600 | 475,800 | 200 |
| Semi Detached | 392,500 | 391,000 | -1,500 |
| Attached – Row | 284,600 | 284,900 | 300 |
| Apartment | 252,300 | 250,600 | -1,700 |
| Total City | 414,400 | 413,900 | -500 |
Sales Prices “Year to Date”
| Sales Prices | Jan 2019 Benchmark Price | Feb 1, 2019 Benchmark Price | Change
$ |
% Change |
| Detached | 481,400 | 475,800 | -5,600 | -1.16% |
| Semi Detached | 397,500 | 391,000 | -6,500 | -1.64% |
| Attached – Row | 288,400 | 284,900 | -3,500 | -1.21% |
| Apartment | 251,500 | 250,600 | -900 | -0.36% |
| Total City | 418,500 | 413,900 | -4,600 | -1.10% |
Explanation of our Calgary Real Estate Market Snapshot.
Stay ahead of everyone else by following our Monthly Market Snapshot of the Calgary Real Estate Market. This shows what’s really happening! The market is driven by supply and demand so here we show the inventory (supply) and sales (demand) and most importantly the relationship between the two and how it affects the price of Calgary Real Estate. A simple way to keep up to date with how the market is trending and to stay ahead of most! All numbers are taken from the Calgary Real Estate Boards Stats package for Realtors. I have also included some general comments which are simply my opinion.
Months of Inventory: If we did not list any more homes this is how many months it would take to deplete inventory.
Months of Inventory/Absorption Rate – the inventory divided by the number of sales in the last month). What does this mean you might ask?
| Buyer’s Market | >4.0 | Drives prices down |
| Balanced Market | Between 2.4 to 4.0 | Prices typically remain stable |
| Seller’s Market | <2.4 | Drives prices up |
**Please note that these numbers include only Calgary and do change on a community basis and more so for towns. This report does not include rural properties and does not take into account differences in different price ranges. If you would like to find stats on your community just let me know. If you have any questions about this summary or about Real Estate in general, please feel free to contact us.
Courtesy of TSW Real Estate Group
Gord Piper & Brent Wilcox