What is really happening in the Calgary Real Estate Market?
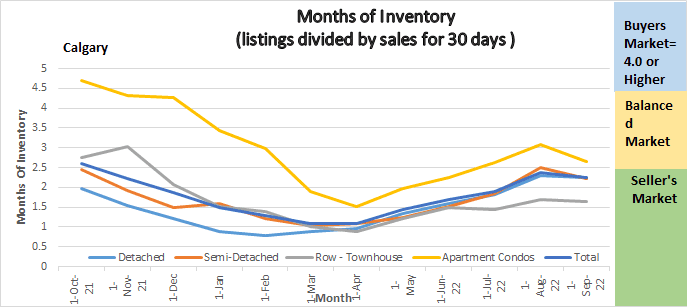
Months of Inventory Trendline
Following is a graph that shows the months of inventory for each housing sector. Looking at a one-year trendline gives you an indication of where things are really heading.
Gord’s commentary for the month (my opinion).
August 2022 Highlights
- Inventory continues to decline
- Sales below last month but almost equal to August 2021
- Prices in all sectors dropped
- Prices year over year are still way up
Calgary Listing Inventory
Listing Inventory in all sectors declined this month by 8% to 16%
It is typical to see our inventory decline and it will continue to decline until the new year.
Calgary Sales:
All sectors saw a decrease in sales in August compared to July except apartment Condos and they increased by eleven sales. The decline overall was exceedingly small with total sales in August being only 118 sales less than July. This works out to only a 5.24% decrease compared to the 8% to 16% decline in our Inventory. Another trend I am seeing in the sales category is there is slightly less activity in the detached sector and more activity in other sectors and it is because of the Mortgage rates and higher prices some people can no longer afford detached homes, so they are looking at other options.
Sales Compared to 2021:
It is also important to look at sales compared to the Previous year. August sales were only ten sales less than August 2021. This confirms for me that the decline in sales we are seeing is seasonal.
The Calgary Real Estate Board is also indicating that our August Sales were well above the long-term average.
| Jan | Feb | Mar | Apr | May | June | July | |
| 2021 | 1207 | 1831 | 2903 | 3204 | 2981 | 2914 | 2314 |
| 2022 | 2009 | 3305 | 4107 | 3401 | 3071 | 2842 | 2254 |
| Change | + 802 | 1474 | +1204 | +197 | 90 | -72 | -60 |
| % Change | + 66.4% | +180.5% | +141.5% | +1.06 | +1.03% | 2.5% | 2.7% |
| Aug | Sept | Oct | Nov | Dec | |
| 2021 | 2146 | ||||
| 2022 | 2136 | ||||
| Change | -10 | ||||
| % Change | -.5% |
Calgary Real Estate Benchmark Sales Prices:
The benchmark price for all sectors combined decreased by $8,200 for the month.
I attribute this to when we go back a few months, and everything was selling in competing offers some consumers bid extremely high to make sure they got the home. With competing offers happening less frequently buyers are becoming more cautious in what they are paying. In summary we were artificially high, and the market is just settling out to where it should be.
Calgary Real Estate Benchmark Year to Date Sales Price: See chart below.
Year to date all sectors have seen substantial increases with the highest increases being in the detached sector. See chart below for details. Even though prices dropped a little last month the overall Benchmark price for all sectors is still 10.52% higher than in January of this year.
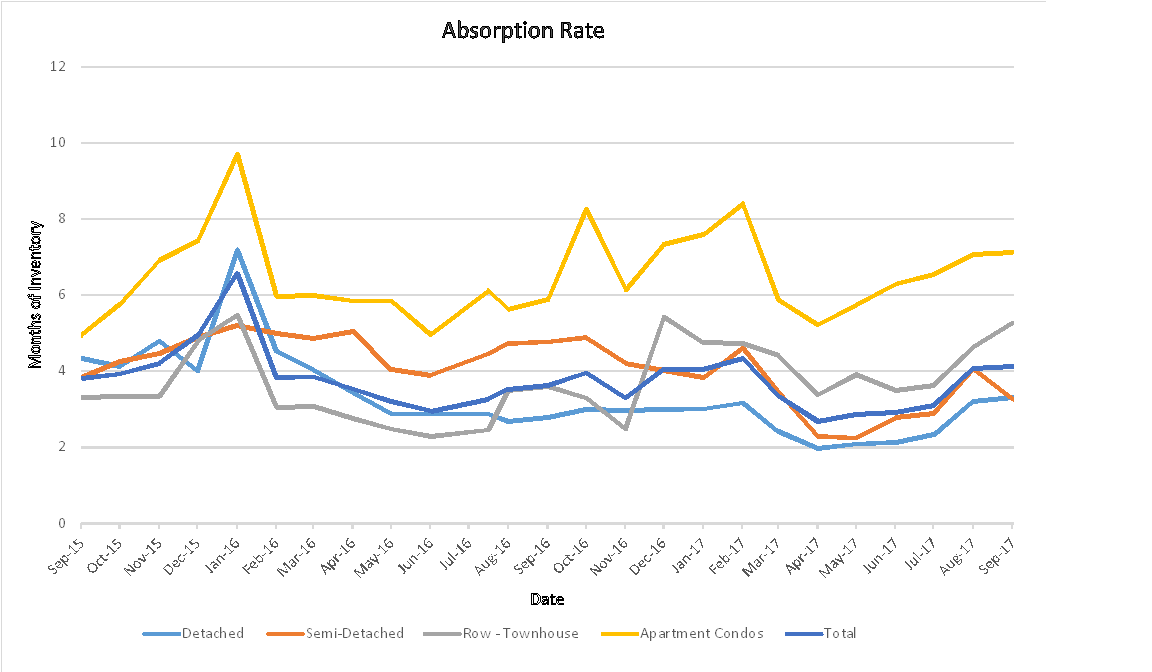
Current Months of Inventory (Absorption Rate):
The months of inventory declined in all sectors during August. Simply put our Inventory decreased by 10.5% and our sales only decreased by 5.24%. What I find interesting is if you look at my graph above months of inventory increased for about three months and now it declined again. This is just the market trying to figure out where it should be in our new normal.
What might the last half of 2022 bring: (again just my opinion)
Although we had one month of our Months of inventory decreasing, we are on our way towards a more balanced market. As noted above apartment condos have already entered balanced territory. This depends on if the Bank of Canada does another interest rate hike which I believe is likely.
Below is a summary of numbers in chart form. All numbers are taken from the Calgary Real Estate Boards monthly Stats package.
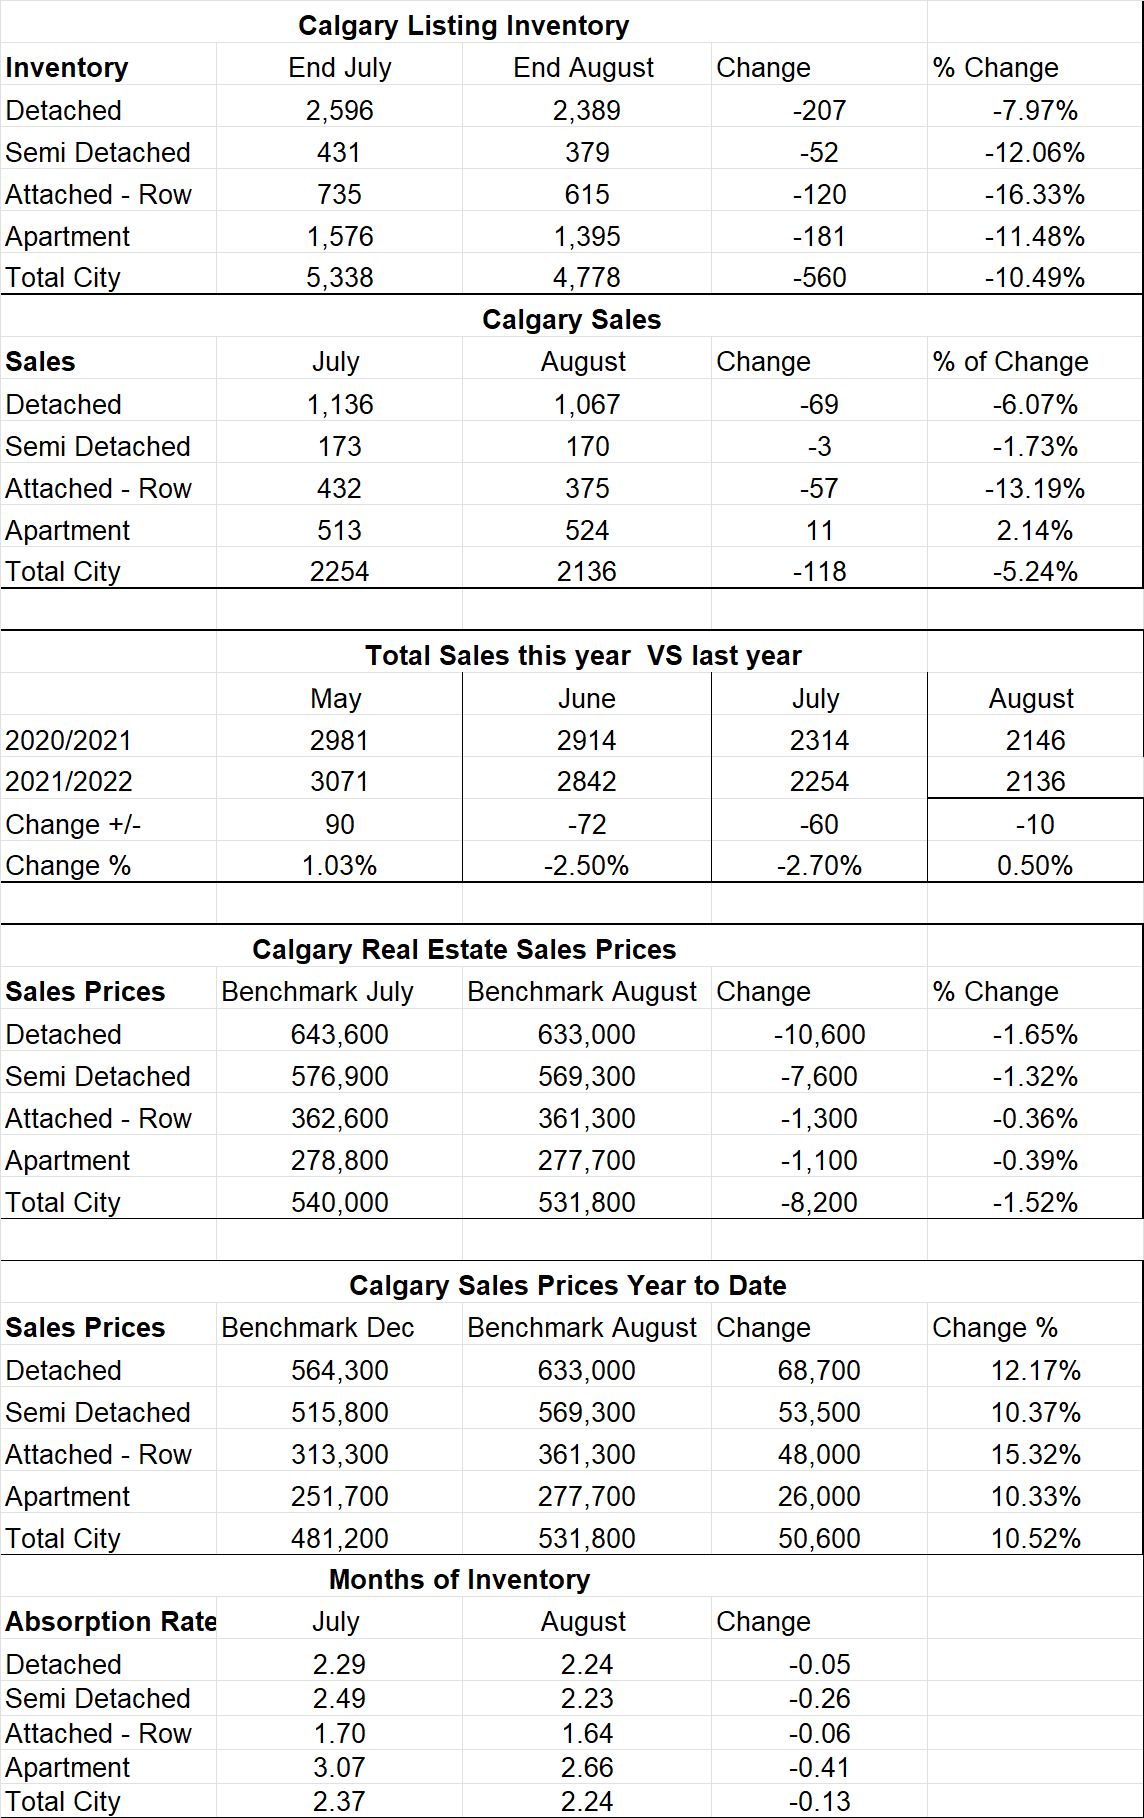
Key Stats from the Calgary Real Estate Boards Stats Package.