Posts Tagged ‘What is happening in calgary real estate market?’

Calgary Real Estate Market Snapshot Feb 1, 2019

Friday, February 1st, 2019

What is really happening in the Calgary Real Estate Market?

Stay ahead of everyone else by following our Monthly Market Snapshot of the Calgary Real Estate Market. This shows what’s really happening! The market is driven by supply and demand so here we show the inventory (supply) and sales (demand) and most importantly the relationship between the two and how it affects the price of Calgary Real Estate.  A simple way to keep up to date with how the market is trending and to stay ahead of most! All numbers are taken from the Calgary Real Estate Boards Stats package for Realtors. I have also included some general comments which are simply my opinion.

Months of Inventory:  If we did not list any more homes this is how many months it would take to deplete inventory.

Months of Inventory/Absorption Rate – the inventory divided by the number of sales in the last month). What does this mean you might ask?

Buyer’s Market >4.0 Drives prices down
Balanced Market Between 2.4 to 4.0 Prices typically remain stable
Seller’s Market <2.4 Drives prices up


Current Report: Feb 1, 2019 

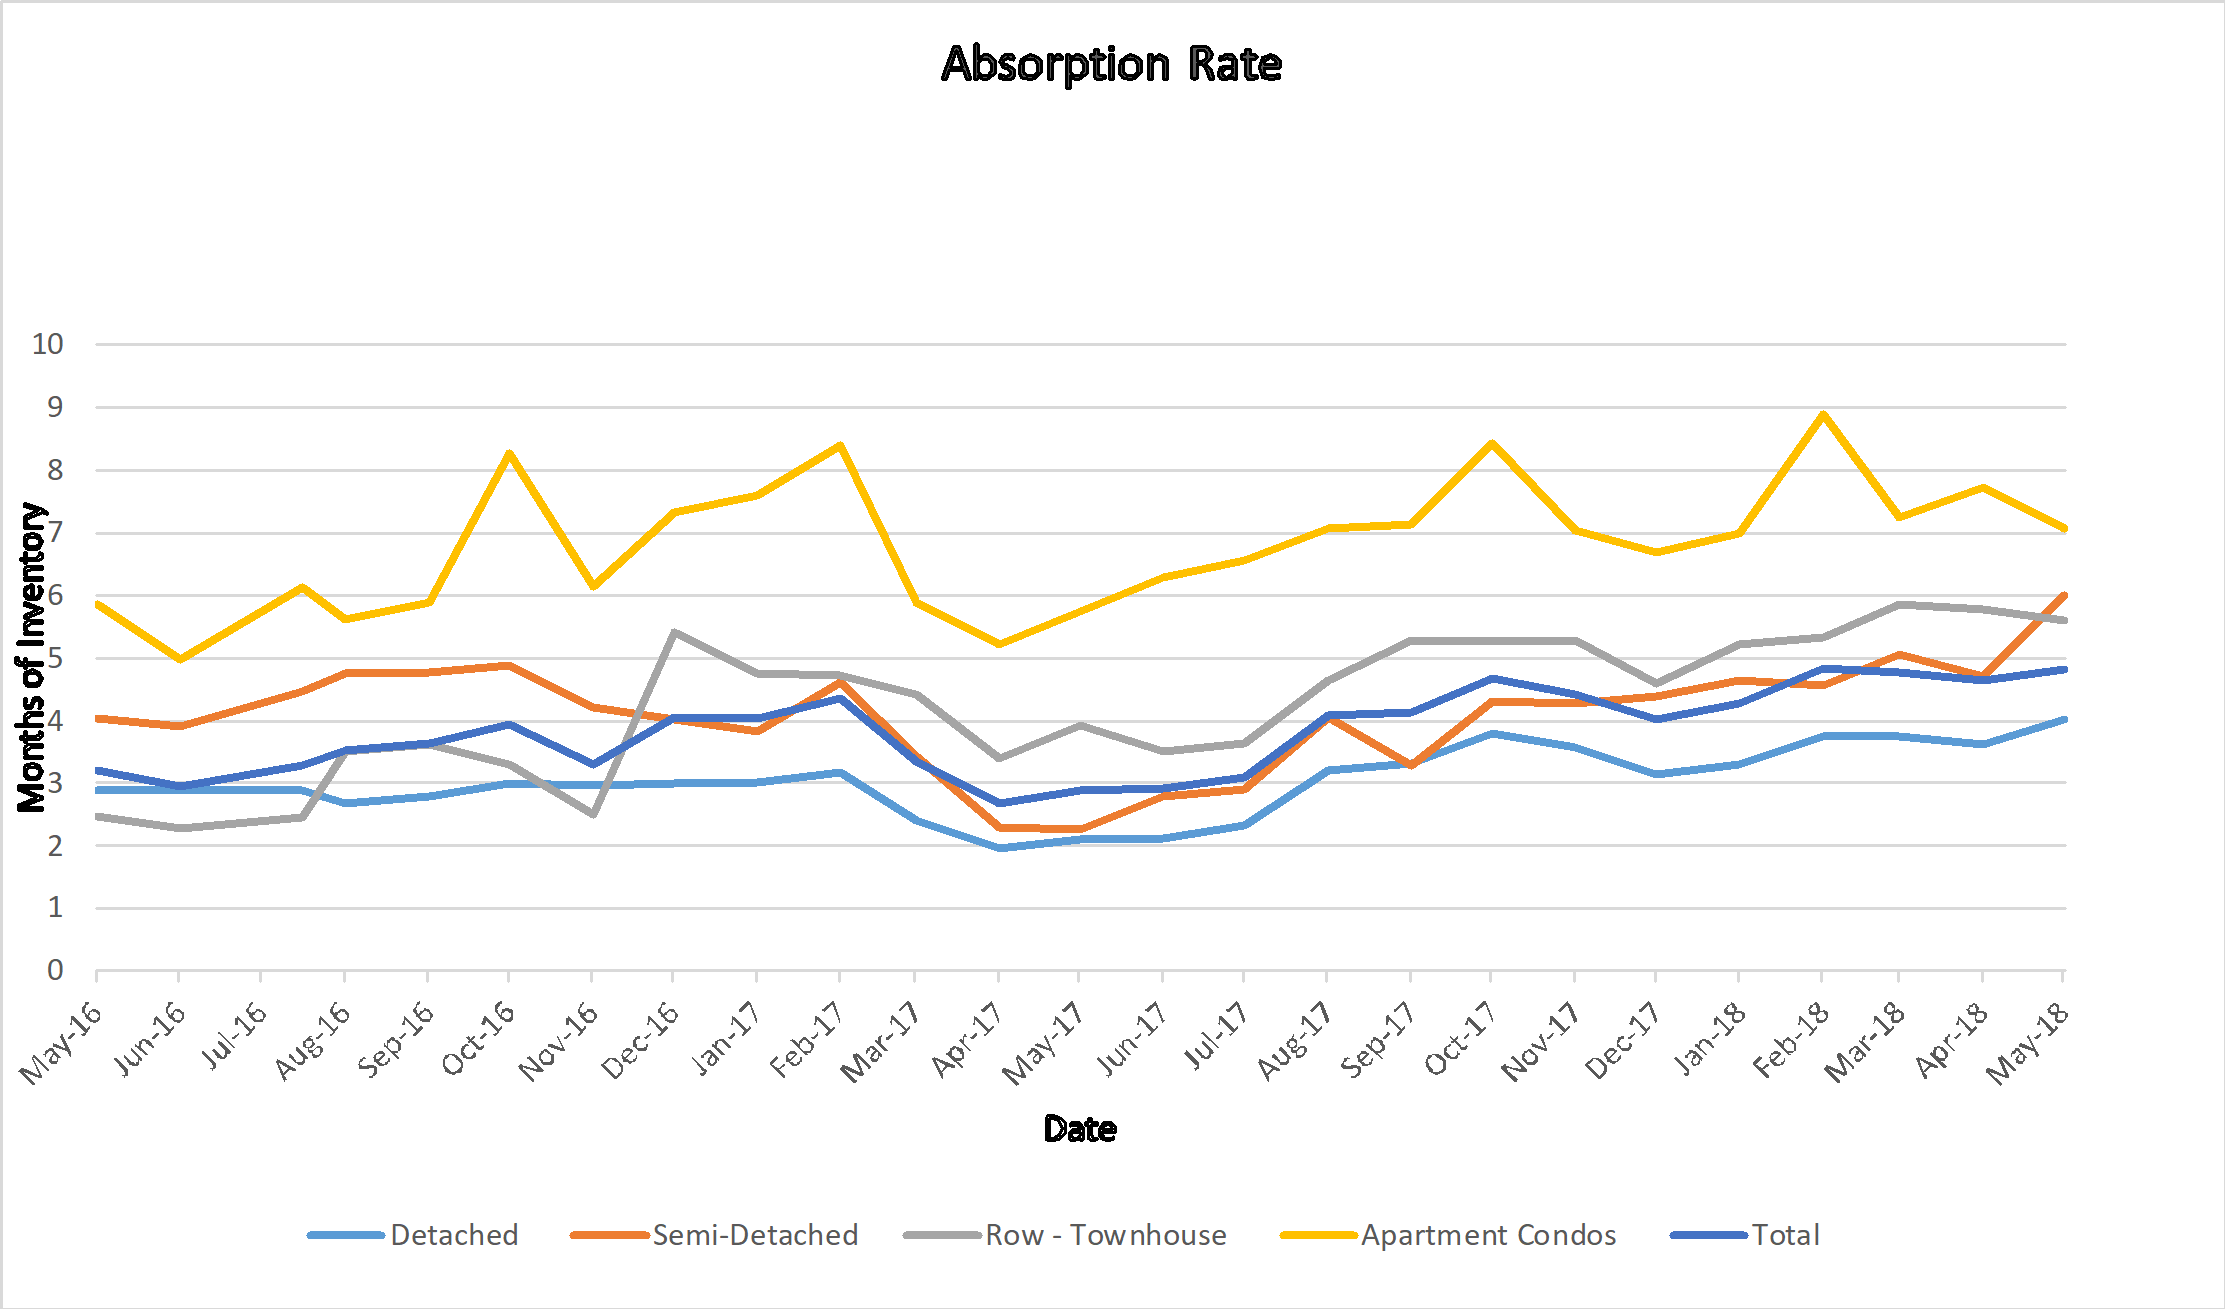
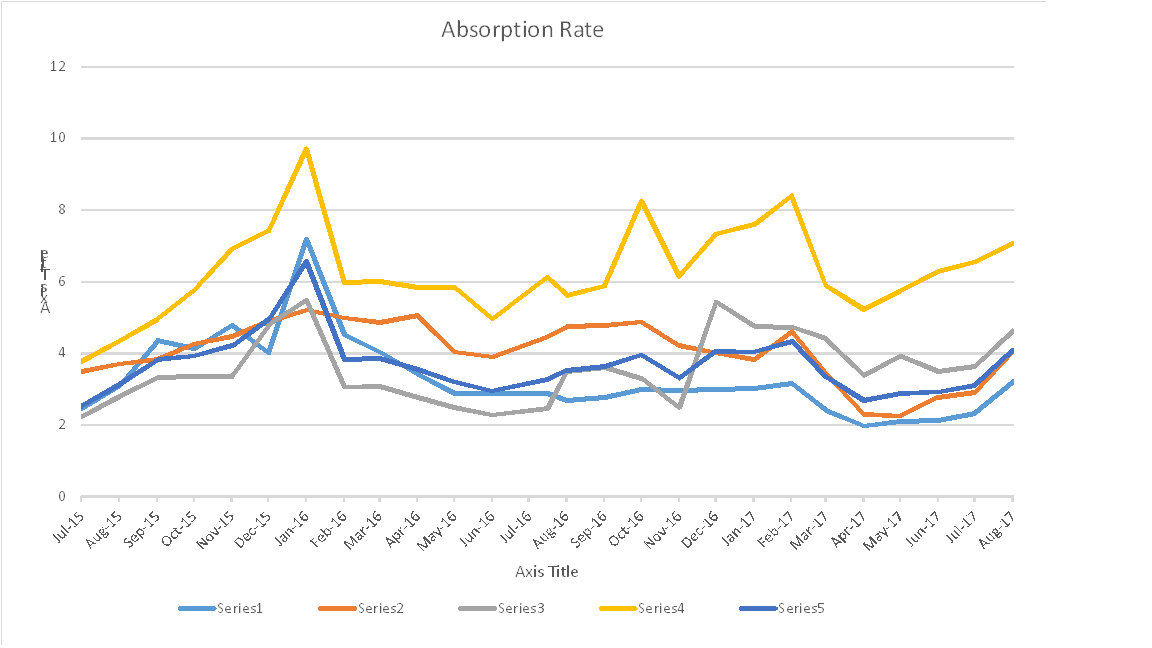
Months of Inventory Trend Last 2 Years


Current Months of Inventory: 

In January our months of inventory increased in all categories except Apartment Condo’s which decreased a little.  This puts every segment of the market into a substantial buyers market.

End of December 2018    January 2019 Change
Detached 5.23 5.83 0.60
Semi Detached 6.50 7.64 1.14
Attached – Row 6.81 7.64 0.83
Apartment 9.69 9.31 -0.38
Total City 6.16 6.81 0.65


Calgary Listing Inventory

In January our months of inventory increased in all categories.  An increase of inventory in January is 100% expected as many people do not want to sell over the holidays and wait until Jan.

Inventory December 2018    January 2019 Change
 Detached 2598 2834 236
Semi Detached 572 649 77
Attached – Row 715 817 102
Apartment 1027 1173 146
Total Calgary 4904 5473 569

Calgary Sales:

Sales for January were almost equal to December’s sales.  In my opinion this is not a good sign as sales in January should be starting to pick up.

Calgary Sales  December 2018    January 2019 Change % Change
Detached 497 486 -11 -2.21%
Semi Detached 88 85 -3 -3.41%
Attached – Row 105 107 2 1.90%
Apartment 106 126 20 18.87%
Total City 796 804 8 1.01%


***Sales Compared to last year***

Although only doing 83.8% of last years sales sounds terrible if we look at the numbers from last year Jan sales equaled the year before – ie: The big decrease in sales started in February 2018.  Therefore I would predict that starting in February sales should be close to last years.

  Jan Feb Mar Apr May June July Aug Sept Oct Nov  Dec
2018 102% 82% 72% 80% 82% 89% 95% 93% 85.9% 89.9% 83.0 78.6
2019 83.8%


Calgary Real Estate Sales Prices:

December saw prices decrease in all sectors with the largest decrease being in the Detached home sector.  This is expected with the high number of months of inventory on the market.  Unless something changes we can expect to see this trend for a few more months.

  Sales Prices Dec 2018     Benchmark Price   Jan 2019   Benchmark Price Change
Detached 481,400 476,500 -4,900
Semi Detached 397,500 393,100 -4,400
Attached – Row 288,400 284,300 -4,100
Apartment 251,500 251,300 -200
Total City 418,500 414,800 -3,700

 Sales Prices “Year to Date”  

Numbers are same as above for this month only!

Sales Prices Jan 1, 2018    Benchmark Price  Feb 1, 2019    Benchmark Price Change

$

% Change
Detached 481,400 476,500 -4,900 -1.02%
Semi Detached 397,500 393,100 -4,400 -1.11%
Attached – Row 288,400 284,300 -4,100 -1.42%
Apartment 251,500 251,300 -200 -0.08%
Total City 418,500 414,800 -3,700 -0.88%

 **Please note that these numbers include only Calgary and do change on a community basis and more so for towns. This report does not include rural properties and does not take into account differences in different price ranges.  If you would like to find stats on your community just let me know.  If you have any questions about this summary or about Real Estate in general, please feel free to contact us.

Calgary Real Estate Market Snapshot- May 1, 2018

Wednesday, May 2nd, 2018

What is really happening in the Calgary Real Estate Market?


Months of housing inventory for last 2 years.


What is really happening in the Calgary Real Estate Market?

Stay ahead of everyone else by following our Monthly Market Snapshot of the Calgary Real Estate Market, This shows what’s really happening! The market is driven by supply and demand so here we show the inventory (supply) and sales (demand) and most importantly the relationship between the two and how it affects the price of Calgary Real Estate.  A simple way to keep up to date with how the market is trending and to stay ahead of most! All numbers are taken from the Calgary Real Estate Boards Stats package for Realtors. I have also included some general comments which are simply my opinion.

Absorption Rate (Months of Inventory – the inventory divided by the number of sales in the last month). What does this mean you might ask?

Buyer’s Market >4.0 Drives prices down
Balanced Market Between 2.4 to 4.0 Prices typically remain stable
Seller’s Market <2.4 Drives prices up


April end  Absorption Rate

For the month of April we had some larger changes here.  Semi-Detached increased by 1.3, Detached increased by .4, while apartment condos decreased by .65 which has been drastically needed.  In my opinion we can be thankful that our inventory to sales is staying somewhat balanced considering the lull in sales.

End of Mar 2018    Apr 2018    Change
Detached 3.61 4.01 0.40
Semi Detached 4.70 6.00 1.30
Attached – Row 5.77 5.60 -0.17
Apartment 7.72 7.06 -0.65
Total City 4.64 4.82 0.19


Calgary Listing Inventory

In April, our inventory increased in all Sectors. This is totally expected at this time of year.  This trend is anticipated until the end of June as more people list their homes in Spring.

Inventory Mar 2018    Apr 2018    Change
Detached 3063 3642 579
Semi Detached 677 756 79
Attached – Row 941 1075 134
Apartment 1690 1851 161
Total City 6371 7324 953


Calgary Sales:

While our monthly numbers are trending upwards in all categories except Semi-detached these stats don’t show the comparison to last year.  Compared to last year Jan to April end we are down in Sales by 19.6%

As pointed out last month this can be due to a number of factors including but not limited to:

  • Weather
  • Mortgage rules changes from Jan 1
  • Calgary’s economy
  • Consumer lack of confidence.


Calgary Sales  Mar 2018    Apr 2018    Change % Change
Detached 848 908 60 7.08%
Semi Detached 144 126 -18 -12.50%
Attached – Row 163 192 29 17.79%
Apartment 219 262 43 19.63%
Total City 1374 1518 144 10.48%


Calgary Real Estate Sales Prices:

Prices in April showed very little change for all categories.  All categories increased with the exception of Apartment Condos and based on the absorption rate this will continue for some time.

  Sales Prices Mar 2018    Benchmark Price   Apr 2018   Benchmark Price Change
Detached 503,800 504,500 700
Semi Detached 418,800 420,000 1,200
Attached – Row 297,600 300,000 2,400
Apartment 257,100 256,700 -400
Total City 435,600 436,500 900


Sales Prices “Year to Date”  

Sales Prices Jan 1, 2018    Benchmark Price  Apr 2018   Benchmark Price Change

$

% Change
Detached 499,600 504,500 4,900 0.98%
Semi Detached 416,600 420,000 3,400 0.82%
Attached – Row 299,500 300,000 500 0.17%
Apartment 257,700 256,700 -1,000 -0.39%
Total City 433,200 436,500 3,300 0.76%


**Please note that these numbers include only Calgary homes and do change on a community basis and more so for towns.  This report does not include rural properties.  If you would like to find stats on your community or if you have any questions about this summary or about Real Estate in general, please feel free to contact us.


August 1, 2017 Market Snapshot

Wednesday, August 2nd, 2017

Absorption Rate Graph

What is really happening in the Calgary Real Estate Market?

Stay ahead of everyone else by following our Monthly Market Snapshot of the Calgary Real Estate Market This shows what’s really happening! The market is driven by supply and demand so here we show the inventory (supply) and sales (demand) and most importantly the relationship between the two and how it affects the price of Calgary Real Estate.  A simple way to keep up to date with how the market is trending and to stay ahead of most! All numbers are taken from the Calgary Real Estate Boards Stats package for Realtors. I have also included some general comments which are simply my opinion.

Absorption Rate (Months of Inventory)   (the inventory divided by the number of sales in the last month). What does this mean you might ask?

Buyer’s Market >4.0 Drives prices down
Balanced Market Between 2.4 to 4.0 Prices typically remain stable
Seller’s Market <2.4 Drives prices up

Important Disclaimer:  ***Error***   For those who regularly follow my Market Snapshot you may notice the numbers from last month do not jive with the numbers from this month.  It appears to me that this is a correction reversing last month’s numbers from the Real Estate Board.

The chart below shows the change in Sales Price numbers for June and July, so you can see it’s a numbers correction and not what’s really happening.  Hopefully this is the last error!

These numbers also reflect what I am seeing in the Market with infills rising and townhouses declining in price.


June Prices July Prices Net Change 2 Months
Semi-Detached +39,000 (11,300) +27,700
Row – Townhouses (14,300) +12,700 (1,600)

_______________________________________________________________________________

August Market Snapshot Report 

*** Absorption Rate

The Absorption rate for July saw all categories increase.   This is somewhat normal for this time of year as the majority of summer vacations are taken between July 15th to Aug 15th.  Our scorching weather may have played a factor in this as well.


June 2017 July  2017  Change
Detached 2.33 3.21 0.88
Semi Detached 2.90 4.05 1.15
Attached – Row 3.63 4.63 1.01
Apartment 6.55 7.07 0.52
Total City 3.11 4.08 0.97


Calgary Listing Inventory

In July we saw an increase in all categories except apartment condos.  I’m speculating the only reason we saw a decline in apartment condos is that many of the listings that are not selling are starting to expire.

Inventory June 2017 July  2017  Change
Detached 3224 3268 44
Semi Detached 560 596 36
Attached – Row 1001 1001 0
Apartment 1874 1810 -64
Total City 6659 6675 16


Calgary Sales:

As you can see sales declined in all categories in July.  Once again I believe this change to be mostly seasonal and also partially due to the hot weather.  This is the first month in a while where we have seen such large decreases.

Calgary Sales  June 2017 July  2017  Change % Change
Detached 1385 1018 -367 -26.50%
Semi Detached 193 147 -46 -23.83%
Attached – Row 276 216 -60 -21.74%
Apartment 286 256 -30 -10.49%
Total City 2140 1637 -503 -23.50%


Calgary Real Estate Sales Prices:

For July we saw small increases in price with the exception of the data errors mentioned above.

Moving forward I expect that detached and semi-detached will remain flat, townhouses may decrease a little more and apartment condos will continue to decrease.

  Sales Prices June 2017 Benchmark Price   July  2017  Benchmark Price Change
Detached 509,400 512,100 2,700
Semi Detached 432,100 420,800 -11,300
Attached – Row 294,000 306,700 12,700
Apartment 265,800 266,200 400
Total City 441,500 443,600 2,100


Sales Prices “Year to Date”  


Sales Prices Jan 1, 2017    Benchmark Price  June 2017  Benchmark Price Change

$

% Change
Detached 498,700 512,100 13,400 2.69%
Semi Detached 406,800 420,800 14,000 3.44%
Attached – Row 302,600 306,700 4,100 1.35%
Apartment 265,000 266,200 1,200 0.45%
Total City 433,400 443,600 10,200 2.35%


**Please note that these numbers include only Calgary homes and do change on a community basis and more so for towns.  This report does not include rural properties.  If you would like to find stats on your community just let me know.  If you have any questions about this summary or Real Estate questions please feel free to contact us.

TSW Real Estate Group

Gord Piper & Brent Wilcox


June 1, 2016 Calgary Real Estate Market Snapshot

Thursday, June 2nd, 2016

Stay ahead of everyone else by following our Monthly Market Snapshot of the Calgary Real Estate Market. This shows what’s really happening! The market is driven by supply and demand so here we show the inventory (supply) and sales (demand) and most importantly the relationship between the two and how it affects the price of Calgary Real Estate.  A simple way to keep up to date and ahead of most! All numbers are taken from the Calgary Real Estate Boards Stats package for Realtors. I have also included some general comments which are simply my opinion.

Absorption Rate (Months of Inventory)   (the inventory divided by the number of sales in the last month). What does this mean you might ask?

Buyer’s Market >4.0 Drives prices down
Balanced Market Between 2.8 to 4.0 Prices typically remain stable
Seller’s Market <2.8 Drives prices up


*** Absorption Rate***  

In my opinion this is the most critical number to look at.  Detached homes & Semi – detached homes are now back in a seller’s market. The only category not to decrease in absorption rate was apartment condos and they stayed flat.

April  2016 May  2016 Change
Detached 2.76 2.48 -0.28
Semi Detached 3.42 2.88 -0.54
Attached – Row 5.05 4.04 -1.01
Apartment 5.85 5.85 0.00
Total City 3.54 3.20 -0.34


Calgary Listing Inventory

May saw a slight decrease in Detached and Semi – Detached while Attached – Row and Apartment condos increased slightly.

Inventory April  2016 May  2016 Change
Detached 3127 3018 -109
Semi Detached 595 548 -47
Attached – Row 930 974 44
Apartment 1590 1608 18
Total City 6242 6148 -94


Calgary Sales:

Sales in all categories increased moderately again this month.  This is very typical for a spring market.  It is important to note that Sales are still down from normal levels but are increasing.  The big jump in sales this month was in the Attached – Row homes which increased by 31%.

Calgary Sales   April  2016 May  2016 Change % Change
Detached 1134 1217 83 7.32%
Semi Detached 174 190 16 9.20%
Attached – Row 184 241 57 30.98%
Apartment 272 275 3 1.10%
Total City 1764 1923 159 9.01%


Calgary Real Estate Sales Prices: 

Interesting that all categories decreased in prices.  In my opinion, I believe it is simply because of what is happening in the general Calgary economy and Buyers and Sellers are not aware of how the market has shifted direction and everyone is still acting like it’s a buyer’s market.  Buyers are bringing low offers, and sellers are happy just to get an offer and are willing to settle a little lower.

  Sales Prices April  2016

Benchmark Price 

   May   2016

Benchmark Price

Change
Detached 501500 500500 -1000
Semi Detached 383600 383100 -500
Attached – Row 314800 313200 -1600
Apartment 280400 278500 -1900
Total City 441000 439700 -1300


Sales Prices “Year to Date”   

Year to date prices

Sales Prices Dec 31, 2015   Benchmark Price  May  2016

Benchmark Price

Change

$

% Change
Detached 514100 501500 -12600 -2.45%
Semi Detached 393100 383600 -9500 -2.42%
Attached – Row 318500 314800 -3700 -1.16%
Apartment 288000 280,400 -7,600 -2.64%
Total City 452800 441000 -11800 -2.61%


 Price Sensitivity

It is also important to note that homes in the lower price ranges are still moving much quicker than homes in the higher price ranges.

**Please note that these numbers do change on a community basis and more so for towns.  This report does not include rural properties.  If you would like to find stats on your community just let me know.  If you have any questions about this summary or Real Estate questions please contact us.


TSW Real Estate Group