What is really happening in the Calgary Real Estate Market?
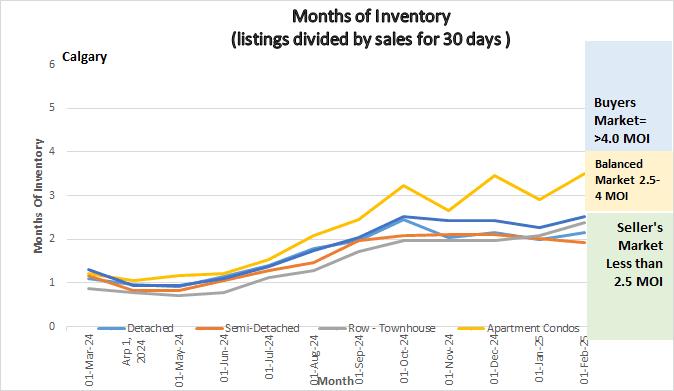
The following graph shows the months of inventory for each housing sector. Looking at a one-year trendline gives you an indication of where things are really heading.
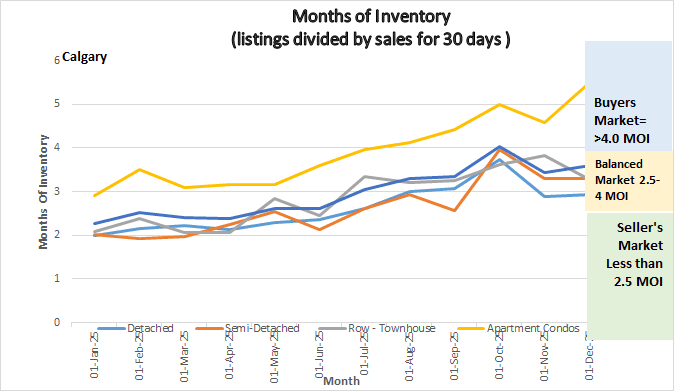
Graph shows the months of inventory for all sectors in the Calgary Real Estate Market
Gord’s commentary for the month (just my opinion).
December 1, 2025, Highlights
Inventory levels declined by 13.75% in November while sales decreased by 17.61% in November. This trend of decreased inventory and Sales is very normal for November.
*** The Months of Inventory for Apartment condominiums in November rose by .92 to 5.5 months – very deep into a buyer’s market. Prices overall fell by $9000 in November which was consistent across all Sectors except Detached Homes that only decreased by $1,300.
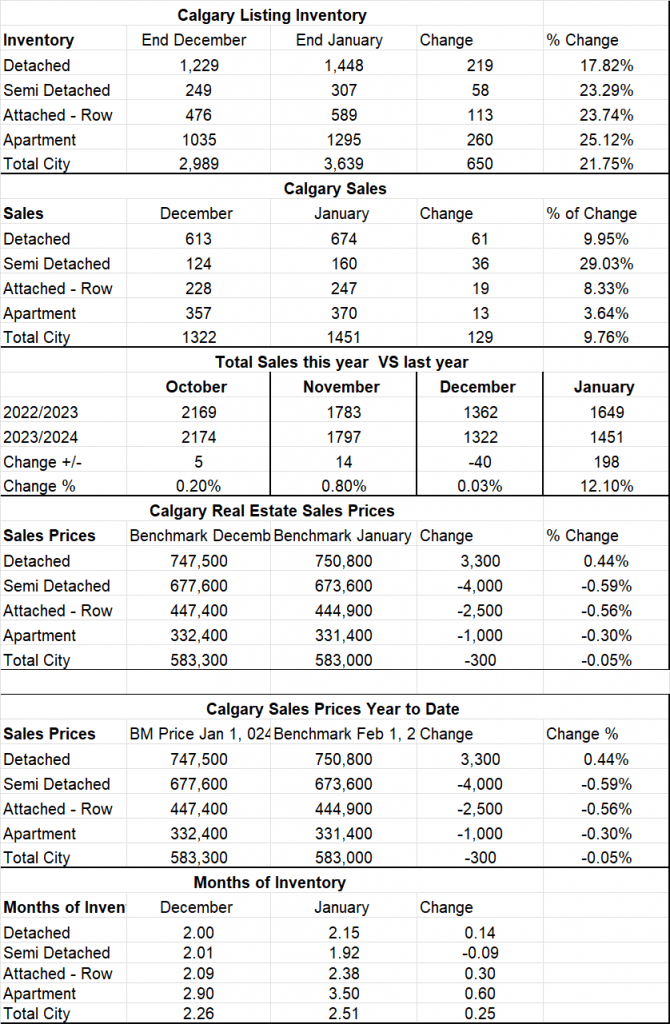
Calgary Listing Inventory
Calgary inventory levels are 28% higher than last year and over 15% higher than typical levels reported in November. As you can see from the graph the Apartment Condo market and to a lesser extent the Attached Row Sectors are driving the high inventory levels.
Calgary Sales
Sales in November decreased overall by 17.61% and this is typical for November.
Sales Compared to 2024:
November saw a decline in sales over November
2024, my belief is that this is largely due to a very strong 2024 and a more moderate 2025.
| June | July | August | Sept | October | November | |
| 2024 | 2374 | 2374 | 2182 | 2000 | 2167 | 1793 |
| 2025 | 2286 | 2099 | 1989 | 1720 | 1885 | 1553 |
| Change | 88 | -275 | -193 | -280 | -282 | -240 |
| % Change | -.04 | -11.6% | -9.7% | -14. % | -13.1 | -13.4% |
Calgary Real Estate Benchmark Sales Prices:
The overall Benchmark price for November decreased by $9,000 or 1.58% Most of this decline is from the Apartment Condo sector ((2.8%). The Attached Row Sector declined by1.58%, and the Semi-detached sector by 1.67%. The detached home sector showed the lowest decline at only .17%.
Current Months of Inventory (Absorption Rate):
The overall months of Inventory increased by .16 Again this was driven mostly by the Apartment Condo Sector and the Attached Row sector.
My Prediction for what is ahead:
My prediction over the short term is for more of the same for the next 3-4 months. I could be wrong here as we personally have seen a heightened amount of new activity in December. The heightened activity is for us, and the market numbers are certainly not showing it yet.
*Below is a summary of numbers in chart form. All numbers are taken from the Calgary Real Estate Boards monthly Stats package.
* All numbers vary by community and price ranges, if you would like stats specifically for your neighbourhood, please contact us.