What is really happening in the Calgary Real Estate Market?
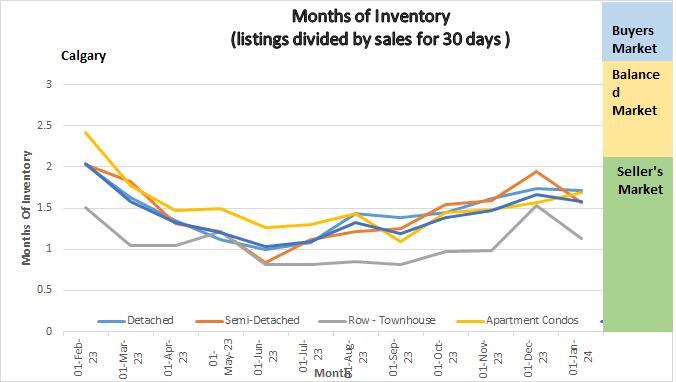
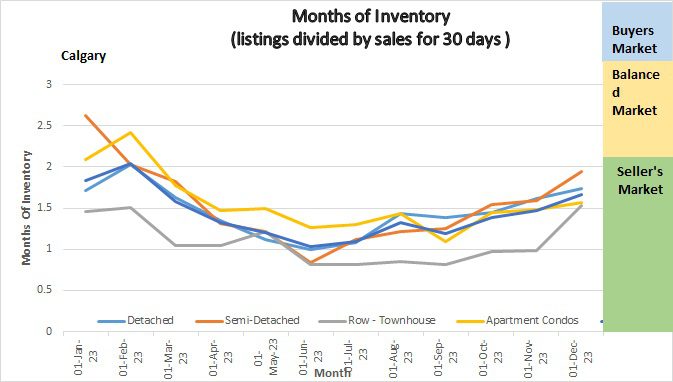
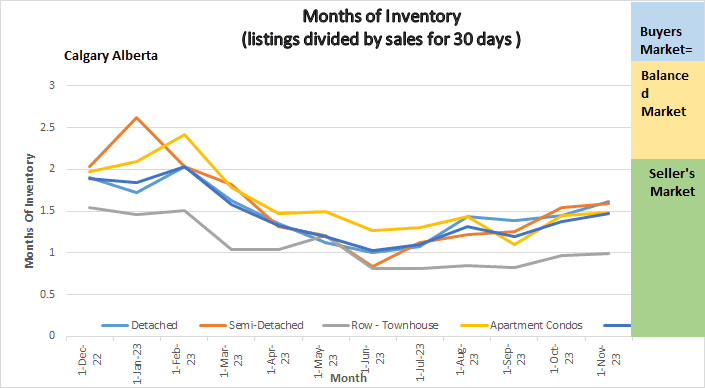
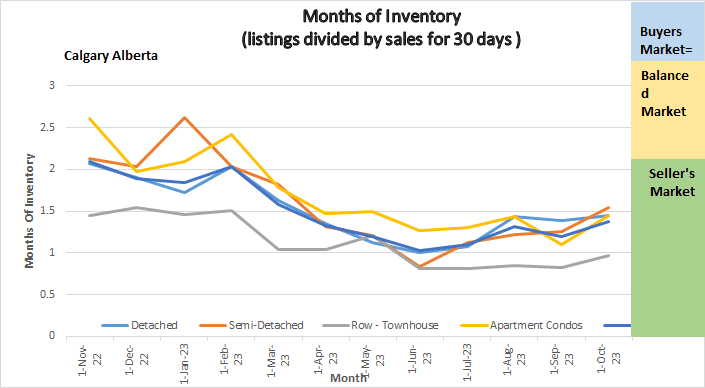
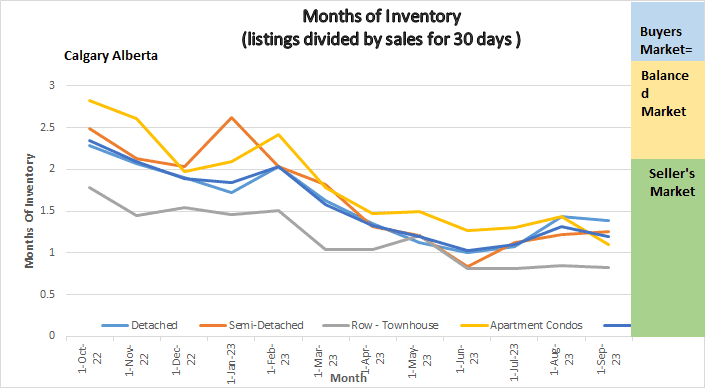
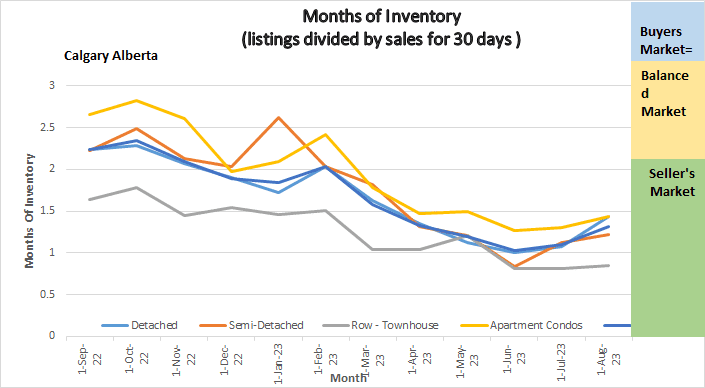
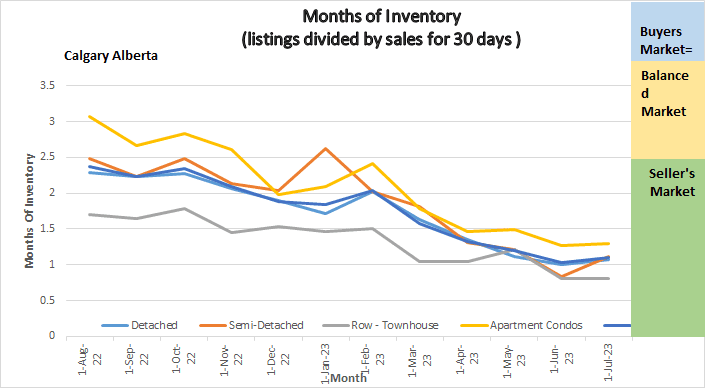
Following is a graph that shows the months of inventory for each housing sector. Looking at a one-year trendline gives you an indication of where things are really heading.
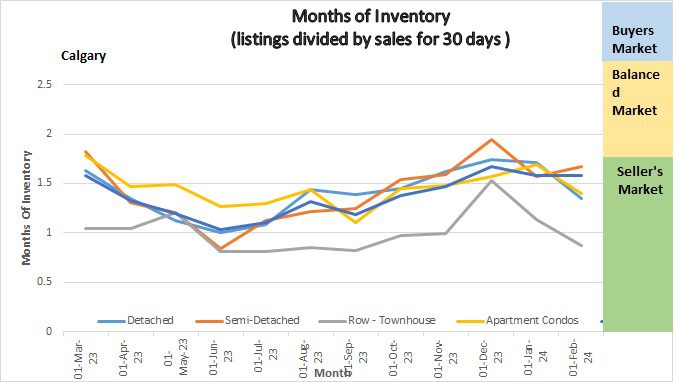
Graph of Months of Inventory
Gord’s commentary for the month (just my opinion).
January 2024 Highlights
The seasonal slowdown is over and here we go again!
- Inventory decreased again however only marginally.
- Sales increased by 20.79 over December.
- Prices increased slightly.
- Seller’s market continues….
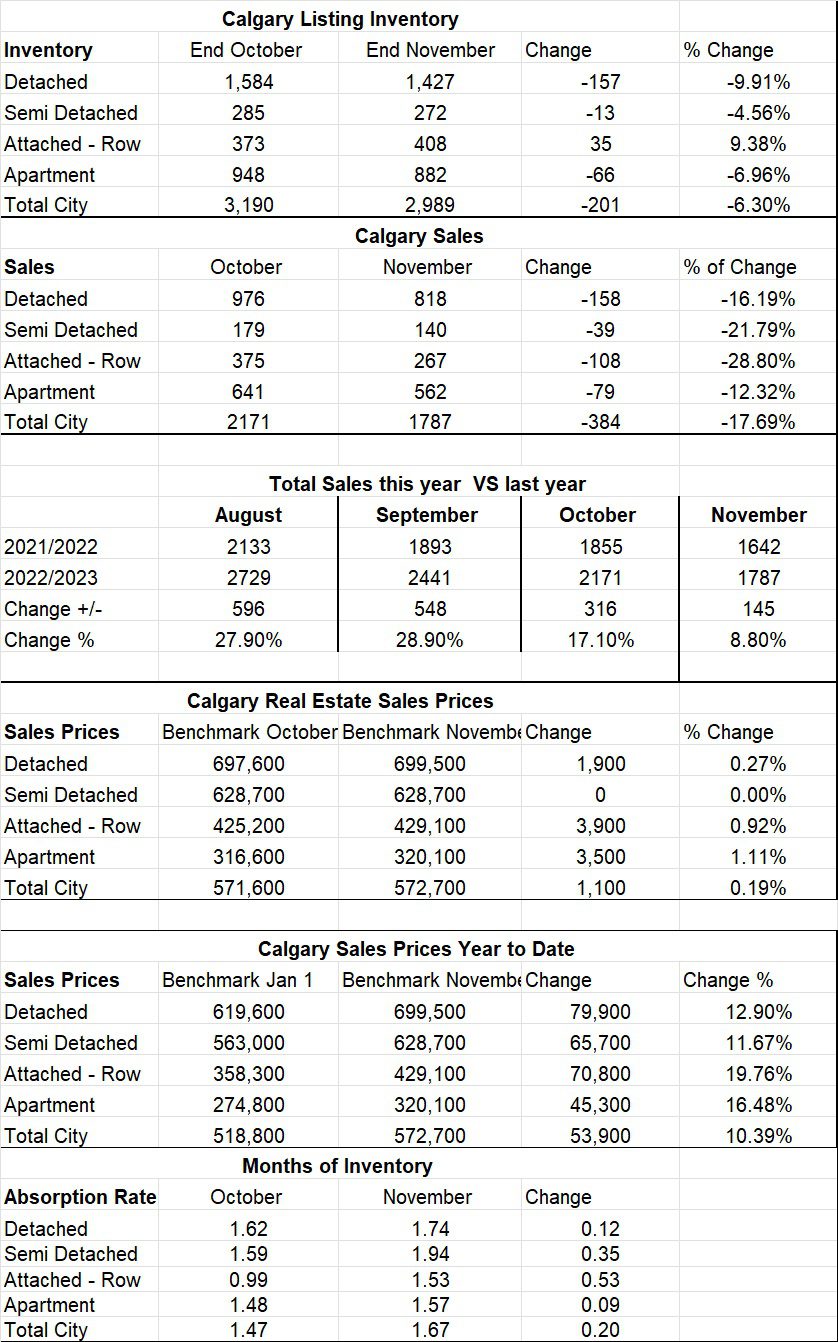
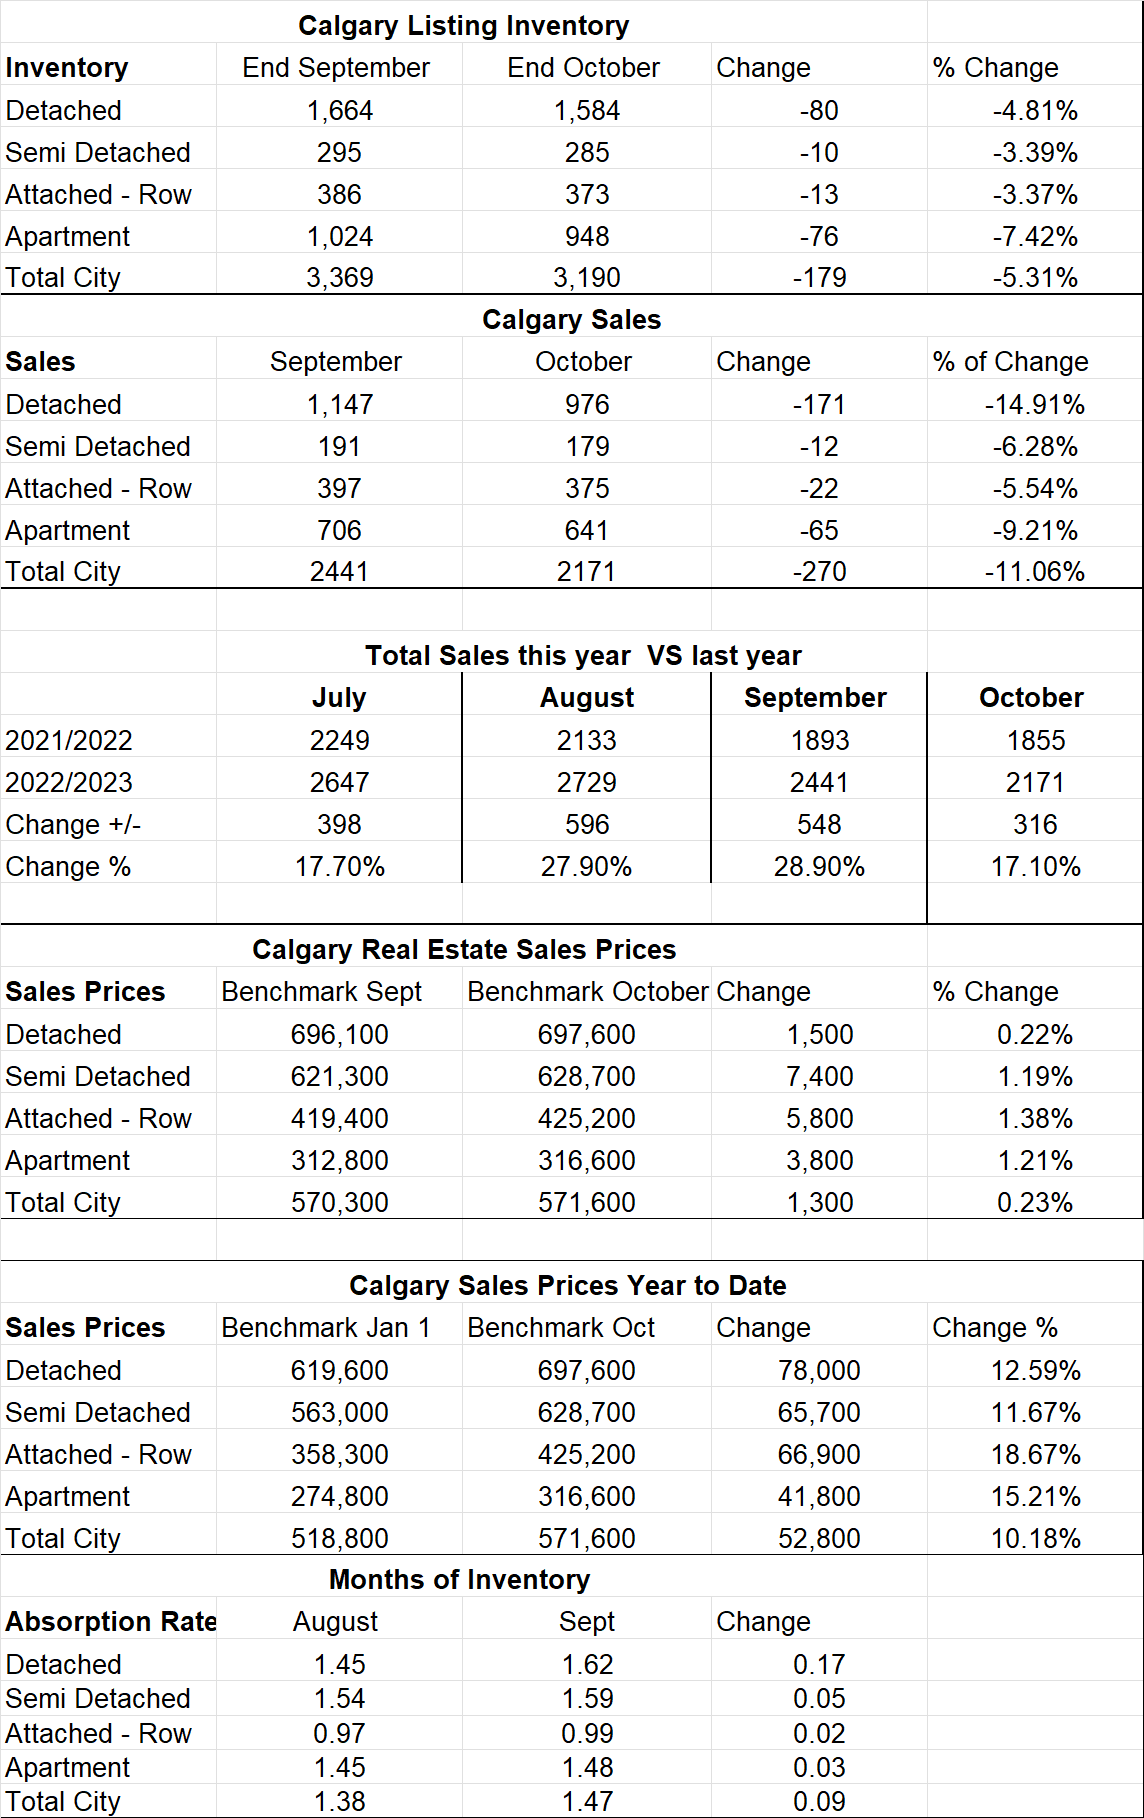
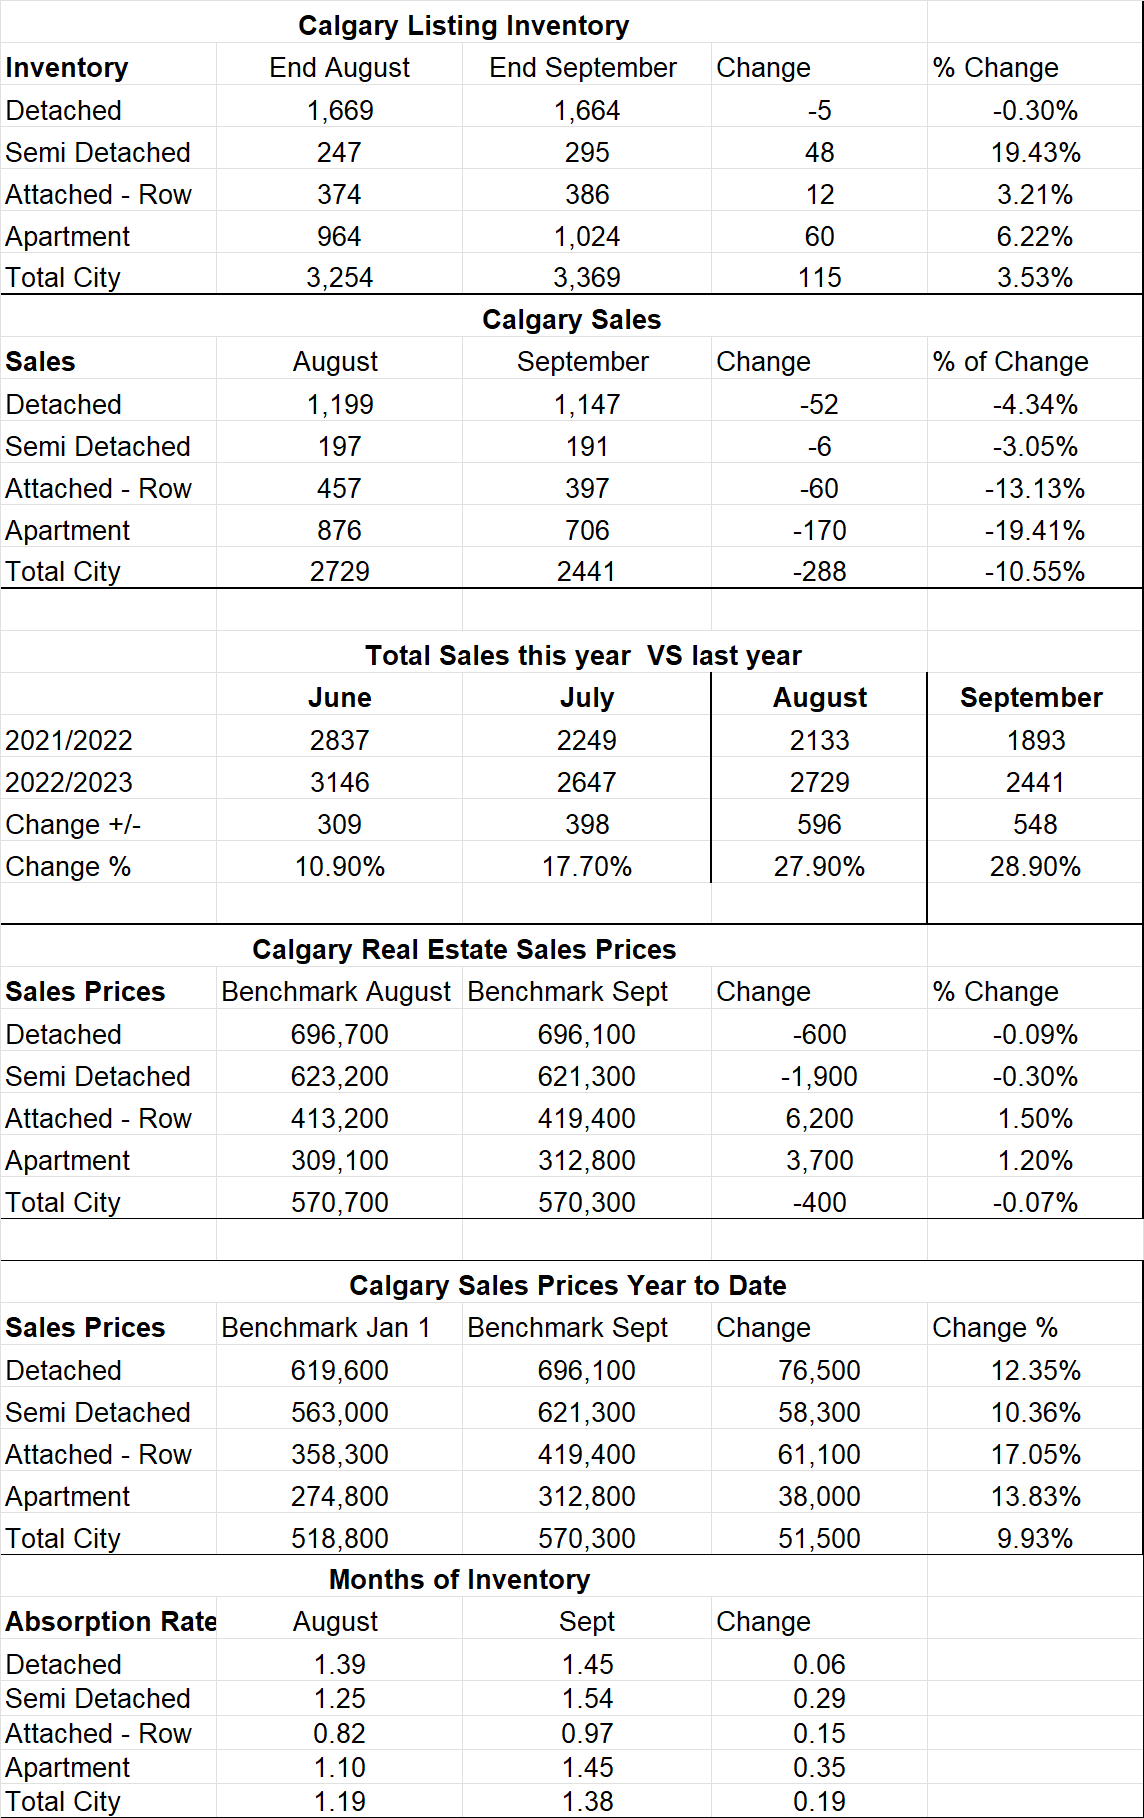
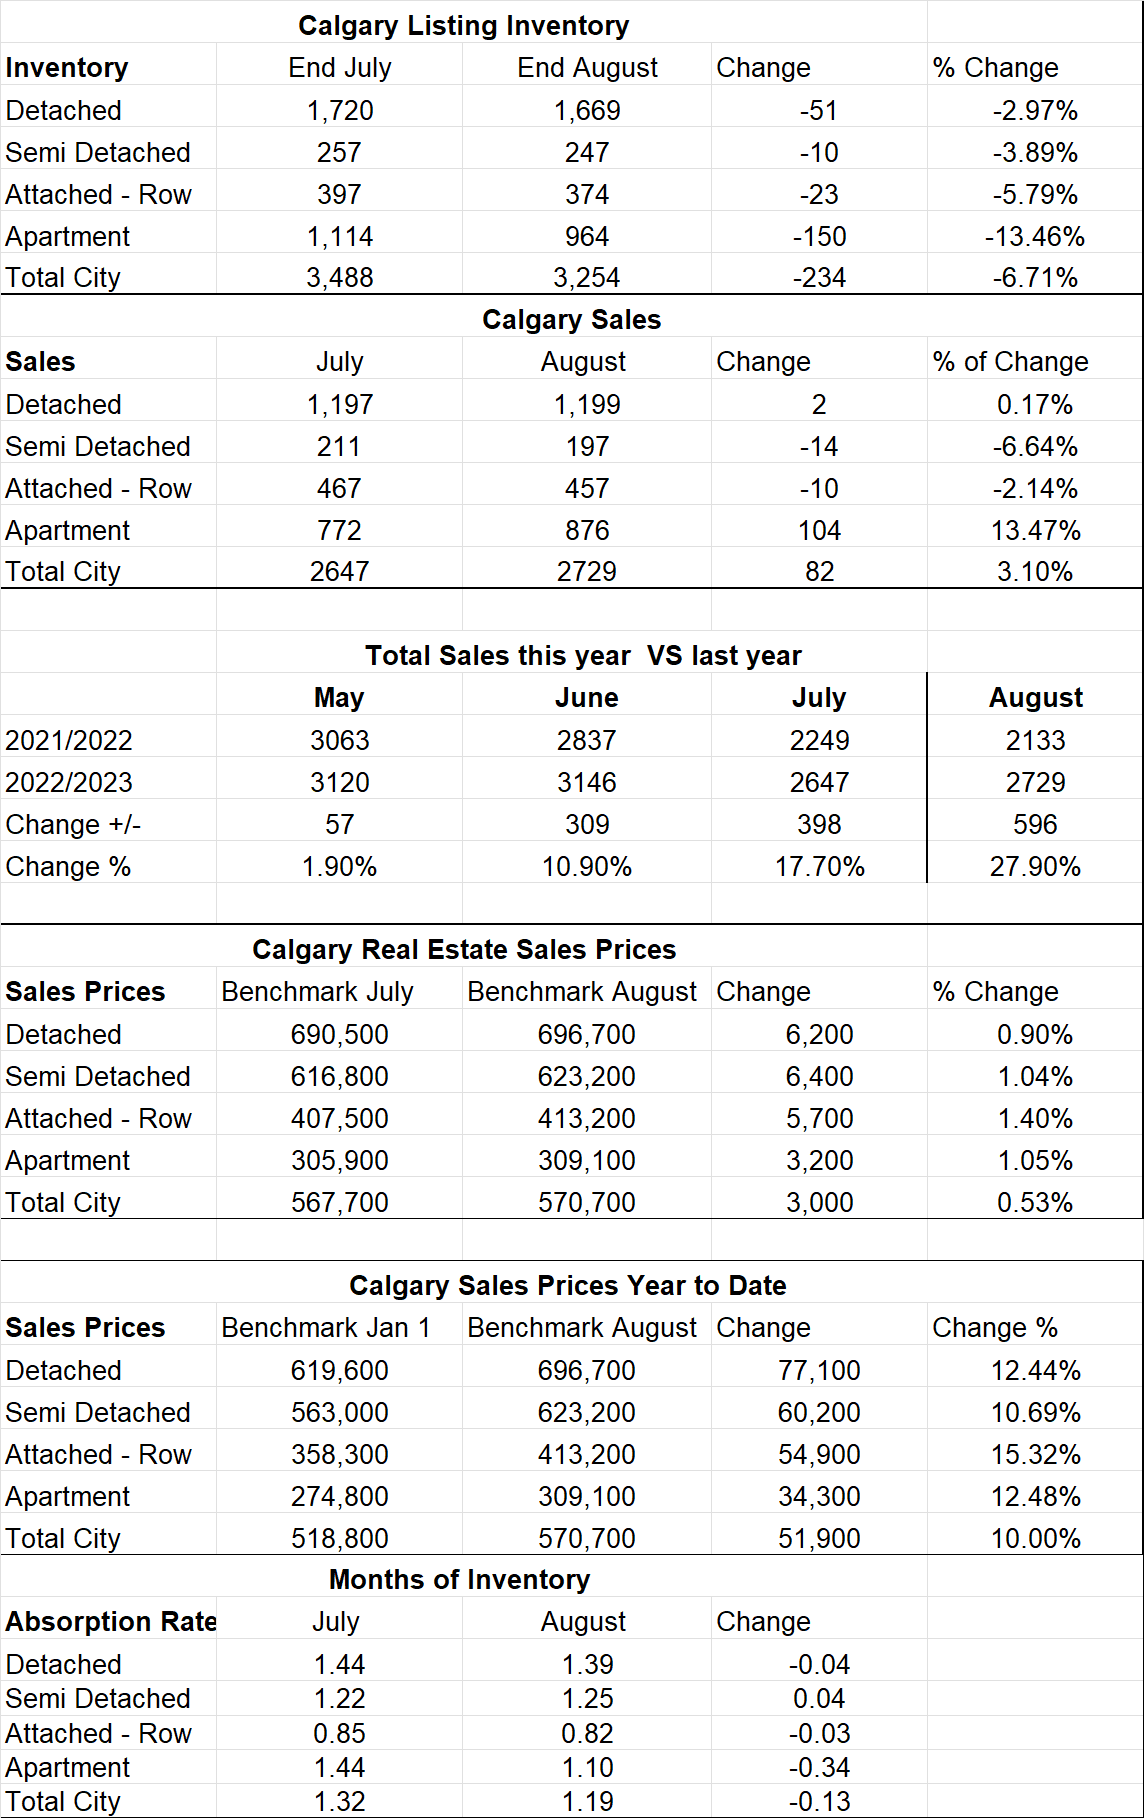
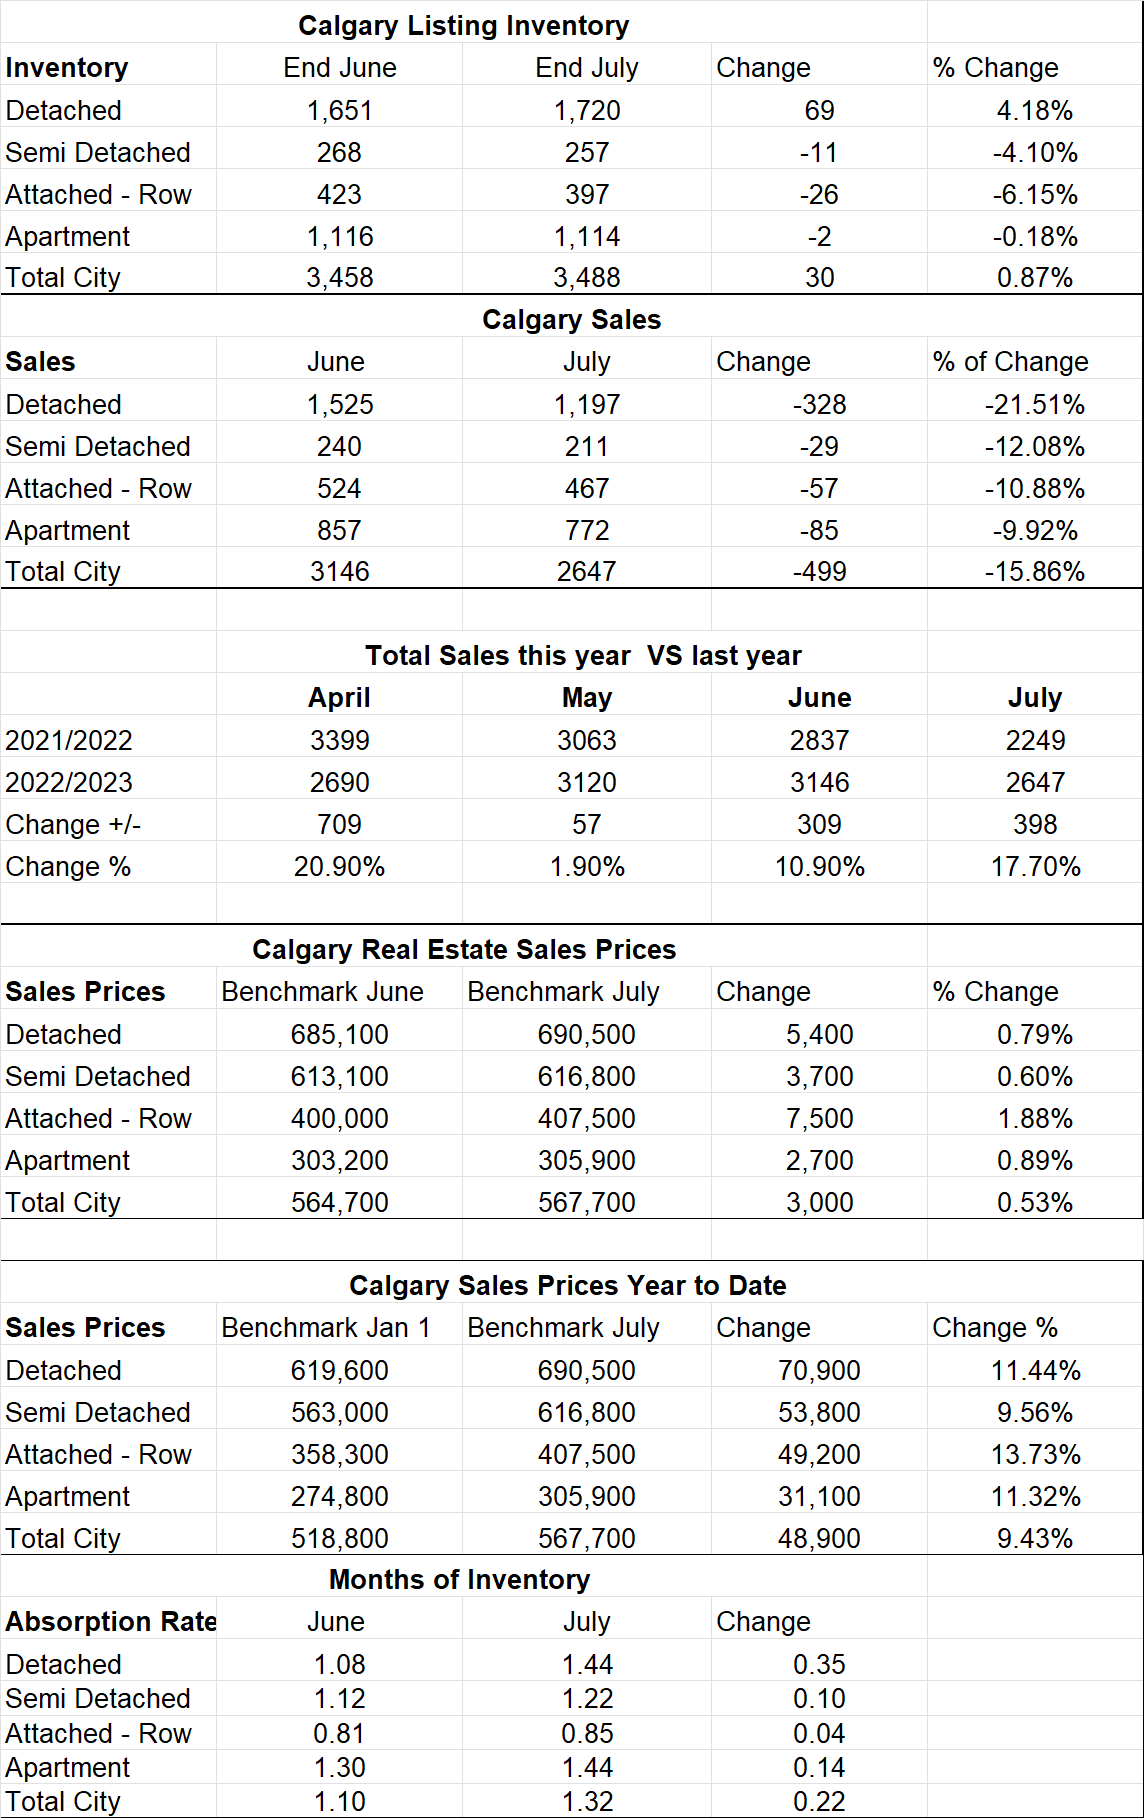
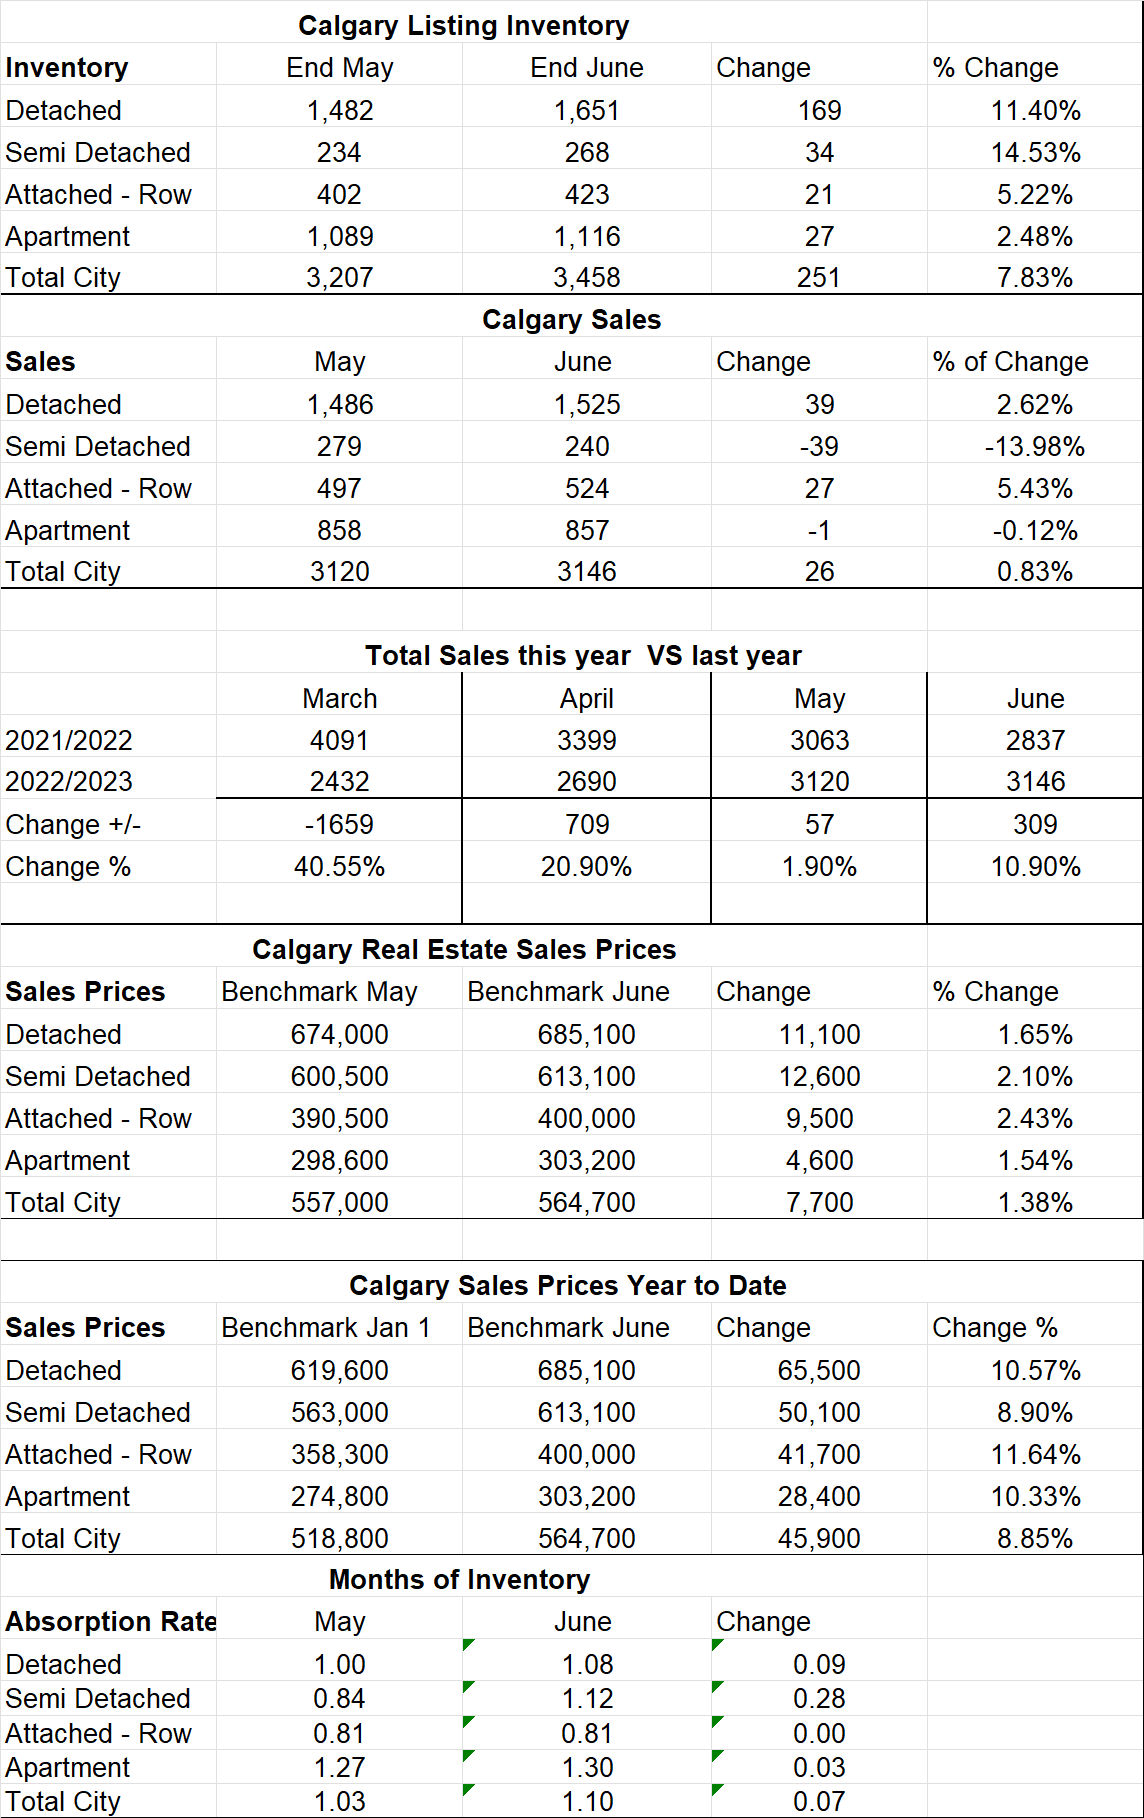
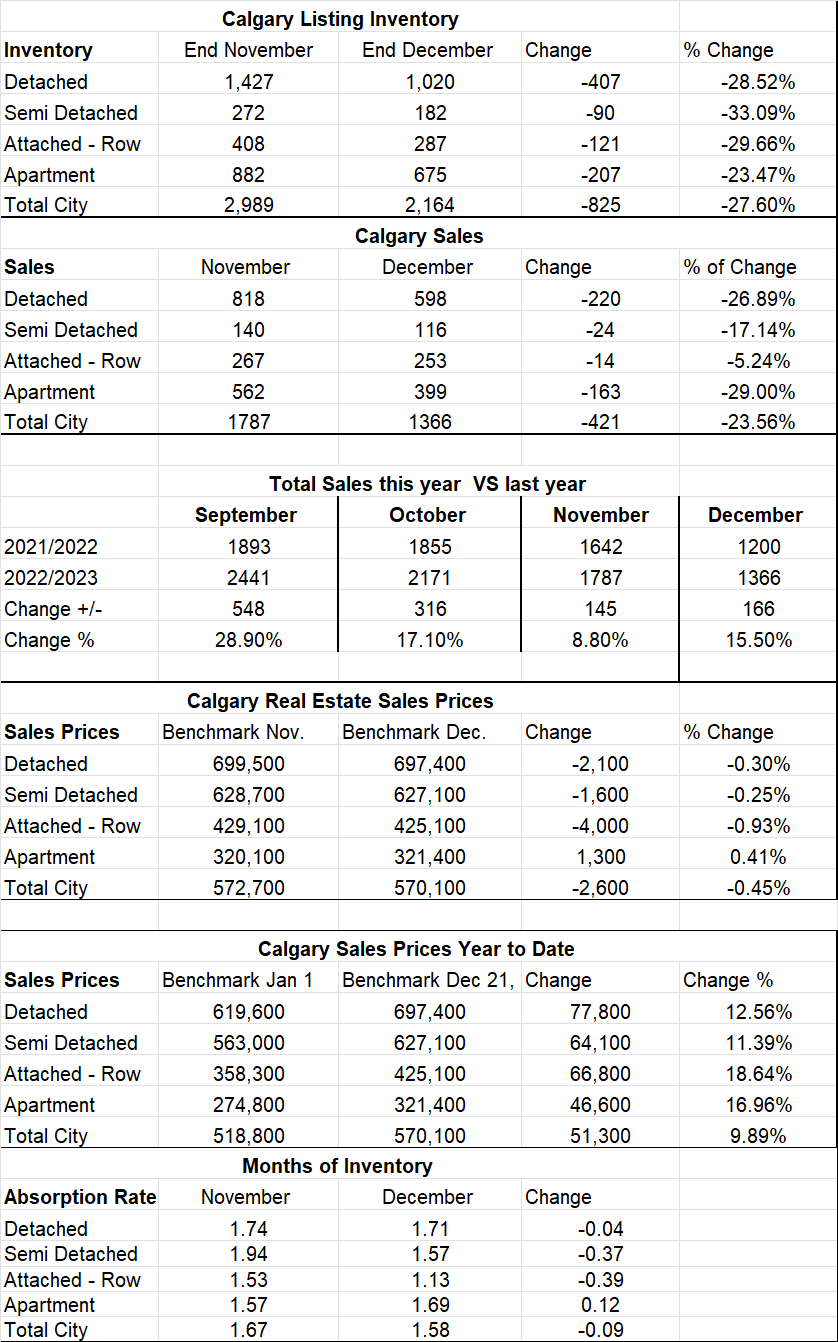
Calgary Listing Inventory
Our listing inventory declined but by only fourteen listings, so we are the same as last month.
Calgary Sales:
Sales in January increased over December by 20.79% The reason for this increase is that new listings increased to 2137 new listings in January compared to 1248 new listings in December. I have said it before, and I will say it again that our sales depend on the number of listings as the demand is far more substantial than our supply.
Sales Compared to 2022:
It is also important to look at sales compared to the Previous year. Sales for November were up by 8.8% from last year. The demand is still extraordinarily strong so the more we can list the more we sell.
| Jan | Feb | Mar | Apr | May | June | |
| 2022 | 1198 | |||||
| 2023 | 1650 | |||||
| Change | +452 | |||||
| % Change | 37.7% |
| July 2023 | Aug 2023 | Sept 2023 | Oct 2023 | Nov 2023 | Dec 2023 | |
| 2022 | 2249 | 2133 | 1893 | 1855 | 1642 | 1200 |
| 2023 | 2647 | 2729 | 2441 | 2171 | 1787 | 1366 |
| Change | +398 | +596 | +548 | 316 | +145 | +166 |
| % Change | +17.7% | 27.9% | +28.9% | +17.1% | 8.8% | 15.5% |
Calgary Real Estate Benchmark Sales Prices:
The overall Benchmark price increased by $2,200, All sectors increased except Semi-Detached which declined by $2,100. Detached homes saw the largest increase at $4,800.
Calgary Real Estate Benchmark Year to Date Sales Price: Same as above.
Current Months of Inventory (Absorption Rate):
Our Months of Inventory declined again by .28 putting us into an even deeper Sellers Market. The only sector that increased was the Semi-Detached sector and it increased by .1.
My Prediction for what is ahead:
2024 will be a year of a Sellers Market and we will see substantial price increases in all Sectors. The root cause of our market imbalance continues to be immigration and I do not see that changing anytime soon.
**Below is a summary of numbers in chart form. All numbers are taken from the Calgary Real Estate Boards monthly Stats package.
*All numbers vary by community and price ranges, if you would like stats specifically for your neighbourhood, please contact us.
Blog Link:
See Stats from the Calgary Real Estate Market Below
Calgary Real Estate Board Stats