What is really happening in the Calgary Real Estate Market?
The market is simply a result of Supply and Demand therefore we look at both Supply (inventory) and Demand (Sales) and the relationship between the two. We also update you on the current benchmark price for all housing sectors.
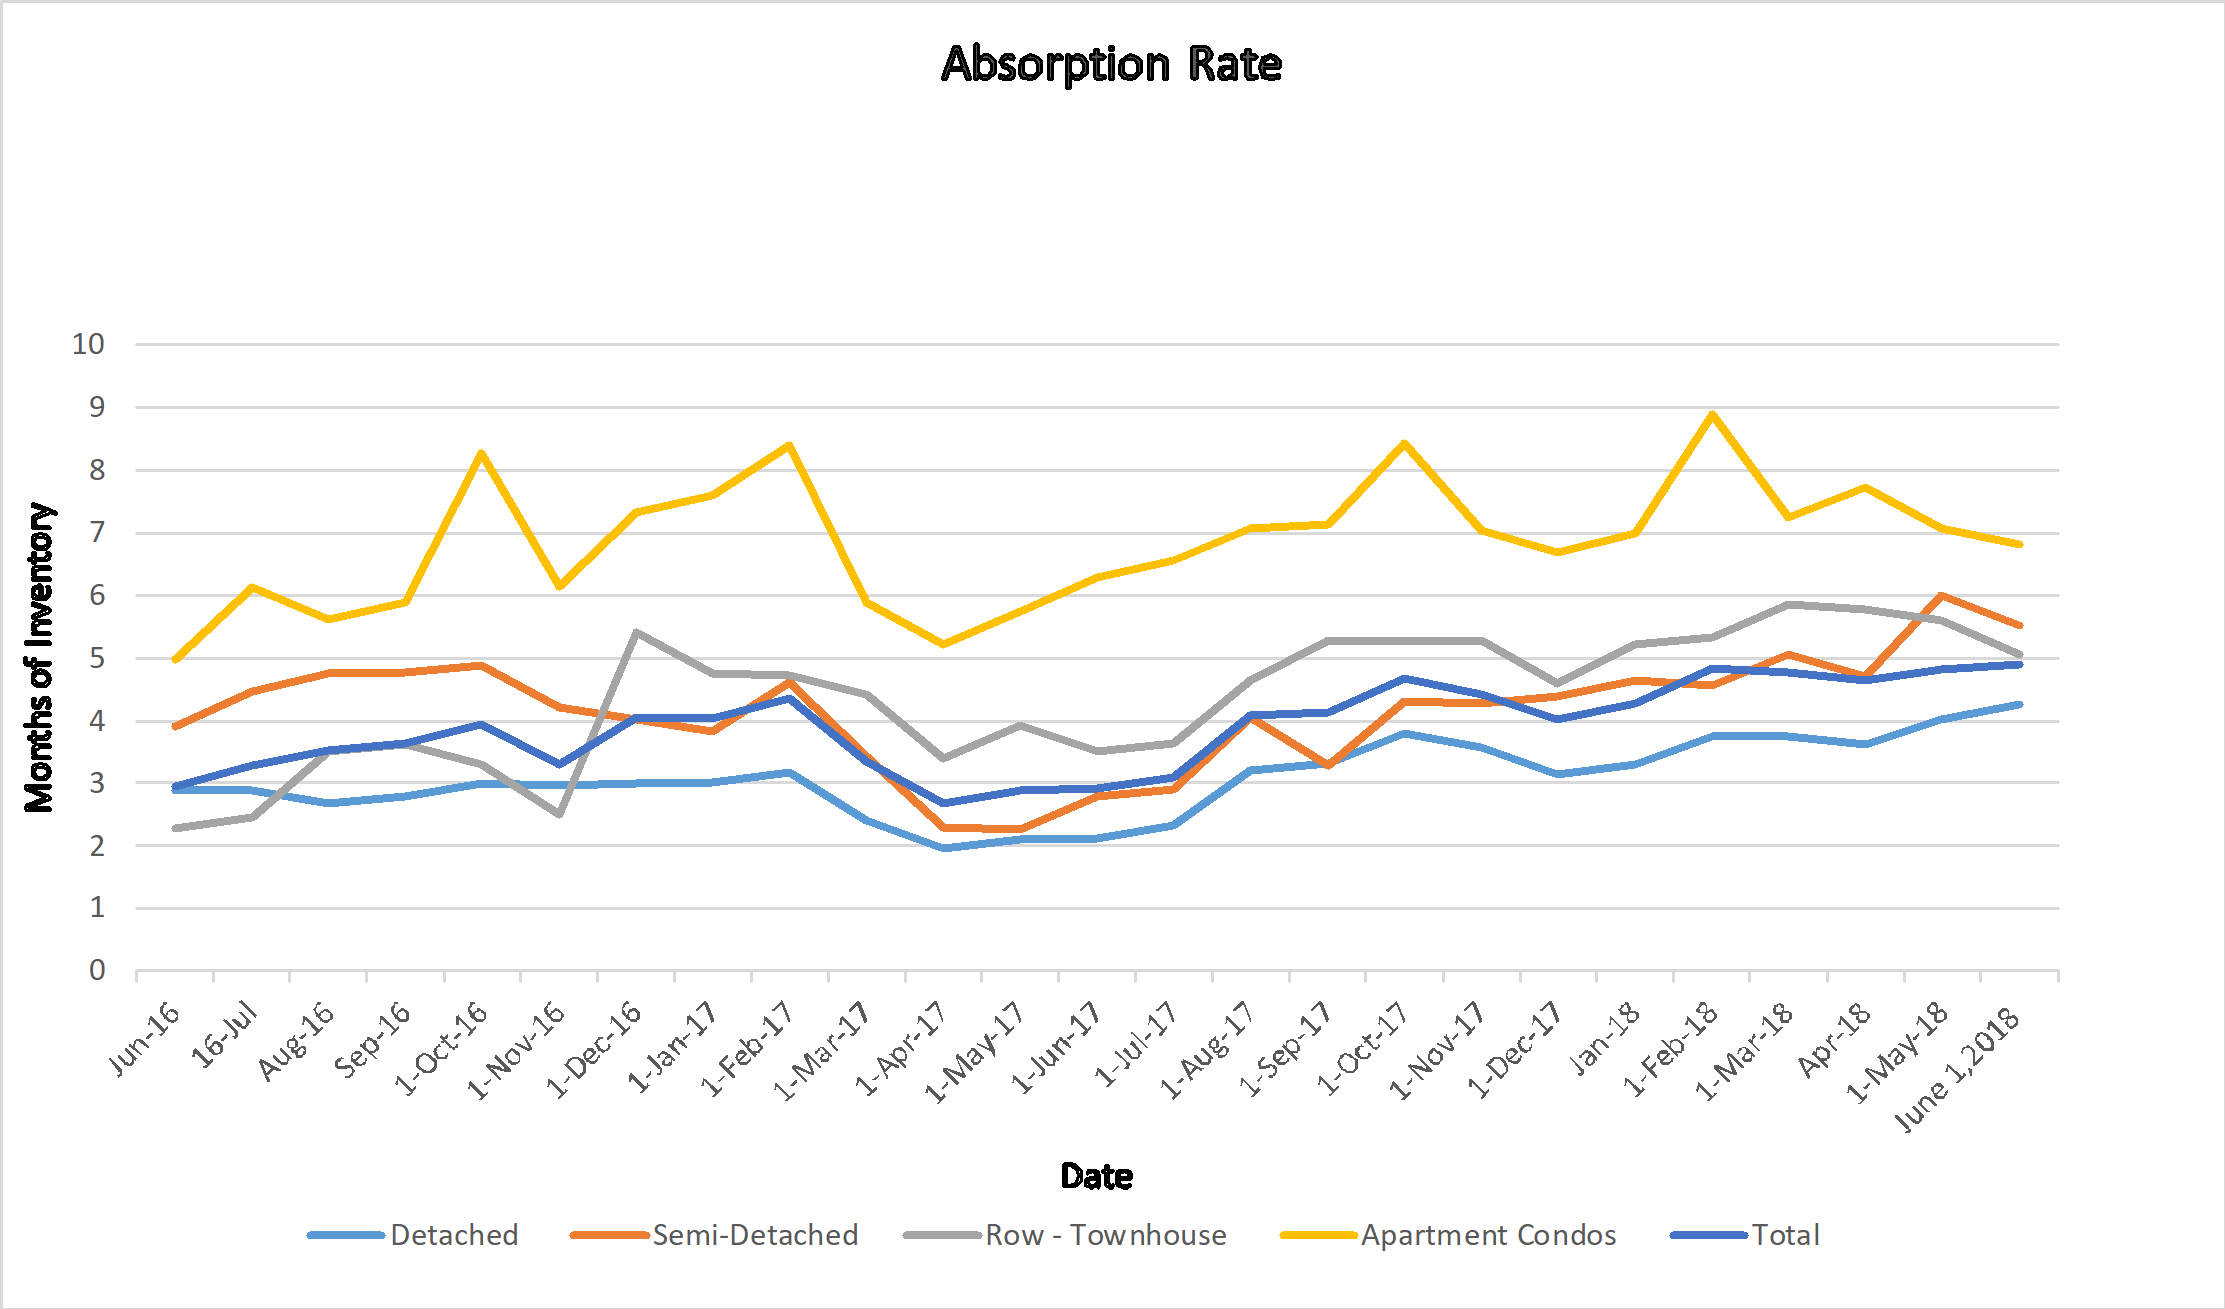
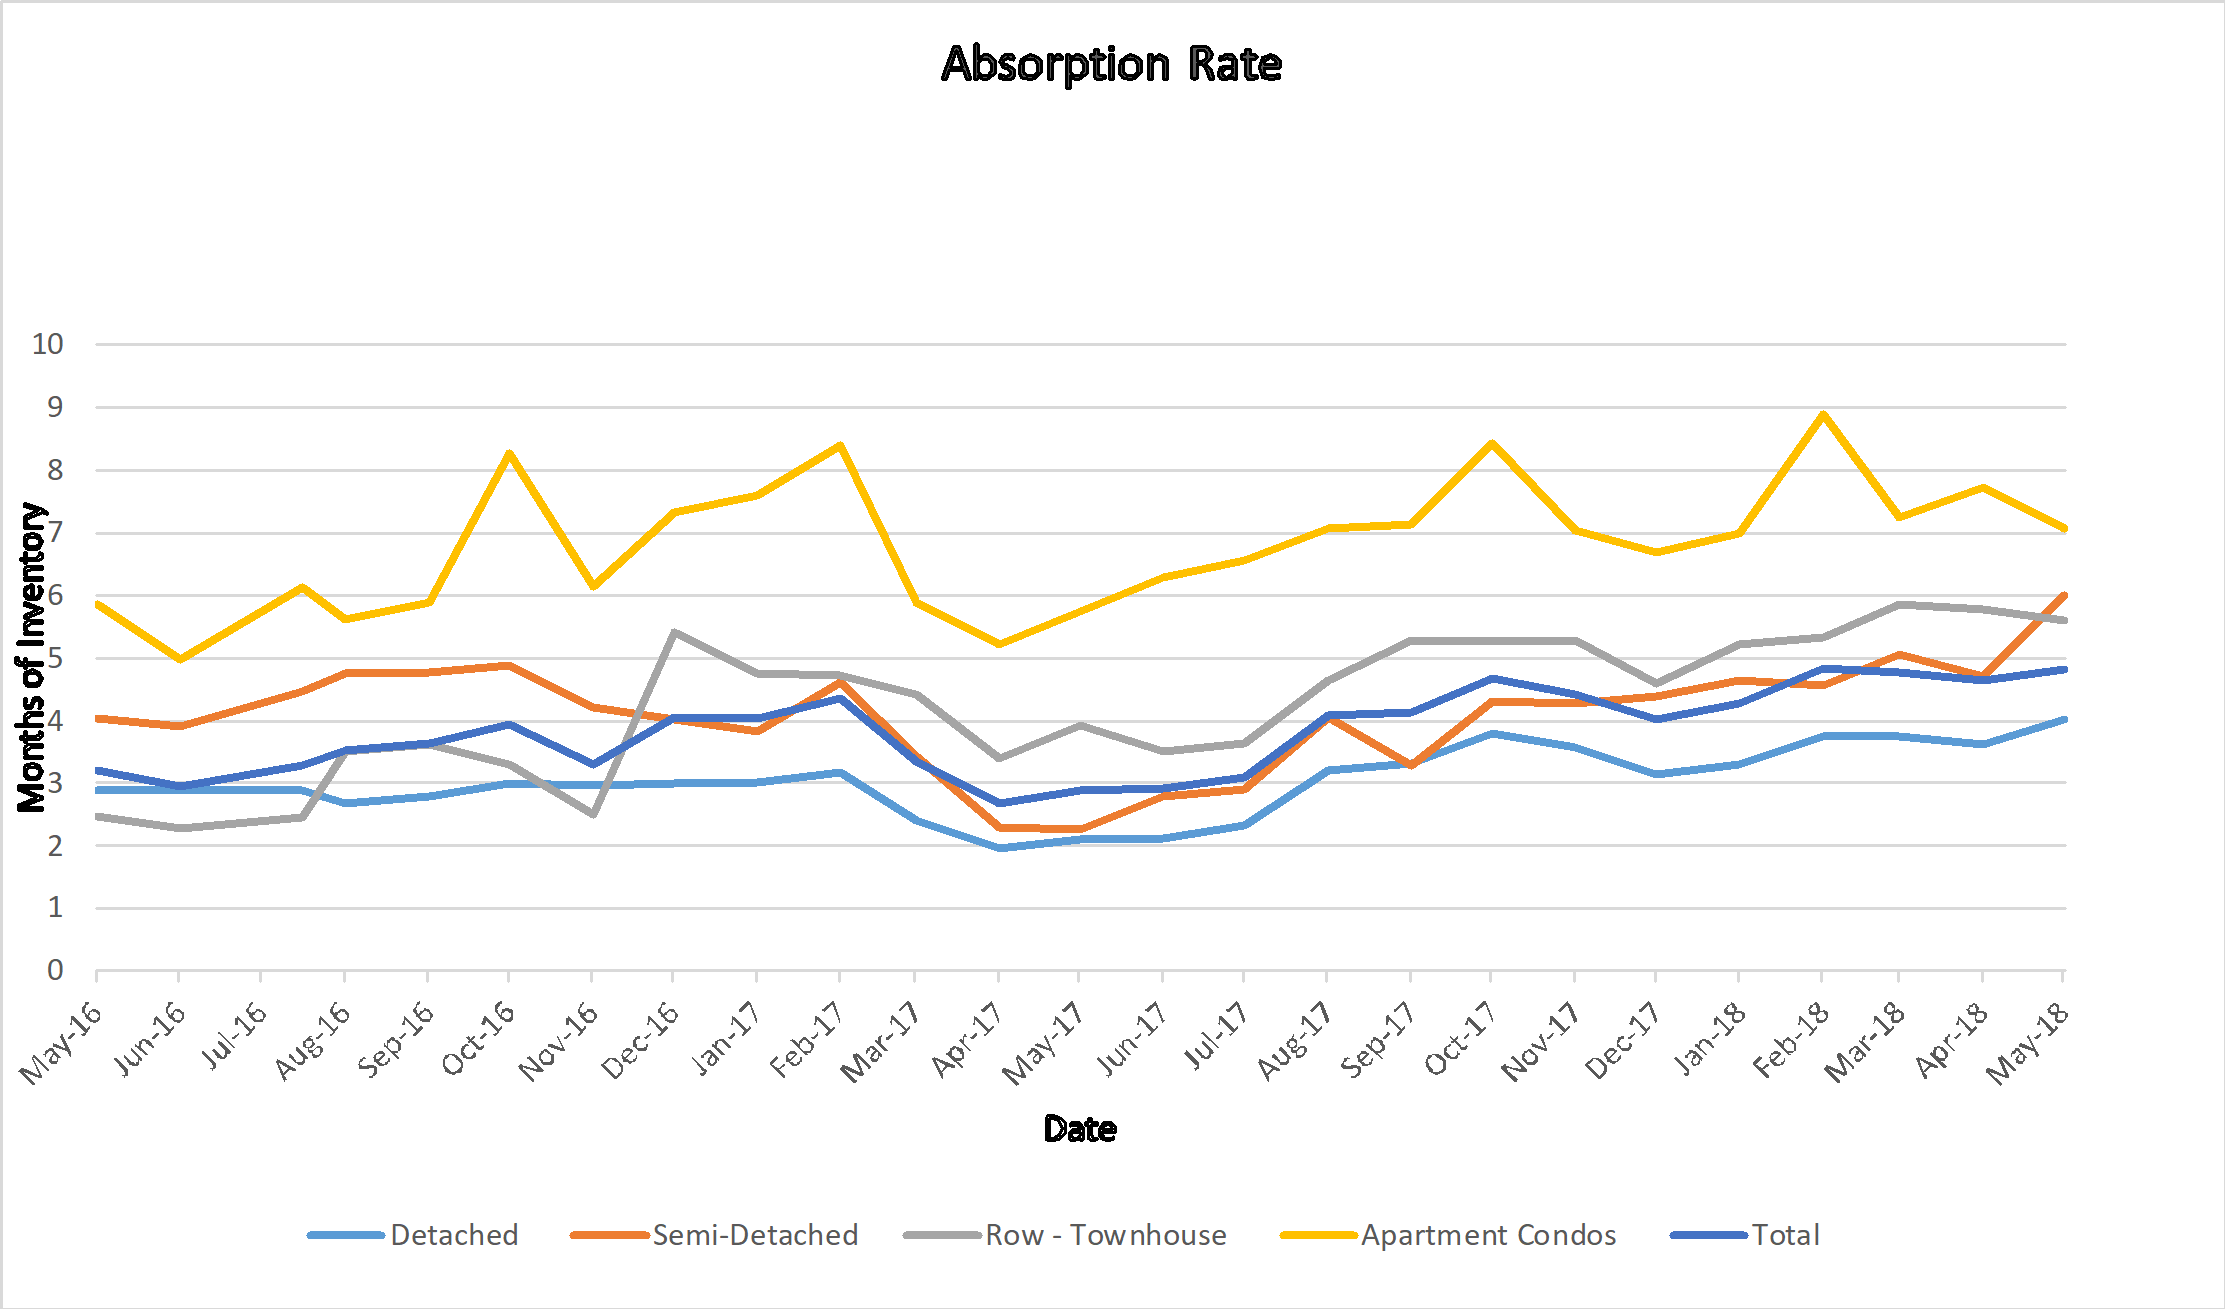
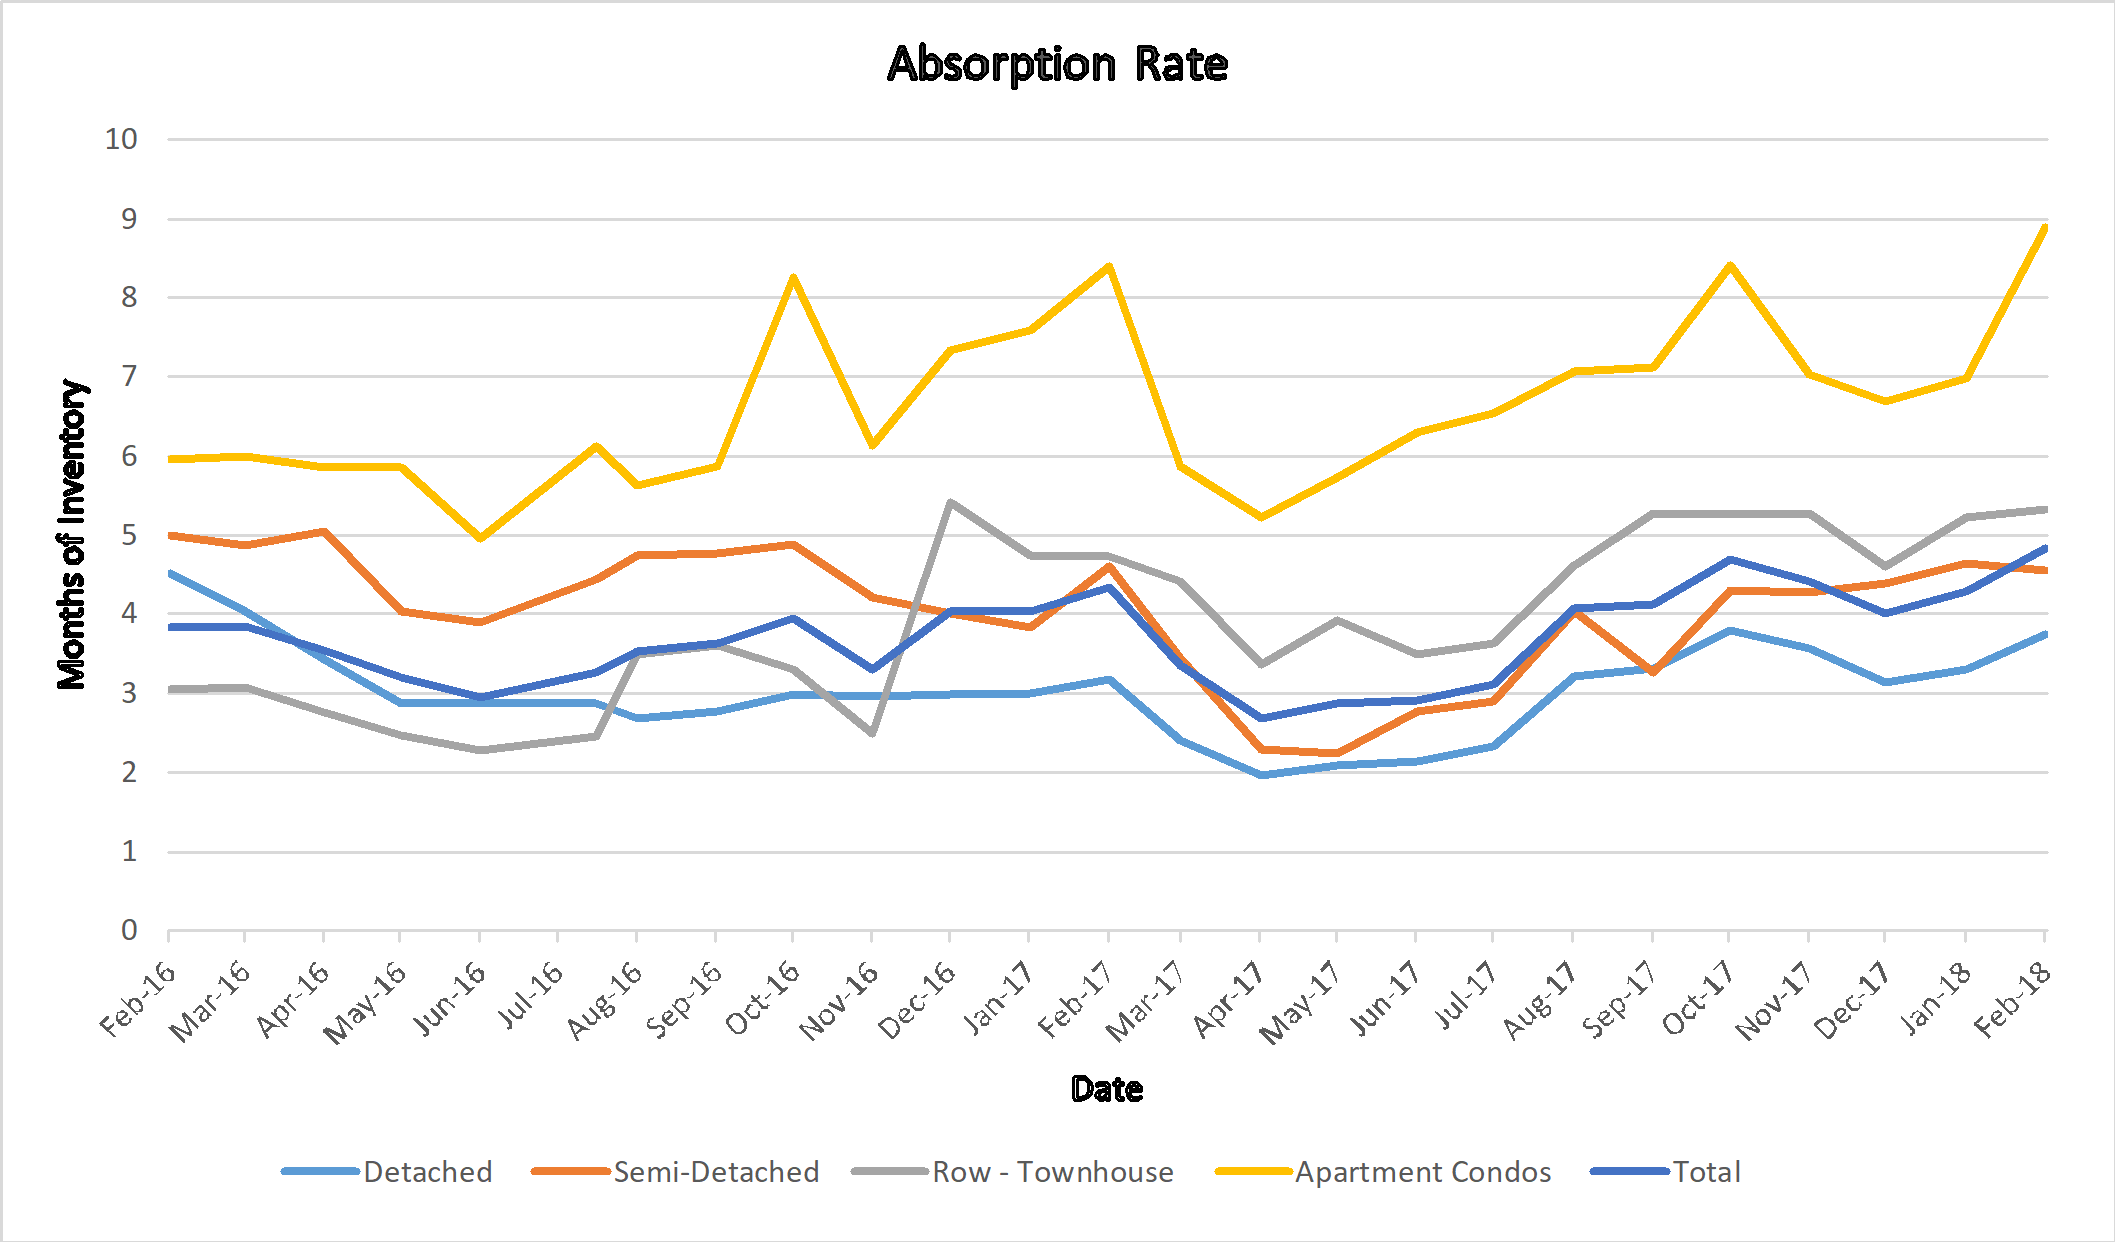
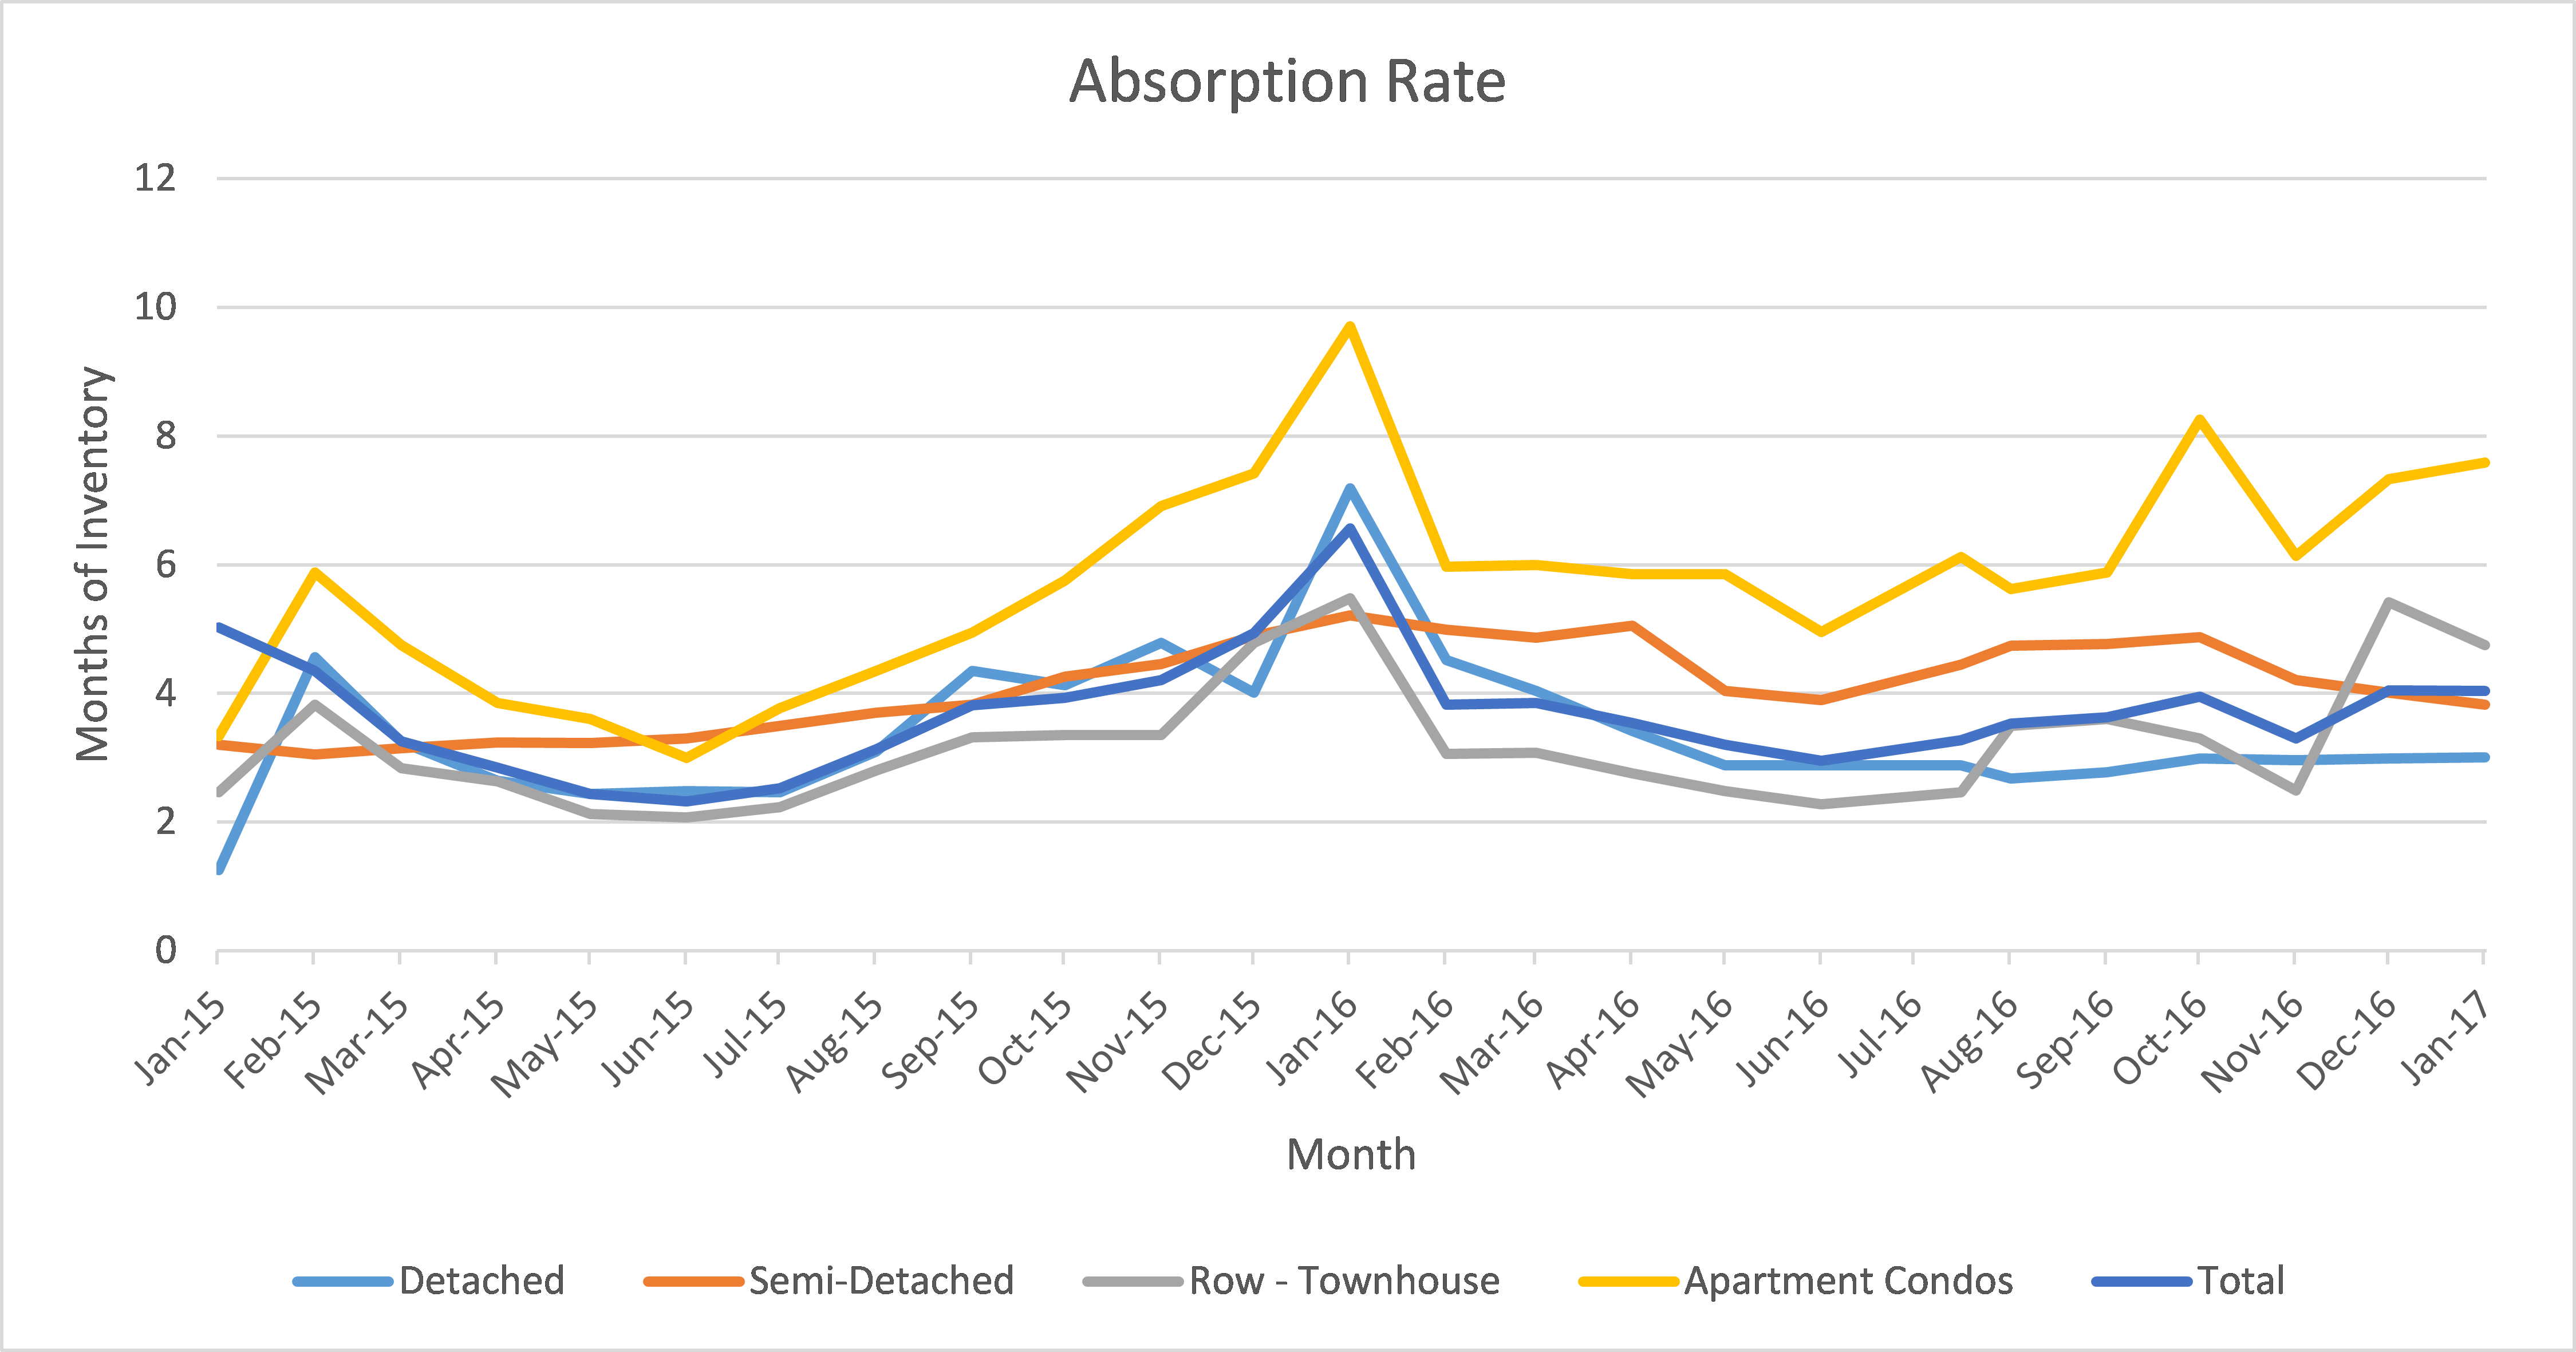
Following is a graph that shows the months of inventory for each Sector. Looking at a 2-year trendline gives you and indication of where things are really heading.

Graph shows the 2 year trend of Months of Inventory for all housing categories in the Calgary Real Estate Market.
Following is a summary of what I deem to be the most important numbers. Again, we look at Total Inventory, Sales for the past 30 days, Months of Inventory and of course the benchmark price. All numbers are taken from the Calgary Real Estate boards monthly stats package.

CREB Stats for March 2020
Gord’s commentary for the month (just my opinion).
First and Most importantly to really understand what is happening it is critical for you to be clear on two things.
- Once a home receives an offer there is a delay of 5 to 10 days for the buyers to remove their conditions such as financing, home inspection etc. What this means is listings that are reported sold today actually got sold between 5 to 10 days ago resulting in what I call a lag time. In a normal market this does not greatly affect stats but when sales are rapidly declining like they have been this in my opinion becomes important.
- The Covid-19 actions for social distancing did not start until part way through the month and they got stronger as the month progressed.
Current Months of Inventory (Absorption Rate):
In March the overall months of inventory increased slightly. Increases were seen in Detached (.23) Semi-Detached (1.22) and Attached Row (.67) sectors while the absorption rate decreased in the Apartment Condo sector (.33).
Calgary Listing Inventory
Listing Inventory increased slightly where with the largest increase being in Detached homes with an increase of 175. Typically, in March we would see a large increase in listings. With Covid-19 we are seeing some Seller’s withdraw their listings as they do not want people coming through their home currently. Other sellers are just not listing yet.
Calgary Sales:
I am a little surprised that in March we sold only 21 homes less than in February. This in my opinion is a result the sales lag and Covid hitting mid month. You will see a much steeper drop in April.
Sales Compared to 2019:
Sales in all sectors for January 2020 were 7.6% higher than in January 2019.
Sales in all sectors for February 2020 were 23% higher than in February 2019.
Sales in all sectors for March 2020 were 88.7% on Sales in March 2019 – 12.3% Lower
Calgary Real Estate Sales Prices:
Prices increased in Detached and Semi-Detached sectors while decreasing in the Attached-Row and Apartment Sectors. The changes were minor except for the Apartment condo sector losing $5,100.
It’s also important to note that these numbers vary by community, and by price range. If you would like numbers for your community contact us.