Posts Tagged ‘Calgary Real Estate Market Prices’

Covid 19 affect on the Calgary Real Estate Market

Wednesday, April 1st, 2020

What is really happening in the Calgary Real Estate Market?

The market is simply a result of Supply and Demand therefore we look at both Supply (inventory) and Demand (Sales) and the relationship between the two.  We also update you on the current benchmark price for all housing sectors.

Following is a graph that shows the months of inventory for each Sector.  Looking at a 2-year trendline gives you and indication of where things are really heading.

Graph shows the 2 year trend of Months of Inventory for all housing categories in the Calgary Real Estate Market.

Following is a summary of what I deem to be the most important numbers.  Again, we look at Total Inventory, Sales for the past 30 days, Months of Inventory and of course the benchmark price.  All numbers are taken from the Calgary Real Estate boards monthly stats package.


CREB Stats for March 2020


Gord’s commentary for the month (just my opinion).


First and Most importantly to really understand what is happening it is critical for you to be clear on two things.

  1. Once a home receives an offer there is a delay of 5 to 10 days for the buyers to remove their conditions such as financing, home inspection etc. What this means is listings that are reported sold today actually got sold between 5 to 10 days ago resulting in what I call a lag time.  In a normal market this does not greatly affect stats but when sales are rapidly declining like they have been this in my opinion becomes important.
  2. The Covid-19 actions for social distancing did not start until part way through the month and they got stronger as the month progressed.


Current Months of Inventory (Absorption Rate): 

In March the overall months of inventory increased slightly. Increases were seen in Detached (.23) Semi-Detached (1.22) and Attached Row (.67) sectors while the absorption rate decreased in the Apartment Condo sector (.33).

Calgary Listing Inventory

Listing Inventory increased slightly where with the largest increase being in Detached homes with an increase of 175. Typically, in March we would see a large increase in listings.  With Covid-19 we are seeing some Seller’s withdraw their listings as they do not want people coming through their home currently. Other sellers are just not listing yet.

Calgary Sales:

I am a little surprised that in March we sold only 21 homes less than in February.  This in my opinion is a result the sales lag and Covid hitting mid month.  You will see a much steeper drop in April.

Sales Compared to 2019:

Sales in all sectors for January 2020 were 7.6% higher than in January 2019.

Sales in all sectors for February 2020 were 23% higher than in February 2019.

Sales in all sectors for March 2020 were 88.7% on Sales in March 2019 – 12.3% Lower


Calgary Real Estate Sales Prices:

Prices increased in Detached and Semi-Detached sectors while decreasing in the Attached-Row and Apartment Sectors. The changes were minor except for the Apartment condo sector losing $5,100.


It’s also important to note that these numbers vary by community, and by price range.  If you would like numbers for your community contact us.


What is really happening in the Calgary Real Estate Market?

Friday, November 1st, 2019

Calgary Real Estate Market Snapshot at a glance!

This graph shows the 2 year trend of months of Inventory for all sectors in the Calgary Real Estate Market.

Notice this month how everything trended downwards making it a stronger market.

Current Report: November 1, 2019

 A slightly new format this month and moving forward due to technology challenges with reading the graphs on a cell phone.  This should help.

Below see all the stats (Info taken from the Calgary Real Estate Boards Monthly Stats Package.


Just a few comments on this month – These are my comments and my opinions. 

 It’s interesting how we are bucking the trend and October saw a stronger market in all Sectors.

 Current Months of Inventory (Absorption Rate): 

The good news is that we reversed what we lost in momentum last month. This month every sector saw a decline in the months of inventory (Absorption Rate) with the lowest decrease being Detached homes at -.39 and the largest with Attached Row homes at -.95.

Once again Detached homes moved into a balanced Market Position.

Calgary Listing Inventory

Calgary listing Inventory decreased in all sectors this month for a total of 396 listings less than one months ago. Typically, this is the trend we will see until the end of the year.

 Calgary Sales:

Sales for October increased over September sales.  Every sector increased a little for an increase of 76 sales over September.  While this in not a big number it is substantial as typically October sees less sales than September.

Sales Compared to 2018: 

October Sales compared to last year were 9.6% higher.

Last month we were 8.2% higher so this is a very good trend and hope it continues.

 Calgary Real Estate Sales Prices:

Prices for Detached homes, Attached Row Homes declined by $3,200 and $2,700 respectively.

Prices for Semi- detached remained flat while Apartment Condos increased by $2,600

Months of Inventory/Absorption Rate: What does this mean you might ask?

The inventory divided by the number of sales in the last month).

 **Please note that these numbers include only Calgary and do change on a community basis, and more so for towns.  This report does not include rural properties and does not consider differences in different price ranges.  If you would like to find stats on your community just let me know.  If you have any questions about this summary or about Real Estate in general, please feel free to contact us.


Calgary Real Estate Market Snapshot Feb 1, 2018

Friday, February 2nd, 2018

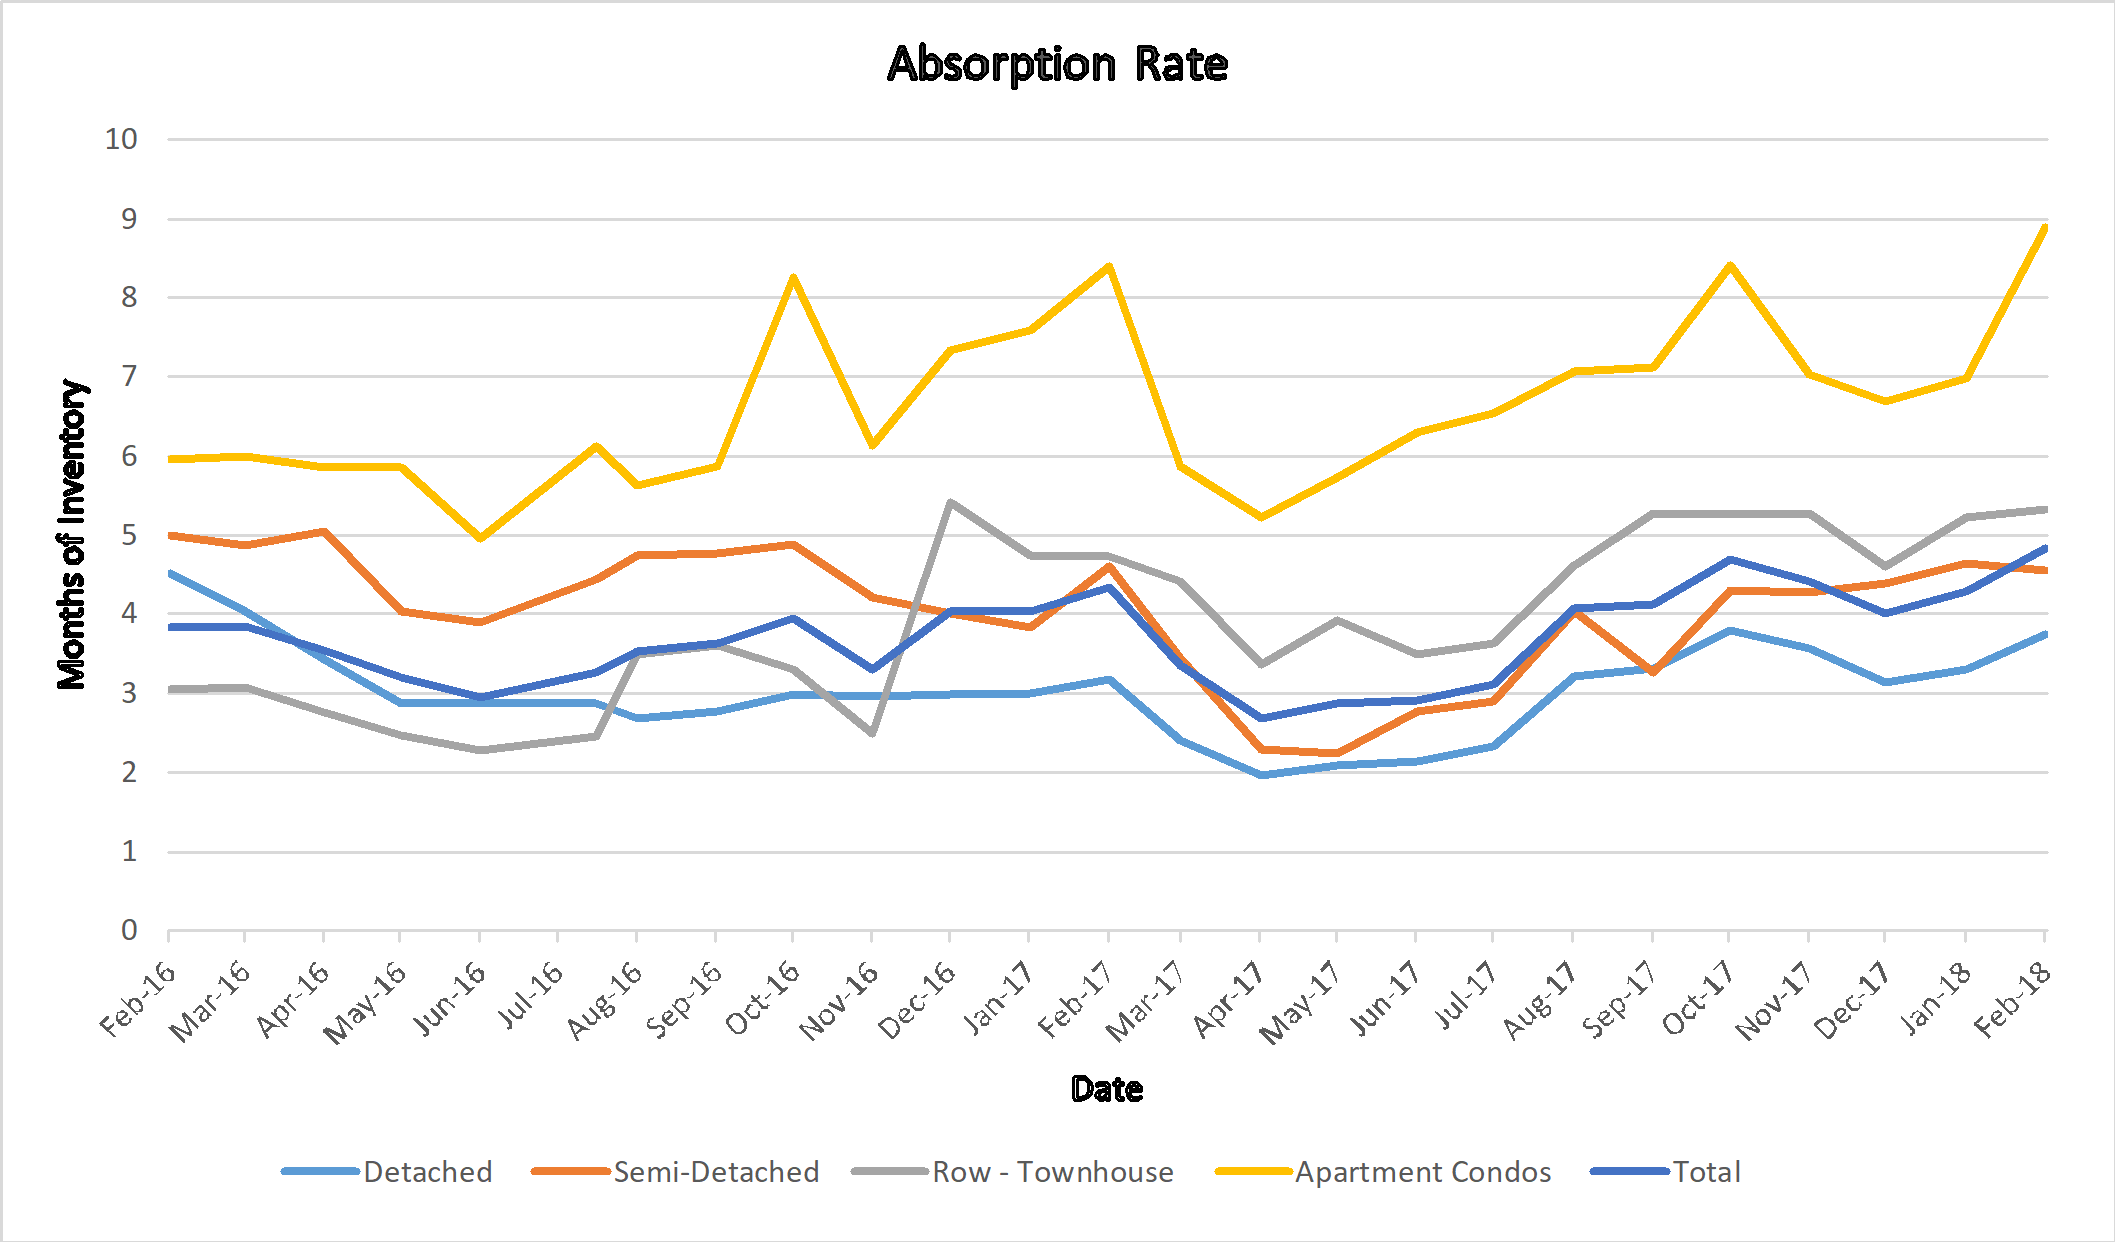
Absorption Rate – Calgary Real Estate

What is really happening in the Calgary Real Estate Market?

Stay ahead of everyone else by following our Monthly Market Snapshot of the Calgary Real Estate Market This shows what’s really happening! The market is driven by supply and demand so here we show the inventory (supply) and sales (demand) and most importantly the relationship between the two and how it affects the price of Calgary Real Estate.  A simple way to keep up to date with how the market is trending and to stay ahead of most! All numbers are taken from the Calgary Real Estate Boards Stats package for Realtors. I have also included some general comments which are simply my opinion.

Absorption Rate (Months of Inventory – the inventory divided by the number of sales in the last month). What does this mean you might ask?

Buyer’s Market >4.0 Drives prices down
Balanced Market Between 2.4 to 4.0 Prices typically remain stable
Seller’s Market <2.4 Drives prices up


Current Absorption Rate

The absorption rate for December increased for Detached and Apartment sectors with a tiny increase in Attached Row homes.  The only decrease is in the Semi-Detached.

At this point I am speculating however I believe that with the mortgage rule changes that went into affect Jan 1st we are going to see some buyers shifting from detached homes to Semi-Detached and from Semi-Detached to Row and from row to apartment condos.


End of Dec 2017  Jan 2018    Change
Detached 3.30 3.75 0.45
Semi Detached 4.64 4.56 -0.09
Attached – Row 5.22 5.33 0.11
Apartment 6.99 8.89 1.90
Total City 4.28 4.83 0.55


Calgary Listing Inventory

In January our inventory increased in all Sectors. This is totally expected as some sellers take their home off the market for December and relist in January.

Inventory Dec 2017  Jan 2018    Change
Detached 2033 2185 152
Semi Detached 441 451 10
Attached – Row 658 698 40
Apartment 1182 1289 107
Total City 4314 4623 309


Calgary Sales:

Sales numbers are down a little from December and again this is a normal seasonal trend.  What is important to note here is that when we compare with last year, January sales were 2% higher than in January 2017.


Calgary Sales  Dec 2017  Jan 2018    Change % Change
Detached 616 583 -33 -5.36%
Semi Detached 95 99 4 4.21%
Attached – Row 126 131 5 3.97%
Apartment 169 145 -24 -14.20%
Total City 1008 958 -50 -4.96%

Calgary Real Estate Sales Prices:

Prices in January decreased in every sector with larger decreases in the Attached Row and apartment condo sectors.  This is consistent with higher absorption rates in those sectors.


  Sales Prices Dec 2017 Benchmark Price   Jan 2018   Benchmark Price Change
Detached 499,600 499,400 -200
Semi Detached 416,600 415,800 -800
Attached – Row 299,500 296,700 -2,800
Apartment 257,700 256,200 -1,500
Total City 433,200 432,300 -900


 Sales Prices “Year to Date”  

Same as monthly number

Sales Prices Jan 1, 2018    Benchmark Price  Jan 2018   Benchmark Price Change

$

% Change
Detached 499,600 499,400 -200 -0.04%
Semi Detached 416,600 415,800 -800 -0.19%
Attached – Row 299,500 296,700 -2,800 -0.93%
Apartment 257,700 256,200 -1,500 -0.58%
Total City 433,200 432,300 -900 -0.21%


**Please note that these numbers include only Calgary homes and do change on a community basis and more so for towns.  This report does not include rural properties.  If you would like to find stats on your community just let me know.  If you have any questions about this summary or about Real Estate in general, please feel free to contact us.


Annual Forecast from the Real Estate Board Economist.

In a nutshell her forecast for 2018 is that the market will stay essentially the same as it was in 2017, with similar inventory levels and sales levels.  The Calgary Real Estate Board produced a full report showing not only what they predict but the reasons why.  I found it a very interesting read.  If you would like a full copy of the report just let us know and I can email to you.


Calgary Real Estate Market Snapshot Jan 1, 2018

Tuesday, January 2nd, 2018

What is really happening in the Calgary Real Estate Market?

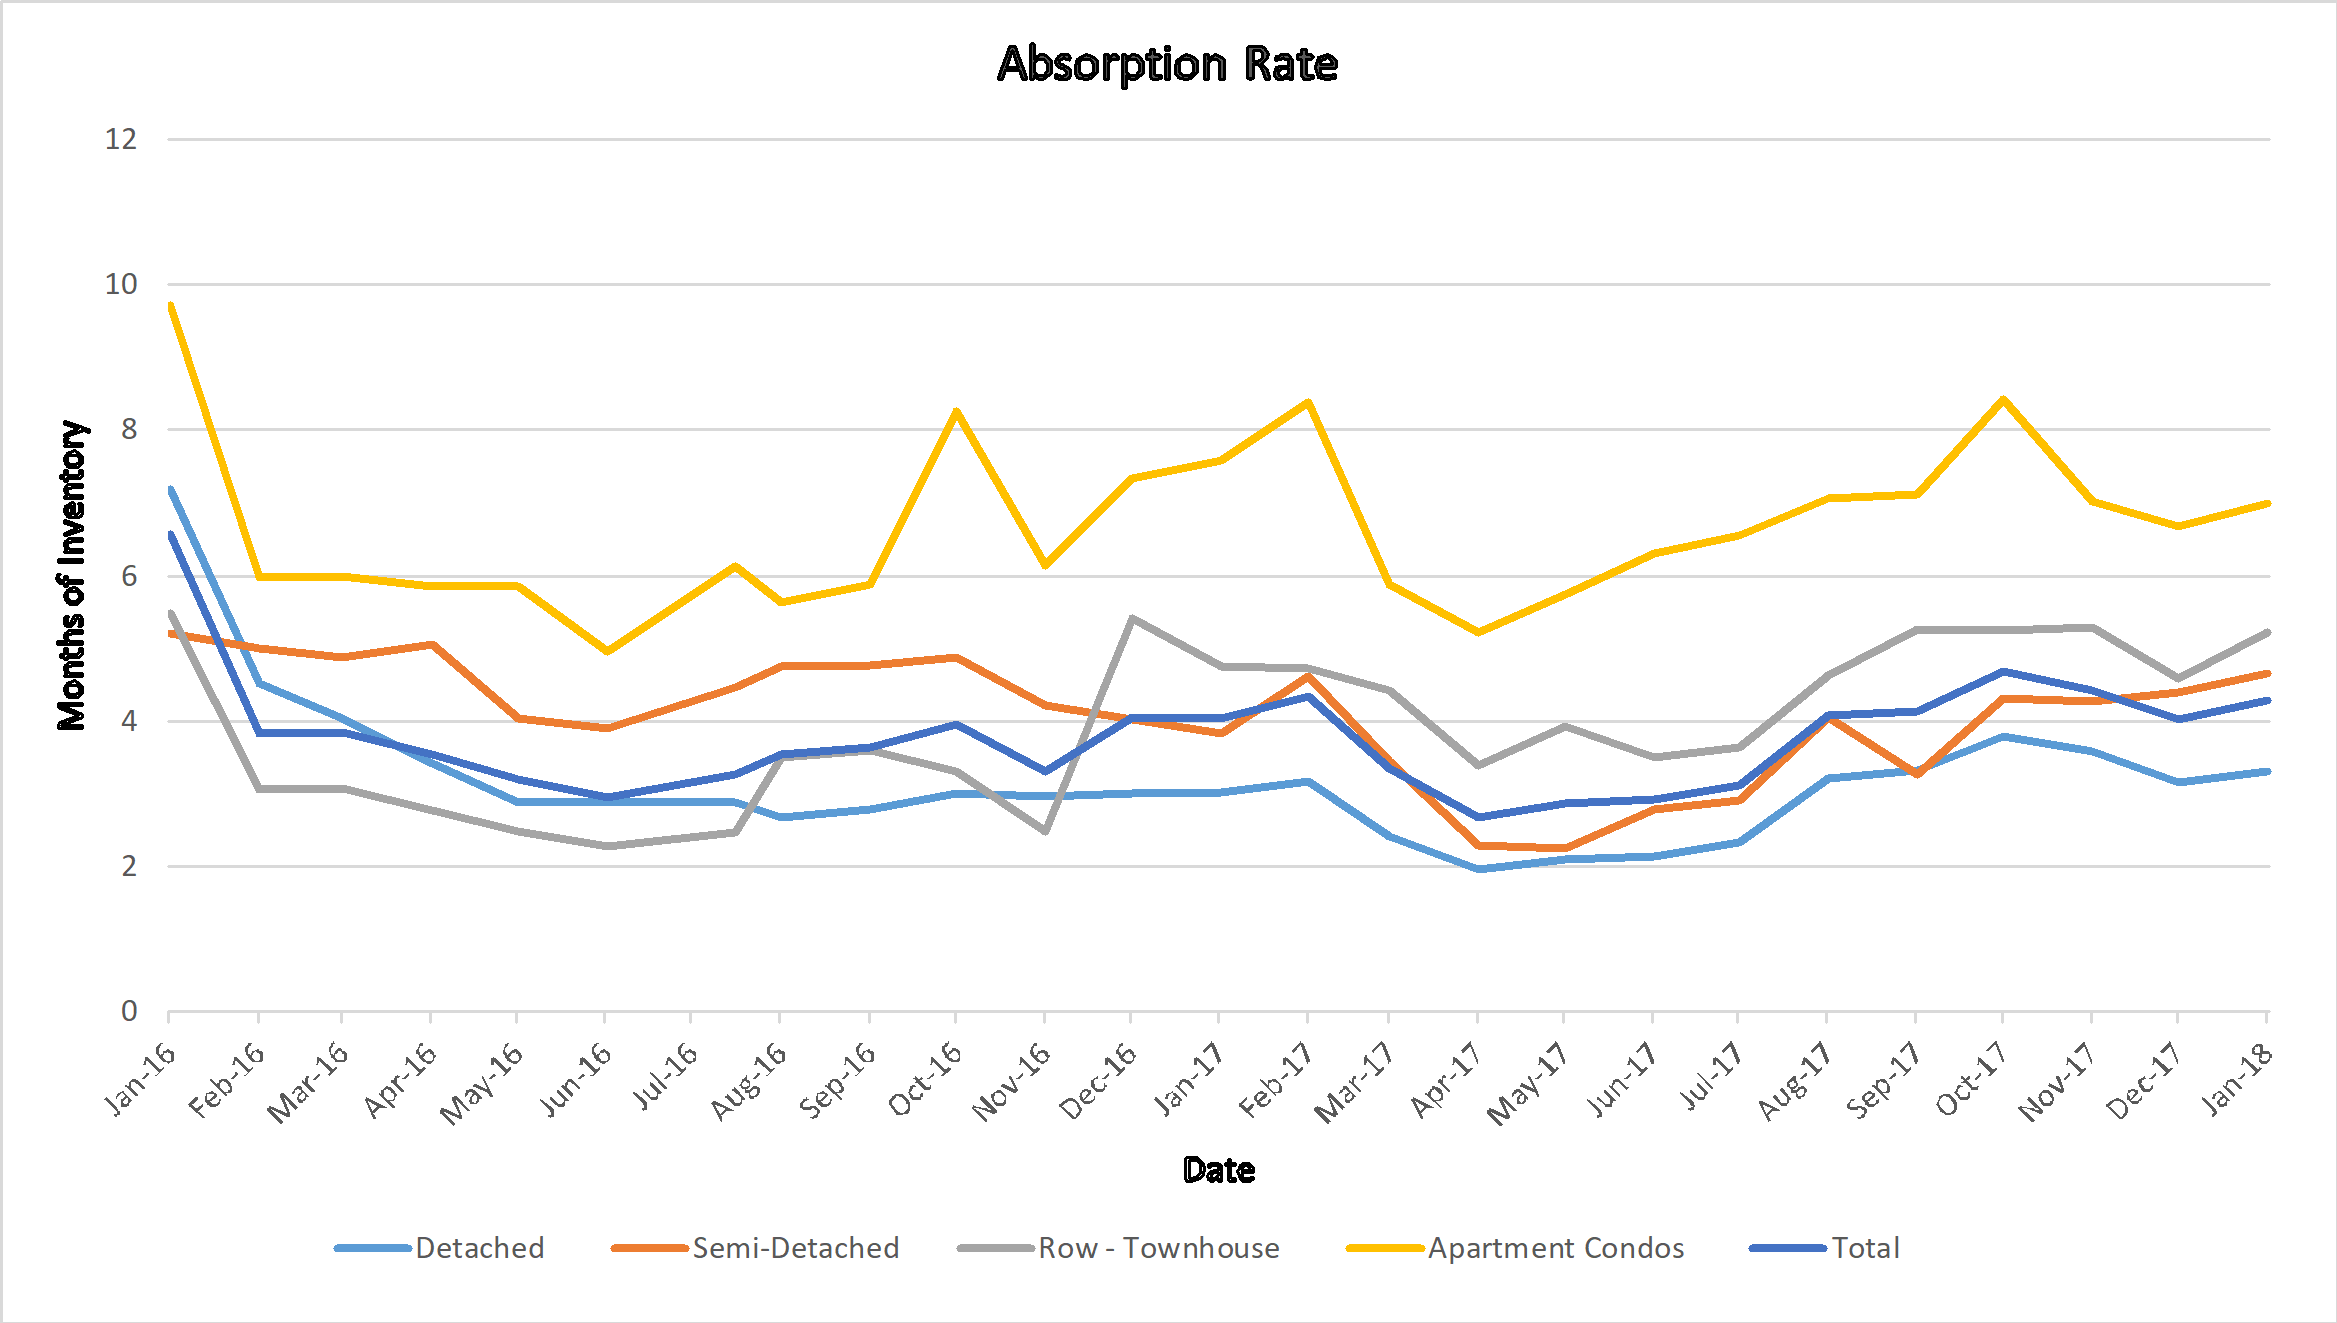
Absorption Rate

Stay ahead of everyone else by following our Monthly Market Snapshot of the Calgary Real Estate Market This shows what’s really happening! The market is driven by supply and demand so here we show the inventory (supply) and sales (demand) and most importantly the relationship between the two and how it affects the price of Calgary Real Estate.  A simple way to keep up to date with how the market is trending and to stay ahead of most! All numbers are taken from the Calgary Real Estate Boards Stats package for Realtors. I have also included some general comments which are simply my opinion.

Absorption Rate (Months of Inventory)   (the inventory divided by the number of sales in the last month). What does this mean you might ask?

Buyer’s Market >4.0 Drives prices down
Balanced Market Between 2.4 to 4.0 Prices typically remain stable
Seller’s Market <2.4 Drives prices up


Current Absorption Rate

The Absorption rate for November increased in all categories for December.  The number of listings dropped but the number of sales dropped even more.  My concern is that a lot of inventory came off for the holiday season and we may see a ton of listings hit the market in January.  

Nov  2017  Dec  2017  Change
Detached 3.15 3.30 0.15
Semi Detached 4.40 4.64 0.24
Attached – Row 4.60 5.22 0.62
Apartment 6.69 6.99 0.31
Total City 4.01 4.28 0.26


Calgary Listing Inventory

In December all categories saw a decrease in the number of listings.  This is normal for this time of year where people will let their listing expire and then put it back on in the new year.

Inventory Nov  2017  Dec  2017  Change
Detached 2758 2033 -725
Semi Detached 555 441 -114
Attached – Row 861 658 -203
Apartment 1491 1182 -309
Total City 5665 4314 -1351


Calgary Sales:

Sales for December decreased in all categories.   Of interest our sales in all categories exceeded the sales for Dec 2016.

Total sales Dec 2016:  929

Total sales Dec 2017: 1006

Increase of 8.3%


Calgary Sales  Nov  2017  Dec  2017  Change % Change
Detached 875 616 -259 -29.60%
Semi Detached 126 95 -31 -24.60%
Attached – Row 187 126 -61 -32.62%
Apartment 223 169 -54 -24.22%
Total City 1411 1008 -403 -28.56%


Calgary Real Estate Sales Prices:

Prices in December dropped a little in all categories.   The highest decreases were in detached and attached-row houses.

  Sales Prices Nov  2017  Benchmark Price   Dec  2017  Benchmark Price Change
Detached 504,000 499,600 -4,400
Semi Detached 417,800 416,600 -1,200
Attached – Row 303,100 299,500 -3,600
Apartment 258,300 257,700 -600
Total City 436,700 433,200 -3,500


Sales Prices “Year to Date”  

Well, here is the summary for the year 2017.   Small gains in Detached and Semi-Detached homes and a small reduction in Attached Row with a larger decrease in Apartment Condos.  If you have been watching my report for the year the absorption rate for apartment condos has been very high all year.

Sales Prices Jan 1, 2017    Benchmark Price  Dec  2017  Benchmark Price Change

$

% Change
Detached 498,900 499,600 700 0.14%
Semi Detached 406,200 416,600 10,400 2.56%
Attached – Row 303,100 299,500 -3,600 -1.19%
Apartment 266,500 257,700 -8,800 -3.30%
Total City 434,100 433,200 -900 -0.21%

  **Please note that these numbers include only Calgary homes and do change on a community basis and more so for towns.  This report does not include rural properties.  If you would like to find stats on your community just let me know.  If you have any questions about this summary or Real Estate questions please feel free to contact us.

My Prediction for 2018

The big news is that as of yesterday the mortgage rules changed and people will be able to qualify for less mortgage due to the new “Stress Test”

When the government made the same change for 5% Down mortgages we saw little impact in the market so I am predicting little impact on the market due to this.  If anything we will see less sales activity in Detached homes and some buyers will move into attached homes or Townhomes.  Some who could previously qualify for a townhouse may now move into the Apartment Condo sector.  For Calgary if this prediction comes true it could be good as it may balance out the market categories.  Overall I believe that the Calgary Market will continue to pick up momentum through 2018.

Happy New Year, we hope you have an awesome 2018.