Posts Tagged ‘Calgary Real Estate Market’

Consequences of Mortgage Rules Change

Thursday, November 3rd, 2016
As you are most likely aware by now, the mortgage rules changed on October 17th – if not here you can find a summary of changes.  I am going to give you my opinion of what this means to the Calgary Real estate Market. 
First some facts:  Sales for the month of October were 
Week 1 – 352
Week 2 – 375
Week 3 – 463 (rule change week)
Week 4 – 386
Looking at our sales by week makes it very clear that we saw a large spike in sales that was driven by buyers jumping in before the changes took effect. This to me means that the new rules are going to have a large effect of Calgary Real Estate sales volumes. 
 
I forecast that: 
  1. We will now see a substantial decrease in sales as buyers can no longer buy what they thought they would be able to afford. This will increase the number of homes for sale in Calgary putting us into more of a buyers market than we were. Ultimately this will put further downward pressure on pricing. 
  2. Buyers will back off buying as they believe that less people can buy so prices will come down.
  3. Over the next 3 months we will see a shift in what people are buying due to affordability.  IE: Those that were looking at starter homes will now be buying Townhouses and those looking at townhouses will now look at apartment condos. 
  4. I predict that it will take 3 to 4 months before we start to find out what the new normal really is. 
Unintended Consequences: 
  1. Buyers may be driven to borrrow private money (at a higher cost) just to secure the home they want putting them more at risk than before the rule change.
  2. Mortgage interest rates are going to increase.  Already the TD Canada Trust increased their rates as the cost & risk of lending money for mortgages has increased.

For a great article explaining above click here

August 1, 2016 Calgary Real Estate Market Snapshot

Tuesday, August 2nd, 2016

Stay ahead of everyone else by following our Monthly Market Snapshot of the Calgary Real Estate Market This shows what’s really happening! The market is driven by supply and demand so here we show the inventory (supply) and sales (demand) and most importantly the relationship between the two and how it affects the price of Calgary Real Estate.  A simple way to keep up to date with how the market is trending and ahead of most! All numbers are taken from the Calgary Real Estate Boards Stats package for Realtors. I have also included some general comments which are simply my opinion.

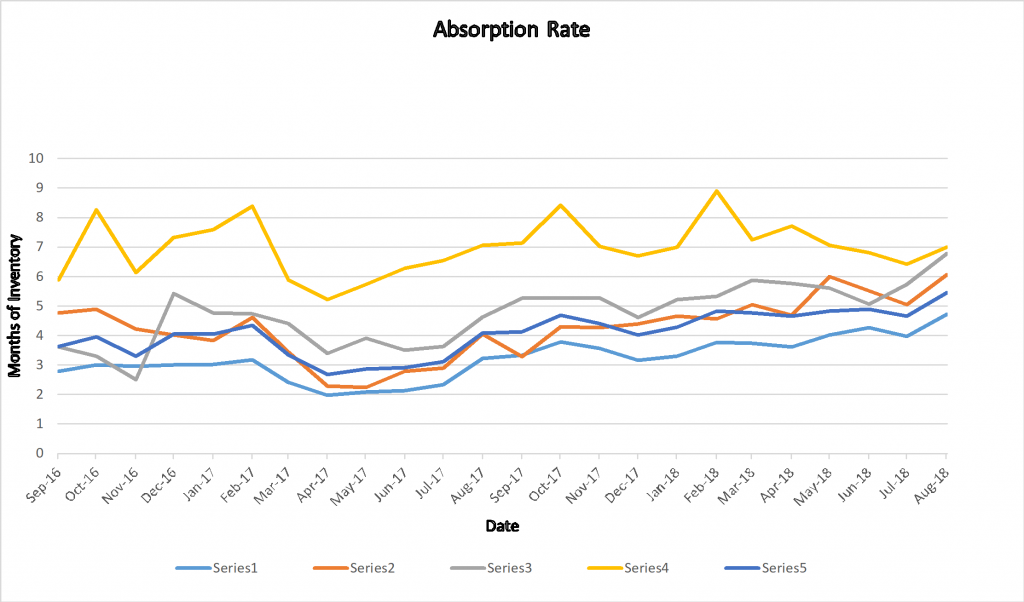
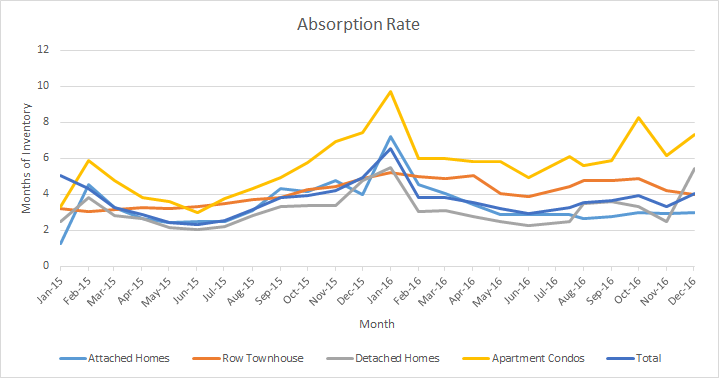
Absorption Rate (Months of Inventory)   (the inventory divided by the number of sales in the last month). What does this mean you might ask?

Buyer’s Market >4.0 Drives prices down
Balanced Market Between 2.4 to 4.0 Prices typically remain stable
Seller’s Market <2.4 Drives prices up


*** Absorption Rate***  

In my opinion this is the most critical number to look at.   All categories increased slightly this month except Apartment condos which increased by 1.16.   This is a reverse trend from last month where all categories decreased.   As you can see the apartment condo market is still favouring Buyers the most.

  June 2016 July 2016 Change
Detached 2.28 2.46 0.18
Semi Detached 2.88 2.88 0.01
Attached – Row 3.90 4.45 0.55
Apartment 4.96 6.12 1.16
Total City 2.95 3.27 0.32


Calgary Listing Inventory

July saw a decrease in inventory in all categories except Apartment Condos which increased very slightly.   This decrease is due to less new listings coming to market.


Inventory June 2016 July 2016 Change
Detached 2923 2727 -196
Semi Detached 532 522 -10
Attached – Row 975 882 -93
Apartment 1543 1554 11
Total City 5973 5685 -288


Calgary Sales:

Sales in all categories decreased this month which in my opinion is very normal for this time of year with summer holidays many peoples focus.

Calgary Sales   June 2016 July 2016 Change % Change
Detached 1282 1108 -174 -13.57%
Semi Detached 185 181 -4 -2.16%
Attached – Row 250 198 -52 -20.80%
Apartment 311 254 -57 -18.33%
Total City 2028 1741 -287 -14.15%


Calgary Real Estate Sales Prices: 

Pricing changes in July were minimal with all categories decreasing slightly.  Again apartment condos decreased a little more and this make sense to me with the higher absorption rate.  I would expect further price declines in the Apartment condo sector.

  Sales Prices June  2016

Benchmark Price 

  July 2016

Benchmark Price

Change
Detached 502,400 502,300 -100
Semi Detached 385,600 385,200 -400
Attached – Row 310,800 310,300 -500
Apartment 278,200 277,000 -1,200
Total City 440,400 440,000 -400


 Sales Prices “Year to Date”   

Year to date prices

Sales Prices Dec 31, 2015   Benchmark Price  July  2016

Benchmark Price

Change

$

% Change
Detached 514100 502,300 -11,800 -2.30%
Semi Detached 393100 385,200 -7,900 -2.01%
Attached – Row 318500 310,300 -8,200 -2.57%
Apartment 288,000 277,000 -11,000 -3.82%
Total City 452800 440,000 -12,800 -2.83%


Price Sensitivity

It is also important to note that homes in the lower price ranges are still moving much quicker than homes in the higher price ranges.

**Please note that these numbers do change on a community basis and more so for towns.  This report does not include rural properties.  If you would like to find stats on your community just let me know.  If you have any questions about this summary or Real Estate questions please feel free to contact us.


May 1, 2016 Calgary Real Estate Market Snapshot

Tuesday, May 3rd, 2016

Newsflash – Detached homes enter into a sellers market.

Stay ahead of everyone else by following our Monthly Market Snapshot of the Calgary Real Estate Market. This shows what’s really happening! The market is driven by supply and demand so here we show the inventory (supply) and sales (demand) and most importantly the relationship between the two and how it affects the price of Calgary Real Estate.  A simple way to keep up to date and ahead of most! All numbers are taken from the Calgary Real Estate Boards Stats package for Realtors.

Absorption Rate (Months of Inventory)   (the inventory divided by the number of sales in the last month). What does this mean you might ask?

Buyer’s Market

>4.0 Drives prices down
Balanced Market Between 2.8 to 4.0 Prices typically remain stable
Seller’s Market <2.8 Drives prices up

Before we get into this month’s report (for followers) it is important to note that the Calgary Real Estate Board made changes to categories again and this time for the better.  In past they used Attached Homes and now they have broken this into two categories –Semi Detached & Row (Townhouses). This makes more sense to me as they are quite different markets.

*** Absorption Rate***  

In my opinion this is the most critical number to look at.  Detached homes are now back in a seller’s market. Three months in a row the absorption rates have been on a steady decrease.  If you are someone sitting on the fence to see if prices will go down more my suggestion is to get off the fence especially if you are looking for a detached home.

  Mar  2016 April  2016 Change
Detached 3.08 2.76 -0.32
Semi Detached 4.04 3.42 -0.62
Attached – Row 4.87 5.05 0.18
Apartment 6.00 5.85 -0.15
Total City 3.85 3.54 -0.31

 Calgary Listing Inventory

April saw an increase in inventory in all categories and this is very typical for April.

Inventory Mar  2016 April  2016 Change
Detached 3094 3127 33
Semi Detached 582 595 13
Attached – Row 896 930 34
Apartment 1535 1590 55
Total City 6107 6242 135

Calgary Sales:

Sales in all categories increased again this month.  This is very typical for a spring market.  It is important to note that Sales are still down from normal levels but are increasing.

Calgary Sales   Mar  2016 April  2016 Change % Change
Detached 1004 1134 130 12.95%
Semi Detached 144 174 30 20.83%
Attached – Row 184 184 0 0.00%
Apartment 256 272 16 6.25%
Total City 1588 1764 176 11.08%


Calgary Real Estate Sales Prices: 

Interesting that all categories decreased in prices.  In my opinion, I believe it is simply because buyers and sellers are not aware of how the market has shifted direction and everyone is still acting like it’s a buyer’s market.  Buyers are bringing low offers, and sellers are happy just to get an offer and are willing to settle a little lower.

  Sales Prices March   2016

Benchmark Price 

April  2016

Benchmark Price

Change
Detached 502400 501500 -900
Semi Detached 385600 383600 -2000
Attached – Row 318500 314800 -3700
Apartment 281300 280400 -900
Total City 442800 441000 -1800


 Sales Prices “Year to Date”   

Year to date prices

Sales Prices Dec 31, 2015   Benchmark Price  April  2016

Benchmark Price

Change

$

% Change
Detached 514100 501500 -12600 -2.45%
Semi Detached 393100 383600 -9500 -2.42%
Attached – Row 318500 314800 -3700 -1.16%
Apartment 288000 280,400 -7,600 -2.64%
Total City 452800 441000 -11800 -2.61%


Price Sensitivity

It is also important to note that homes in the lower price ranges are still moving much quicker than homes in the higher price ranges.

**Please note that these numbers do change on a community basis and more so for towns.  This report does not include rural properties.  If you would like to find stats on your community just let me know.  If you have any questions about this summary or Real Estate questions please feel free to contact us.

February Calgary Real Estate Market Snapshot

Tuesday, March 1st, 2016

Find out what is really happening in the Real Estate Market. Stay ahead of everyone else by following our Monthly Market Snapshot of the Calgary Real Estate Market. This shows what’s really happening! The market is driven by supply and demand so here we show the inventory (supply) and sales (demand) and most importantly the relationship between the two and how it affects the price of Calgary Real Estate.  A simple way to keep up to date and ahead of most!

Below are the details along with a few comments, all numbers were taken from the Calgary Real Estate Boards Stats package for Realtors.

Calgary Listing Inventory

In February our total inventory of listings in Calgary increased in all 3 categories.  This is very typical for this time of year as many sellers wait until after the holiday season to list their homes.  This seasonal trend should continue for the next few months.

Inventory Jan 2016 Feb 2016 Change
Detached 2546 2943 397
Attached 1223 1336 113
Apartment 1253 1402 149
Total City of Calgary 5022 5681 659


Calgary Sales:

Sales in all categories Increased in February.   This again is seasonal and it’s important to note that this Feb we are 6.63% under sales for Feb 2015.

Sales Jan 2016 Feb 2016 Change % of Change
Detached 465 691 226 48.60%
Attached 170 268 98 57.65%
Apartment 129 168 39 30.23%
Total City of Calgary 764 1127 363 47.51%


Calgary Real Estate Sales Prices:  

Prices for all detached and attached homes showed decreases in February.  Apartment Condos showed a slight increase in price.  This may be because apartment condos have been showing price decreases for several months.


  Sales Prices Jan   2015

Benchmark Price 

Feb  2016

Benchmark Price

Change
Detached 509300 504400 -4900
Attached 345600 338900 -6700
Apartment 281900 283600 1700
Total City of Calgary 447300 445000 -2300


Sales Prices “Year to Date”   

Year to date prices

Sales Prices Dec 31, 2015   Benchmark Price  Feb  2016

Benchmark Price

Change

$

% Change
Detached 508700 504400 -4300 -0.85%
Attached 351400 338900 -12500 -3.56%
Apartment 285500 283,600 -1,900 -0.67%
Total City of Calgary 448800 445000 -3800 -0.85%


Absorption Rate (Months of Inventory)   (the inventory divided by the number of sales in the last month). What does this mean you might ask?

Buyer’s Market >4.0 Drives prices down
Balanced Market Between 2.8 to 4.0 Prices typically remain stable
Seller’s Market <2.8 Drives prices up


*** Absorption Rate***   

In my opinion this is the most critical number to look at.  Of interest the trend reversed this month.  The last several months our Absorption rate has been increasing and this is the first time in several months that it decreased.  Does this mean the market has changed – I would not be so quick and would suggest that one month does not make a trend so let’s watch.

Absorption Rate   Jan   2015 Feb  2016 Change
Detached 5.48 4.26 -1.22
Attached 7.19 4.99 -2.21
Apartment 9.71 8.35 -1.37
Total City of Calgary 6.57 5.04 -1.53


Price Sensitivity

It is also important to note that homes in the lower price ranges are still moving much quicker than homes in the higher price ranges.

**Please note that these numbers do change on a community basis and more so for towns.  This report does not include rural properties.  If you would like to find stats on your community just let me know.  If you have any questions about this summary or Real Estate questions please feel free to contact us.

If you know anyone else who might enjoy seeing our monthly summary please share.

TSW Real Estate Group

Nov 2014, Calgary Real Estate Market Snapshot

Tuesday, December 2nd, 2014

Stay ahead of the curve by following our Monthly Market Snapshot of the Calgary Real Estate Market.  This shows what’s really happening in the Calgary Real Estate Market.  The market is driven by supply and demand so here we show the inventory (supply) and sales (demand) and the effect on the price of Calgary Real Estate.   A simple way to keep up to date and ahead of most!

Below are the details along with a few comments, all numbers were taken  from the Calgary Real Estate Boards Stats package for Realtors.

Want to see stats specific to your Community?  Register for our Market Report at http://www.calgaryareasolds.com/

Find out what your Neighbor’s home sold for – Register for our Market Report at http://www.calgaryareasolds.com/ 


Calgary housing market softens slightly as we approach Christmas.  Single family homes and apartment Condos moved slightly toward a balanced market while the Townhouse market went slightly deeper into a Sellers market.  Below is a summary of some key areas with a few short comments.  


Calgary Listing Inventory: As I would expect all Inventory levels decreased this last month. Inventories typically decrease at this time of year as some people now wait until the New Year to list. Interestingly the decrease was about 40% less than our decrease in November last year.


Inventory

Oct 2014    

Nov 2014    

Change

Single Family Home

2780

2373

-408

Condo Townhouse    

568

511

-57

Condo Apartment  

1088

985

-103

Total

4436

3869

-567


Calgary Sales:

Typically at this time of year we also see sales numbers decreasing. Sales in November decreased in all categories. Compared to last year sales from October to November decreased slightly more than last year however sales numbers are still higher than November 2013.


Sales

Oct 2014    

Nov 2014    

Change

% Change

Single Family Home

1462

1181

-281

-.19

Condo Townhouse  

300

277

-23

-.07

Condo Apartment

385

324

-61

-.16

Total

2147

1782

-365

.17


Calgary Real Estate Sales Prices:

In November the benchmark price decreased for single family homes and increased for Townhouses and apartment condos. The change is so small it’s insignificant. December pricing should remain fairly stable. Based on what I am seeing my early prediction for the New Year is for prices to continue to increase for Single family homes, and less so for Townhouses. Apartment condo prices should remain fairly stable as we are in a balanced market state.  

Sales Prices

Oct 2014   Benchmark Price

Nov 2014   Benchmark Price

Change

Single Family Homes

513,500

511,300

-2,200

Condo Townhouse  

337,800

338,600

+800

Condo Apartment  

299,800

300,700

+900


Sales Prices “Year to Date”

Year to date prices – Prices have increased in all categories. Good news if you are a homeowner.

Sales Prices

Dec 31 2013 Benchmark Price

Nov 2014   Benchmark Price

Change

$

% Change

Single Family Homes

472,200

511,300

39,100

+9.3%

Condo Townhouse  

307,100

338,600

31.500

+10.25%

Condo Apartment  

278,600

300,700

22,100

+7.9%


Absorption Rate (Months of Inventory)  (the inventory divided by the number of sales in the last month). What does this mean you might ask?

Buyer’s Market

>4.0

Balanced Market

Between 2.8 to 4.0

Seller’s Market

<2.8


*** Absorption Rate:

This month the absorption rate increased for Single Family homes and Apartment Condos while Townhouses decreased slightly. This moves Single family homes closer towards a balanced market, Townhouses in a deeper Sellers market and apartment condos move stronger into a balanced market.

Absorption Rate

Oct 2014  

Nov 2014  

Change

Single Family Homes

1.90

2.01

+.11

Condo Townhouse  

1.89

1.84

-.05

Condo Apartment  

2.83

3.04

+.21

Total Calgary

2.06

2.17

+.11


**Please note that these numbers do change on a community basis and more so for towns. If you would like to find stats on your community just let me know. If you have any questions about this summary, the attached stats package or any Real Estate questions please feel free to contact us.