Archive for the ‘Blog’ Category

Calgary Real Estate Market Snapshot: April 1, 2018

Tuesday, April 3rd, 2018

Calgary Real Estate Absorption Rate

What is really happening in the Calgary Real Estate Market?

Stay ahead of everyone else by following our Monthly Market Snapshot of the Calgary Real Estate Market, This shows what’s really happening! The market is driven by supply and demand so here we show the inventory (supply) and sales (demand) and most importantly the relationship between the two and how it affects the price of Calgary Real Estate.  A simple way to keep up to date with how the market is trending and to stay ahead of most! All numbers are taken from the Calgary Real Estate Boards Stats package for Realtors. I have also included some general comments which are simply my opinion.

Absorption Rate (Months of Inventory – the inventory divided by the number of sales in the last month). What does this mean you might ask?

Buyer’s Market >4.0 Drives prices down
Balanced Market Between 2.4 to 4.0 Prices typically remain stable
Seller’s Market <2.4 Drives prices up


Current Absorption Rate

The good news part of the stats show that sales rose by 25.6% over Febuary while the inventory rose by only 22.5% keeping the balance similar.  The Absorption rate for all categories decreased slightly except apartment condos which increased by .47

End of Feb 2018       Mar 2018    Change
Detached 3.74 3.61 -0.13
Semi Detached 5.05 4.70 -0.35
Attached – Row 5.86 5.77 -0.08
Apartment 7.24 7.72 0.47
Total City 4.76 4.64 -0.12


Calgary Listing Inventory

In March, our inventory increased in all Sectors. This is totally expected at this time of year.  This trend is anticipated for the next few months.

Inventory Feb 2018       Feb Mar 2018    Change
Detached 2456 3063 607
Semi Detached 540 677 137
Attached – Row 779 941 162
Apartment 1427 1690 263
Total City 5202 6371 1169


Calgary Sales:  For me this is the category that is concerning.  Sales numbers all increased for March which is a normal trend.  What you cannot see here is that sales for the first three months are below last years sales by 18% which is substantial.  Some things that might be affecting sales include:

  • The Weather
  • Mortgage rule changes that the Federal Government implemented on Jan 1, 2018
  • Consumer confidence in Calgary

As I have predicted in the past I believe it may take 6 months total for the mortgage rules to settle out before we start seeing more normal sales numbers.

Calgary Sales  Feb 2018         Mar 2018    Change % Change
Detached 657 848 191 29.07%
Semi Detached 107 144 37 34.58%
Attached – Row 133 163 30 22.56%
Apartment 197 219 22 11.17%
Total City 1094 1374 280 25.59%


Calgary Real Estate Sales Prices:

Prices in March  showed very little change for all categories.

  Sales Prices Feb 2018   Benchmark Price   Mar 2018   Benchmark Price Change
Detached 502,800 503,800 1,000
Semi Detached 418,800 418,800 0
Attached – Row 295,400 297,600 2,200
Apartment 256,400 257,100 700
Total City 434,300 435,600 1,300


Sales Prices “Year to Date”  

Sales Prices Jan 1, 2018    Benchmark Price  Mar 2018   Benchmark Price Change

$

% Change
Detached 499,600 503,800 4,200 0.84%
Semi Detached 416,600 418,800 2,200 0.53%
Attached – Row 299,500 297,600 -1,900 -0.63%
Apartment 257,700 257,100 -600 -0.23%
Total City 433,200 435,600 2,400 0.55%


**Please note that these numbers include only Calgary homes and do change on a community basis and more so for towns.  This report does not include rural properties.  If you would like to find stats on your community just let me know.  If you have any questions about this summary or about Real Estate in general, please feel free to contact us.


Calgary Real Estate Market Snapshot March 1, 2018

Thursday, March 1st, 2018

What is really happening in the Calgary Real Estate Market?

Calgary Real Estate Absorption Rate

Stay ahead of everyone else by following our Monthly Market Snapshot of the Calgary Real Estate Market, This shows what’s really happening! The market is driven by supply and demand so here we show the inventory (supply) and sales (demand) and most importantly the relationship between the two and how it affects the price of Calgary Real Estate.  A simple way to keep up to date with how the market is trending and to stay ahead of most! All numbers are taken from the Calgary Real Estate Boards Stats package for Realtors. I have also included some general comments which are simply my opinion.

Absorption Rate (Months of Inventory – the inventory divided by the number of sales in the last month). What does this mean you might ask?

Buyer’s Market >4.0 Drives prices down
Balanced Market Between 2.4 to 4.0 Prices typically remain stable
Seller’s Market <2.4 Drives prices up

Current Absorption Rate

The Absorption rate for Detached homes and apartment condos decreased from January while Semi-detached and Row homes increased.  Most of the changes are small except there was a large decrease for apartment condos, this decrease is simply offsetting last months spike.

End of Jan 2018    Feb 2018    Change
Detached 3.77 3.74 -0.03
Semi Detached 4.51 5.05 0.54
Attached – Row 5.34 5.86 0.52
Apartment 8.77 7.24 -1.53
Total City 4.84 4.76 -0.08


Calgary Listing Inventory

In February, our inventory increased in all Sectors. This is totally expected at this time of year.  This trend is anticipated for the next few months.

Inventory Jan 2018    Feb 2018    Change
Detached 2199 2456 257
Semi Detached 451 540 89
Attached – Row 699 779 80
Apartment 1289 1427 138
Total City 4638 5202 564


Calgary Sales:  Sales numbers all increased for February.  What you cannot see here is that sales decreased 18% from February of last year.  I believe this decrease is due in part to the weather we have had, but more because of the new mortgage rules.   I believe it will take another couple of months for the sales to come back to a more normal level.

Calgary Sales  Jan 2018    Feb 2018    Change % Change
Detached 583 657 74 12.69%
Semi Detached 100 107 7 7.00%
Attached – Row 131 133 2 1.53%
Apartment 147 197 50 34.01%
Total City 959 1094 135 14.08%

Calgary Real Estate Sales Prices:

Prices in February showed an increase in Detached and Semi-Detached sectors, a tiny increase in Apartment condos and a decrease in Attached-Row homes.

  Sales Prices Jan 2017 Benchmark Price   Feb 2018   Benchmark Price Change
Detached 499,400 502,800 3,400
Semi Detached 415,800 418,800 3,000
Attached – Row 296,700 295,400 -1,300
Apartment 256,200 256,400 200
Total City 432,300 434,300 2,000


Sales Prices “Year to Date”  

Same as monthly number

Sales Prices Jan 1, 2018    Benchmark Price  Feb 2018   Benchmark Price Change

$

% Change
Detached 499,600 502,800 -200 -0.04%
Semi Detached 416,600 418,800 -800 -0.19%
Attached – Row 299,500 295,400 -2,800 -0.93%
Apartment 257,700 256,400 -1,500 -0.58%
Total City 433,200 432,300 -900 -0.21%


**Please note that these numbers include only Calgary homes and do change on a community basis and more so for towns.  This report does not include rural properties.  If you would like to find stats on your community just let me know.  If you have any questions about this summary or about Real Estate in general, please feel free to contact us.
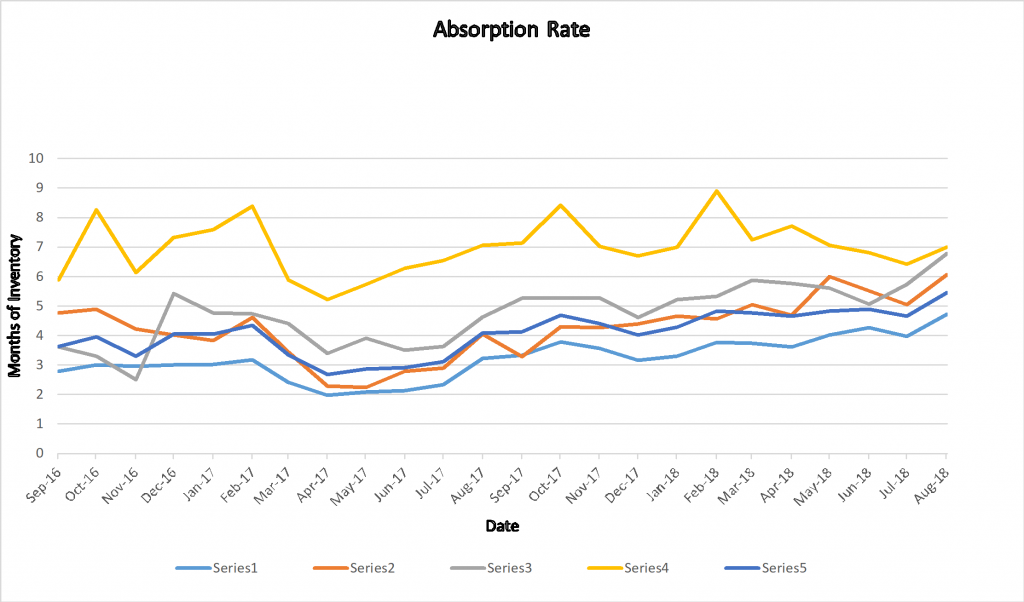


Calgary Real Estate Market Snapshot Feb 1, 2018

Friday, February 2nd, 2018

Absorption Rate – Calgary Real Estate

What is really happening in the Calgary Real Estate Market?

Stay ahead of everyone else by following our Monthly Market Snapshot of the Calgary Real Estate Market This shows what’s really happening! The market is driven by supply and demand so here we show the inventory (supply) and sales (demand) and most importantly the relationship between the two and how it affects the price of Calgary Real Estate.  A simple way to keep up to date with how the market is trending and to stay ahead of most! All numbers are taken from the Calgary Real Estate Boards Stats package for Realtors. I have also included some general comments which are simply my opinion.

Absorption Rate (Months of Inventory – the inventory divided by the number of sales in the last month). What does this mean you might ask?

Buyer’s Market >4.0 Drives prices down
Balanced Market Between 2.4 to 4.0 Prices typically remain stable
Seller’s Market <2.4 Drives prices up


Current Absorption Rate

The absorption rate for December increased for Detached and Apartment sectors with a tiny increase in Attached Row homes.  The only decrease is in the Semi-Detached.

At this point I am speculating however I believe that with the mortgage rule changes that went into affect Jan 1st we are going to see some buyers shifting from detached homes to Semi-Detached and from Semi-Detached to Row and from row to apartment condos.


End of Dec 2017  Jan 2018    Change
Detached 3.30 3.75 0.45
Semi Detached 4.64 4.56 -0.09
Attached – Row 5.22 5.33 0.11
Apartment 6.99 8.89 1.90
Total City 4.28 4.83 0.55


Calgary Listing Inventory

In January our inventory increased in all Sectors. This is totally expected as some sellers take their home off the market for December and relist in January.

Inventory Dec 2017  Jan 2018    Change
Detached 2033 2185 152
Semi Detached 441 451 10
Attached – Row 658 698 40
Apartment 1182 1289 107
Total City 4314 4623 309


Calgary Sales:

Sales numbers are down a little from December and again this is a normal seasonal trend.  What is important to note here is that when we compare with last year, January sales were 2% higher than in January 2017.


Calgary Sales  Dec 2017  Jan 2018    Change % Change
Detached 616 583 -33 -5.36%
Semi Detached 95 99 4 4.21%
Attached – Row 126 131 5 3.97%
Apartment 169 145 -24 -14.20%
Total City 1008 958 -50 -4.96%

Calgary Real Estate Sales Prices:

Prices in January decreased in every sector with larger decreases in the Attached Row and apartment condo sectors.  This is consistent with higher absorption rates in those sectors.


  Sales Prices Dec 2017 Benchmark Price   Jan 2018   Benchmark Price Change
Detached 499,600 499,400 -200
Semi Detached 416,600 415,800 -800
Attached – Row 299,500 296,700 -2,800
Apartment 257,700 256,200 -1,500
Total City 433,200 432,300 -900


 Sales Prices “Year to Date”  

Same as monthly number

Sales Prices Jan 1, 2018    Benchmark Price  Jan 2018   Benchmark Price Change

$

% Change
Detached 499,600 499,400 -200 -0.04%
Semi Detached 416,600 415,800 -800 -0.19%
Attached – Row 299,500 296,700 -2,800 -0.93%
Apartment 257,700 256,200 -1,500 -0.58%
Total City 433,200 432,300 -900 -0.21%


**Please note that these numbers include only Calgary homes and do change on a community basis and more so for towns.  This report does not include rural properties.  If you would like to find stats on your community just let me know.  If you have any questions about this summary or about Real Estate in general, please feel free to contact us.
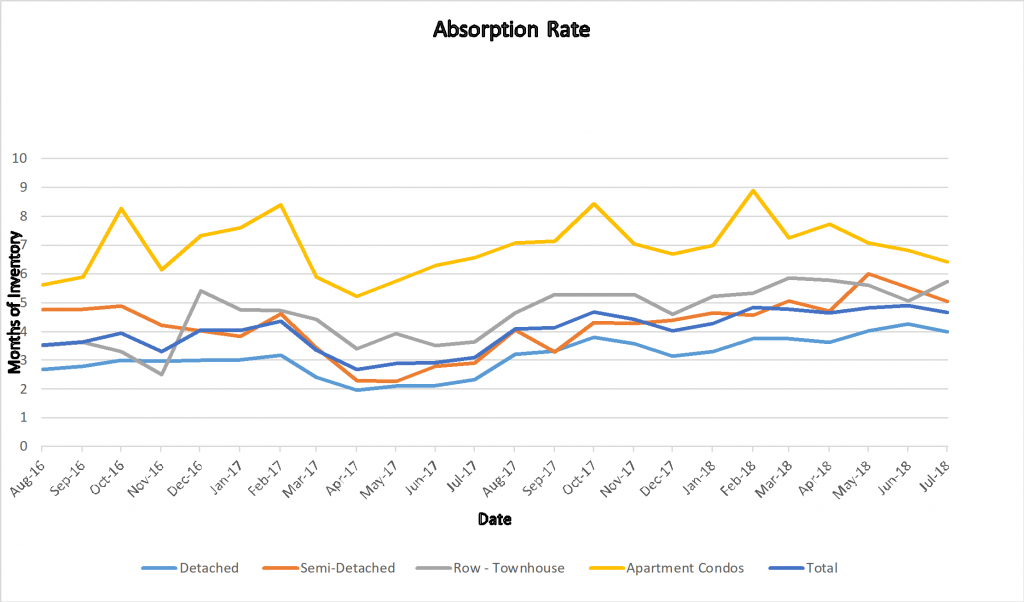
 

Annual Forecast from the Real Estate Board Economist.

In a nutshell her forecast for 2018 is that the market will stay essentially the same as it was in 2017, with similar inventory levels and sales levels.  The Calgary Real Estate Board produced a full report showing not only what they predict but the reasons why.  I found it a very interesting read.  If you would like a full copy of the report just let us know and I can email to you.


New Listing @ 14511 Deer Ridge drive SE

Wednesday, January 24th, 2018

Beautiful custom built home located in the desirable Estate area of Deer Ridge.  Located across the street from the ridge.  Large windows fill home with natural light.   Recent renovations include new flooring, fresh paint and light fixtures. Kitchen updated with new counter tops, backs splash and stainless-steel appliances.  Within the last 5 years most windows on main floor were replaced along with 2 furnaces, 2 hot water tanks, deck was resurfaced with new railings and shingles were replaced.   Large entry way leads to your curved staircase. Main floor features very bright living room with vaulted ceilings and fireplace, separate dining room, kitchen, master bedroom with ensuite, 2 additional bedrooms one which makes a perfect office.  Lower floor features family room, 2 additional bedrooms, a 3-piece bath, laundry room and the furnace room.   Enjoy your views from the front deck that spans the entire width of the home.   Rear deck off kitchen is great for BBQ’s and provides stairs to your large yard.  Transit only steps away.

MLS C4163165

List Price $469,900

For more information on this listing contact us.

Calgary Real Estate Market Snapshot Jan 1, 2018

Tuesday, January 2nd, 2018

What is really happening in the Calgary Real Estate Market?

Absorption Rate

Stay ahead of everyone else by following our Monthly Market Snapshot of the Calgary Real Estate Market This shows what’s really happening! The market is driven by supply and demand so here we show the inventory (supply) and sales (demand) and most importantly the relationship between the two and how it affects the price of Calgary Real Estate.  A simple way to keep up to date with how the market is trending and to stay ahead of most! All numbers are taken from the Calgary Real Estate Boards Stats package for Realtors. I have also included some general comments which are simply my opinion.

Absorption Rate (Months of Inventory)   (the inventory divided by the number of sales in the last month). What does this mean you might ask?

Buyer’s Market >4.0 Drives prices down
Balanced Market Between 2.4 to 4.0 Prices typically remain stable
Seller’s Market <2.4 Drives prices up


Current Absorption Rate

The Absorption rate for November increased in all categories for December.  The number of listings dropped but the number of sales dropped even more.  My concern is that a lot of inventory came off for the holiday season and we may see a ton of listings hit the market in January.  

Nov  2017  Dec  2017  Change
Detached 3.15 3.30 0.15
Semi Detached 4.40 4.64 0.24
Attached – Row 4.60 5.22 0.62
Apartment 6.69 6.99 0.31
Total City 4.01 4.28 0.26


Calgary Listing Inventory

In December all categories saw a decrease in the number of listings.  This is normal for this time of year where people will let their listing expire and then put it back on in the new year.

Inventory Nov  2017  Dec  2017  Change
Detached 2758 2033 -725
Semi Detached 555 441 -114
Attached – Row 861 658 -203
Apartment 1491 1182 -309
Total City 5665 4314 -1351


Calgary Sales:

Sales for December decreased in all categories.   Of interest our sales in all categories exceeded the sales for Dec 2016.

Total sales Dec 2016:  929

Total sales Dec 2017: 1006

Increase of 8.3%


Calgary Sales  Nov  2017  Dec  2017  Change % Change
Detached 875 616 -259 -29.60%
Semi Detached 126 95 -31 -24.60%
Attached – Row 187 126 -61 -32.62%
Apartment 223 169 -54 -24.22%
Total City 1411 1008 -403 -28.56%


Calgary Real Estate Sales Prices:

Prices in December dropped a little in all categories.   The highest decreases were in detached and attached-row houses.

  Sales Prices Nov  2017  Benchmark Price   Dec  2017  Benchmark Price Change
Detached 504,000 499,600 -4,400
Semi Detached 417,800 416,600 -1,200
Attached – Row 303,100 299,500 -3,600
Apartment 258,300 257,700 -600
Total City 436,700 433,200 -3,500


Sales Prices “Year to Date”  

Well, here is the summary for the year 2017.   Small gains in Detached and Semi-Detached homes and a small reduction in Attached Row with a larger decrease in Apartment Condos.  If you have been watching my report for the year the absorption rate for apartment condos has been very high all year.

Sales Prices Jan 1, 2017    Benchmark Price  Dec  2017  Benchmark Price Change

$

% Change
Detached 498,900 499,600 700 0.14%
Semi Detached 406,200 416,600 10,400 2.56%
Attached – Row 303,100 299,500 -3,600 -1.19%
Apartment 266,500 257,700 -8,800 -3.30%
Total City 434,100 433,200 -900 -0.21%

  **Please note that these numbers include only Calgary homes and do change on a community basis and more so for towns.  This report does not include rural properties.  If you would like to find stats on your community just let me know.  If you have any questions about this summary or Real Estate questions please feel free to contact us.

My Prediction for 2018

The big news is that as of yesterday the mortgage rules changed and people will be able to qualify for less mortgage due to the new “Stress Test”

When the government made the same change for 5% Down mortgages we saw little impact in the market so I am predicting little impact on the market due to this.  If anything we will see less sales activity in Detached homes and some buyers will move into attached homes or Townhomes.  Some who could previously qualify for a townhouse may now move into the Apartment Condo sector.  For Calgary if this prediction comes true it could be good as it may balance out the market categories.  Overall I believe that the Calgary Market will continue to pick up momentum through 2018.

Happy New Year, we hope you have an awesome 2018.

Should You Buy the Latest Home Automation Gadgets?

Tuesday, December 19th, 2017

You’re at work when the thought hits you, “Did I lock the door when I left this morning?”

You check your smartphone, see that you didn’t, and click the “LOCK” button. Now your house is secure. That’s home automation for you! But, is home automation a good idea?

That depends on a number of factors. On the pro side, home automation can improve your quality of life. There are automation products that will adjust heating/cooling depending on whether or not you’re home, make your morning coffee when you get out of bed, and the list goes on and on. These conveniences save you time. Home automation can also give you peace-of-mind. It’s comforting to be able to remotely see the inside of your home and check that everything’s okay.

Home automation can also make your property more appealing to buyers. Traditionally, buyers like homes with security systems, and will appreciate other automation gizmos, too. The only downside is the cost. Like most new technology, home automation products can be pricey and may become out-of-date within just a few years.

Thinking about it? Experts advise you to do your research first. Check out product reviews online. Then, if you determine that a particular product is going to benefit you, go for it!


Radon Gas Awareness

Tuesday, December 19th, 2017

What Is Radon Gas? 

Radon is an invisible, odourless, and tasteless radioactive gas  found naturally in soil and rock from the breakdown of uranium.   Radon gas may be inside your home and can be a health risk to you and your family.  Long term exposure can lead to lung cancer making it the leading cause of lung cancer among non-smokers.

Why is this important to me? 

In a recent study done by the University of Calgary researchers found that radioactive radon gas exceeds safe levels in one in eight Calgary Homes.   The study found that homes built in the past 25 years had a 31.5% higher average Radon Levels as they are built with tighter seals and have less ventilation than older homes.

How do I know if my home has high levels of Radon gas? 

The only way to know for sure is to have your home tested.  You can buy the test kits anywhere from home depot to The Lung Association.  The Kit from the Lung Association is only $34.99 +$11.95 shipping and includes the kit, instructions and Lab testing fees.  Order your kit here Lung Association

What if my home has high levels of Radon Gas? 

This is the easy part,  home venting to migate high levels of radon usually costs between $2000 to $2500.

If you would like to learn more about Radon Gas here is a great article from the Calgary Herald


Calgary Real Estate Market Snapshot – Dec. 1, 2017

Saturday, December 2nd, 2017

Absorption Rate Dec. 2017

What is really happening in the Calgary Real Estate Market?

Stay ahead of everyone else by following our Monthly Market Snapshot of the Calgary Real Estate Market This shows what’s really happening! The market is driven by supply and demand so here we show the inventory (supply) and sales (demand) and most importantly the relationship between the two and how it affects the price of Calgary Real Estate.  A simple way to keep up to date with how the market is trending and to stay ahead of most! All numbers are taken from the Calgary Real Estate Boards Stats package for Realtors. I have also included some general comments which are simply my opinion.

What is Absorption Rate (Months of Inventory)   (the inventory divided by the number of sales in the last month). What does this mean you might ask?

Buyer’s Market >4.0 Drives prices down
Balanced Market Between 2.4 to 4.0 Prices typically remain stable
Seller’s Market <2.4 Drives prices up

Current Absorption Rate

The Absorption rate for November decreased in all categories except Semi – Detached which rose a little.  In my opinion this is mainly due to listings expiring and not due to sales.  Either way this is good as it is keeping the market fairly balanced. 

Oct  2017  Nov  2017  Change
Detached 3.57 3.15 -0.42
Semi Detached 4.27 4.40 0.13
Attached – Row 5.28 4.60 -0.68
Apartment 7.03 6.69 -0.35
Total City 4.41 4.01 -0.39


Calgary Listing Inventory

In November all categories saw a decrease in the number of listings.  This is normal for this time of year where people will let their listing expire and then put it back on in the new year.

Inventory Oct  2017  Nov  2017  Change
Detached 3246 2758 -488
Semi Detached 611 555 -56
Attached – Row 967 861 -106
Apartment 1639 1491 -148
Total City 6463 5665 -798


Calgary Sales:

Sales for November saw a small decrease overall.  Attached Row homes are the only category to show an increase.  Semi-Detached saw a rather large decrease and it’s my belief that this is simply listings expiring that will be relisted in January.

Of interest Calgary year to date sales are 15% above last year’s sales.

Calgary Sales  Oct  2017  Nov  2017  Change % Change
Detached 908 875 -33 -3.63%
Semi Detached 143 126 -17 -11.89%
Attached – Row 183 187 4 2.19%
Apartment 233 223 -10 -4.29%
Total City 1467 1411 -56 -3.82%


Calgary Real Estate Sales Prices:

Prices for November showed a slight decrease in Calgary.  This in my opinion is mainly due to consumer confidence or lack of it.

  Sales Prices Oct  2017  Benchmark Price   Nov  2017  Benchmark Price Change
Detached 506,200 504,000 -2,200
Semi Detached 419,000 417,800 -1,200
Attached – Row 305,000 303,100 -1,900
Apartment 261,600 258,300 -3,300
Total City 438,900 436,700 -2,200


Sales Prices “Year to Date”  

Sales Prices Jan 1, 2017    Benchmark Price  Nov  2017  Benchmark Price Change

$

% Change
Detached 498,700 504,000 5,300 1.06%
Semi Detached 406,800 417,800 11,000 2.70%
Attached – Row 302,600 303,100 500 0.17%
Apartment 265,000 258,300 -6,700 -2.53%
Total City 433,400 436,700 3,300 0.76%

 **Please note that these numbers include only Calgary homes and do change on a community basis and more so for towns.  This report does not include rural properties.  If you would like to find stats on your community just let me know.

Calgary Real Estate Market Snapshot – Nov. 1, 2017

Thursday, November 2nd, 2017

Aborsption Rate Trend – Supply Vs Demand 

What is really happening in the Calgary Real Estate Market?

Stay ahead of everyone else by following our Monthly Market Snapshot of the Calgary Real Estate Market This shows what’s really happening! The market is driven by supply and demand so here we show the inventory (supply) and sales (demand) and most importantly the relationship between the two and how it affects the price of Calgary Real Estate.  A simple way to keep up to date with how the market is trending and to stay ahead of most! All numbers are taken from the Calgary Real Estate Boards Stats package for Realtors. I have also included some general comments which are simply my opinion.

Absorption Rate’s Explained  (Months of Inventory)   (the inventory divided by the number of sales in the last month). What does this mean you might ask?

Buyer’s Market >4.0 Drives prices down
Balanced Market Between 2.4 to 4.0 Prices typically remain stable
Seller’s Market <2.4 Drives prices up


Current Absorption Rate

The Absorption rate for October stayed almost flat with the exception of Apartment Condos which decreased by 1.38 which is the first sizable decrease we have seen in this sector in a while.  It’s important to note that last month went up by 1.29 so part of this can be just timing of listing coming on and off the market.

  Sept  2017  Oct  2017  Change
Detached 3.79 3.57 -0.21
Semi Detached 4.31 4.27 -0.04
Attached – Row 5.25 5.28 0.03
Apartment 8.42 7.03 -1.38
Total City 4.69 4.41 -0.29


Calgary Listing Inventory

In October all categories stayed flat except for detached homes which saw an decrease of 233 listings and apartment condos which decreased by 129 listings.

Inventory Sept  2017  Oct  2017  Change
Detached 3479 3246 -233
Semi Detached 621 611 -10
Attached – Row 993 967 -26
Apartment 1768 1639 -129
Total City 6861 6463 -398


Calgary Sales:

Sales for October were almost identical to September. Last year sales from Sept to Oct increased by 168 so were a little behind last year.

Calgary Sales  Sept  2017  Oct  2017  Change % Change
Detached 919 908 -11 -1.20%
Semi Detached 144 143 -1 -0.69%
Attached – Row 189 183 -6 -3.17%
Apartment 210 233 23 10.95%
Total City 1462 1467 5 0.34%


 Calgary Real Estate Sales Prices:

I find these numbers interesting as again if in a balanced market prices should remain fairly stable.  In reality every sector showed a slight decrease.  One variable that these numbers do not show is consumer confidence and I think this may have something to do with prices holding.

  Sales Prices Sept  2017    Benchmark Price   Oct  2017  Benchmark Price Change
Detached 508,900 506,200 -2,700
Semi Detached 419,400 419,000 -400
Attached – Row 306,900 305,000 -1,900
Apartment 263,700 261,600 -2,100
Total City 441,500 438,900 -2,600


 Sales Prices “Year to Date”  

Our Year to date numbers are very in alignment with the absorption rate changes.

Sales Prices Jan 1, 2017    Benchmark Price  Oct  2017  Benchmark Price Change

$

% Change
Detached 498,700 506,200 7,500 1.50%
Semi Detached 406,800 419,000 12,200 3.00%
Attached – Row 302,600 305,000 2,400 0.79%
Apartment 265,000 261,600 -3,400 -1.28%
Total City 433,400 438,900 5,500 1.27%


Looking Forward – Again just Gord’s opinion.

Based on the absorption rate we should see stability in the Detached & Semi Detached sectors while we may seem more losses in the Row House & Apartment sectors

However

You may have heard by now that the Fed’s are changing mortgage qualifying rules as of Jan 1, 2018.  This can cause a wide range of changes.

  • In the short term it can push people to buy before the end of the year.
  • When they changed the qualifying process for insured mortgages we saw little change in sales numbers.
  • I heard from one mortgage broker that most banks are already doing this for many types of mortgages so again the impact may be smaller than what some expect
  • If there is an impact and people are able to qualify for less, then this may push some people from detached homes to attached homes and from row housing to the apartment condo sector which in Calgary could bring more balance to our market.
  • Really only time will tell the whole story


**Please note that these numbers include only Calgary homes and do change on a community basis and more so for towns.  This report does not include rural properties.  If you would like to find stats on your community just let us know.  If you have any questions about this summary or Real Estate questions please feel free to contact us.


Housing Market Outlook, Fall of 2017 Produced by Canadian Mortgage and Housing Corp (CMHC)

Friday, October 27th, 2017

Every quarter CMHC provides a housing outlook report.  In the report you will find

  • New home market
  •  Resale Market
  • Rental Market
  • Economic Trends

The report show stats from the past and future predictions, In my opinion it is a great report.

To see full report click here