Archive for the ‘Blog’ Category

Prime Development Opportunity in Mount Pleasant – Calgary

Monday, May 20th, 2024

Just listed this Prime development opportunity in the fantastic community of Mount Pleasant.   This Property offers 50-foot frontage and a depth of 120 feet and is flat.   Property is ready to build on with all demolition completed, saving you time and money.  Property has also already been subdivided into two 25-foot lots.  Development opportunities are endless, with the upcoming zoning changes proposed, the City of Calgary Website indicates this property will change to “H-GO” providing higher intensity development than that of R-GC, refer to the City website or call the City for details.    Fantastic location being close to Confederation Park, Kensington, North Hill Mall, Sait, Public transit and schools. Centrally located with a short commute to downtown.


Check out full details and more photos at https://www.tswrealestategroup.com/for-sale/814-and-816-20-avenue-nw–90637854


Calgary Real Estate Market Snapshot – May 1, 2024

Wednesday, May 1st, 2024

What is really happening in the Calgary Real Estate Market?

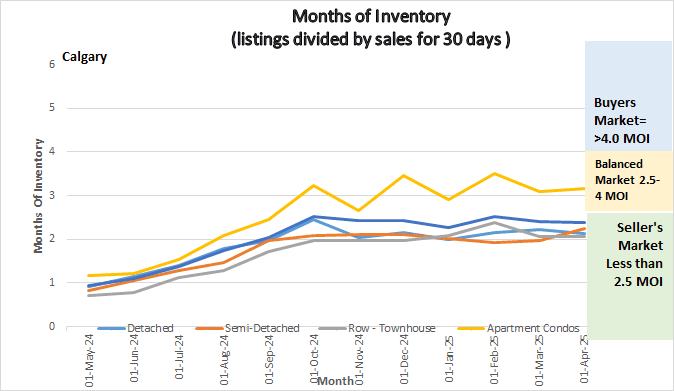
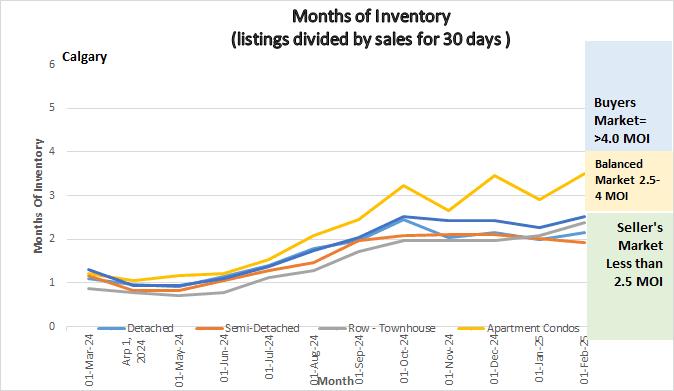
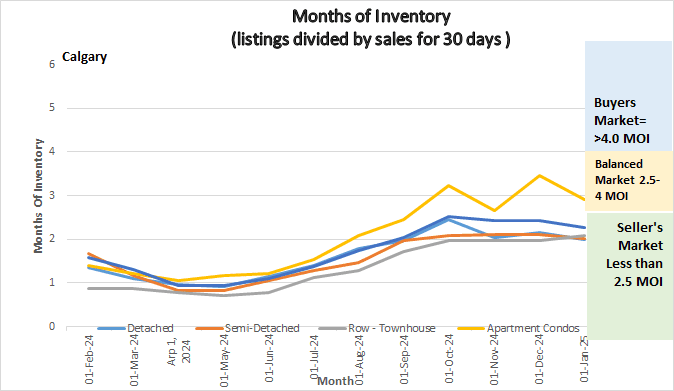
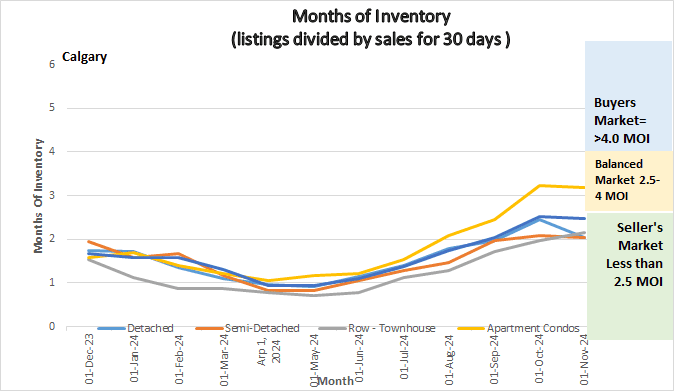
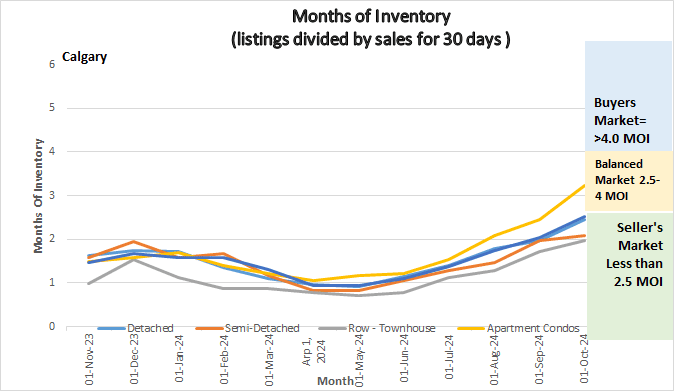
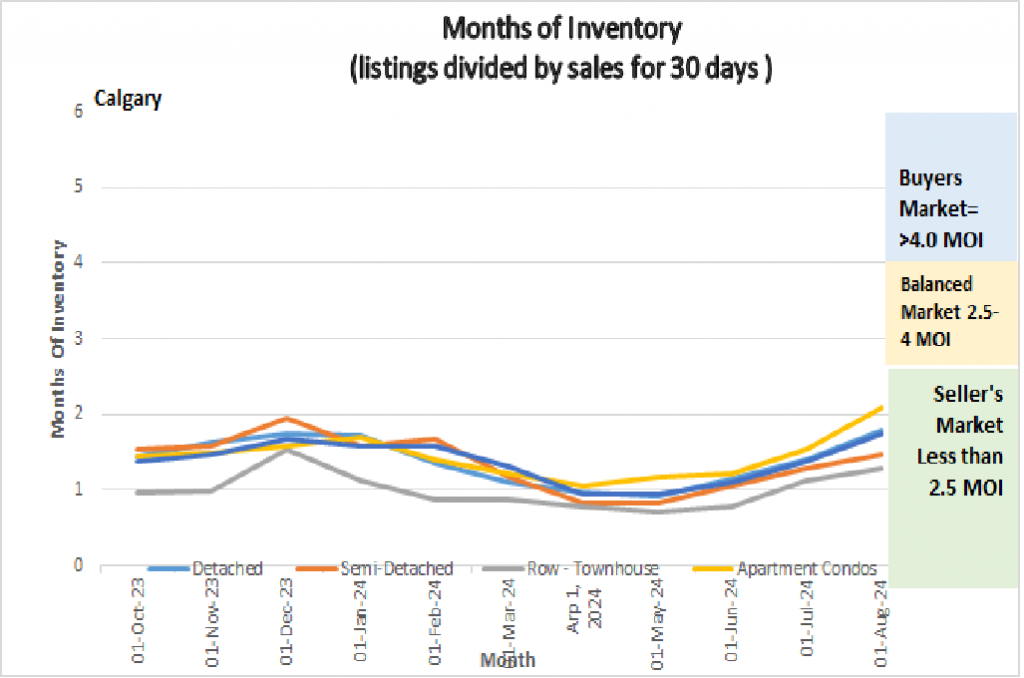
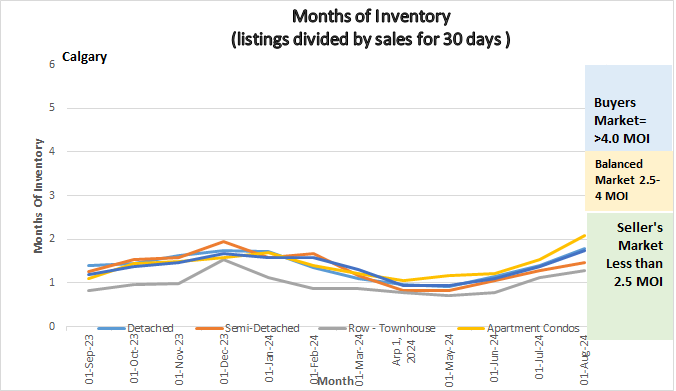
 Following is a graph that shows the months of inventory for each housing sector. Looking at a one-year trendline gives you an indication of where things are really heading.
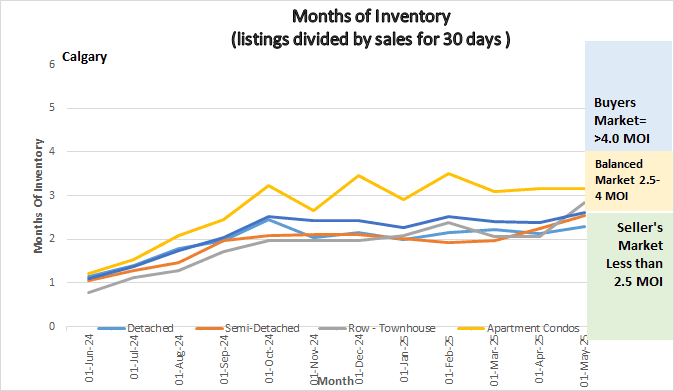
Graph showing Months of Inventory for Calgary Real Estate Market

Graph showing Months of Inventory for Calgary Real Estate Market


Gord’s commentary for the month (just my opinion).

April 2024 Highlights

2024 Continues to Roar!

  • Inventory increased but only marginally.
  • Sales Increased 7.3% over last year and are much higher than long term trends.
  • Prices increased again!
  • Seller’s market continues….


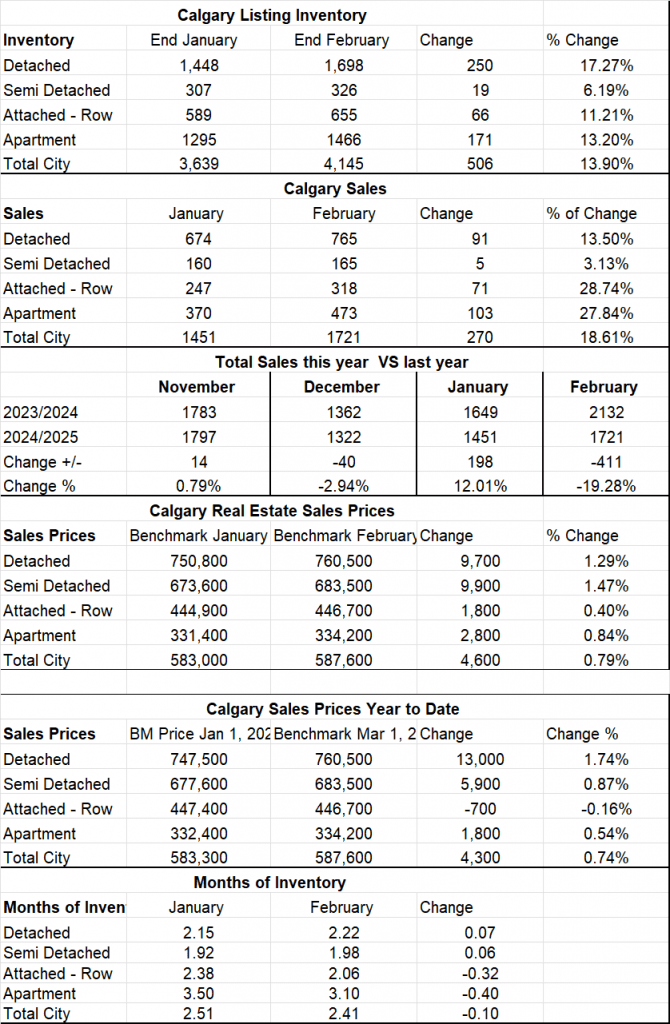
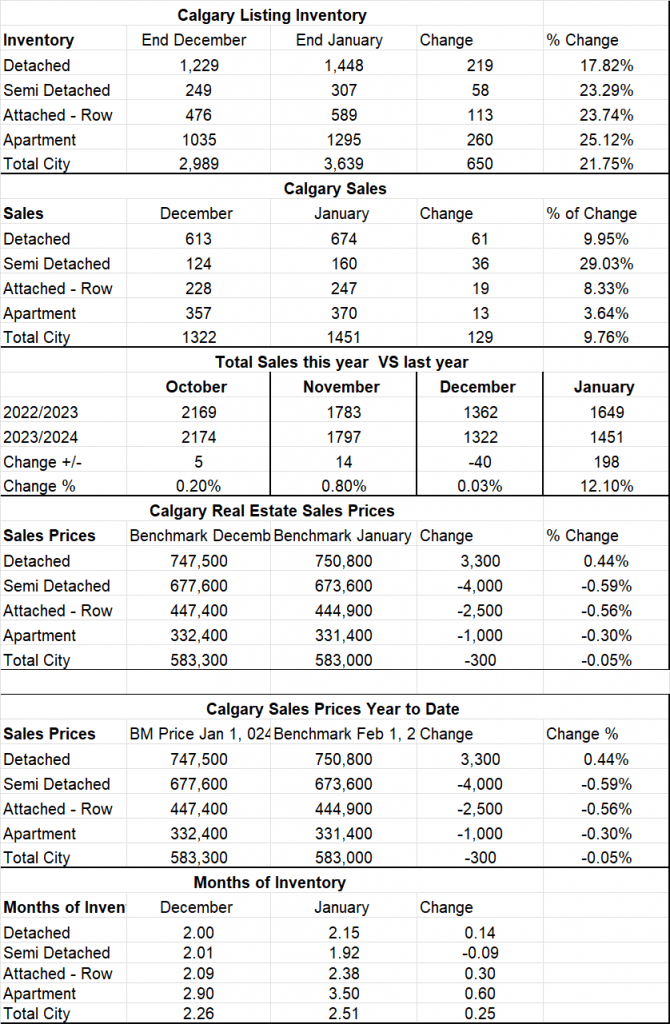
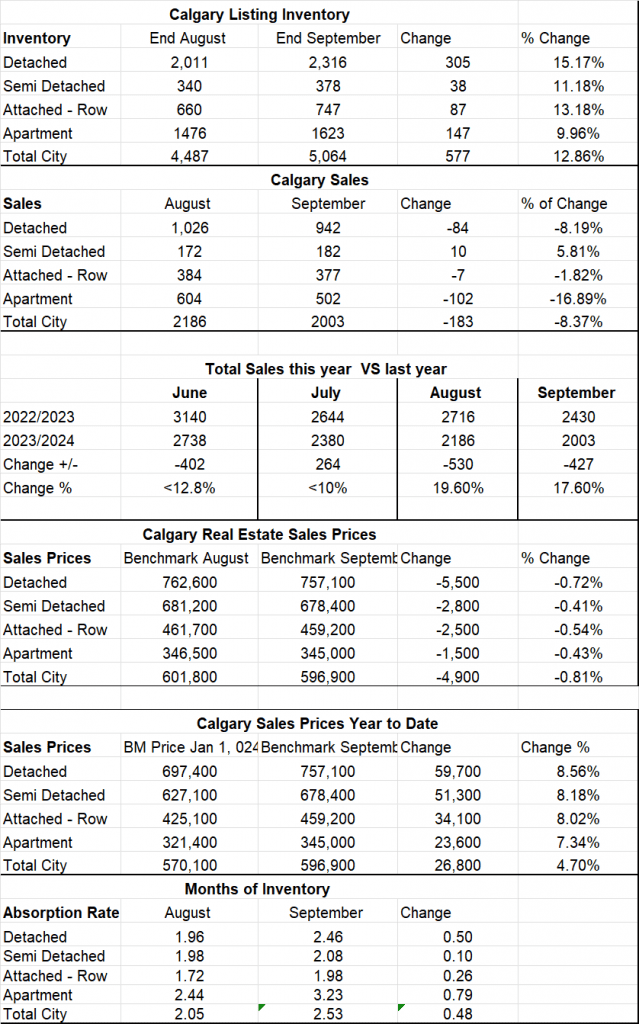
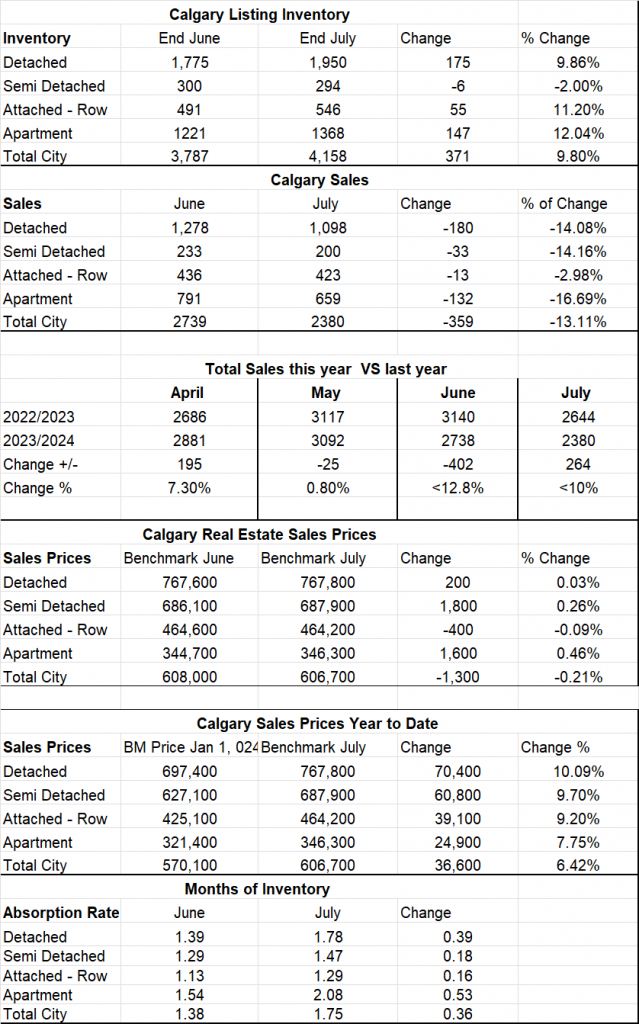
Calgary Listing Inventory

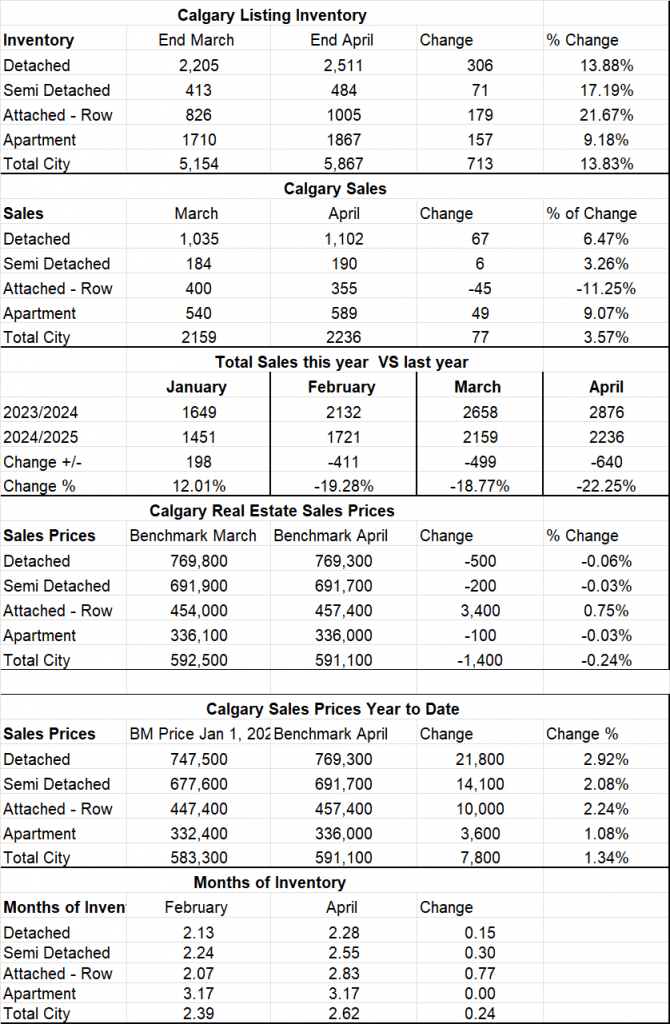
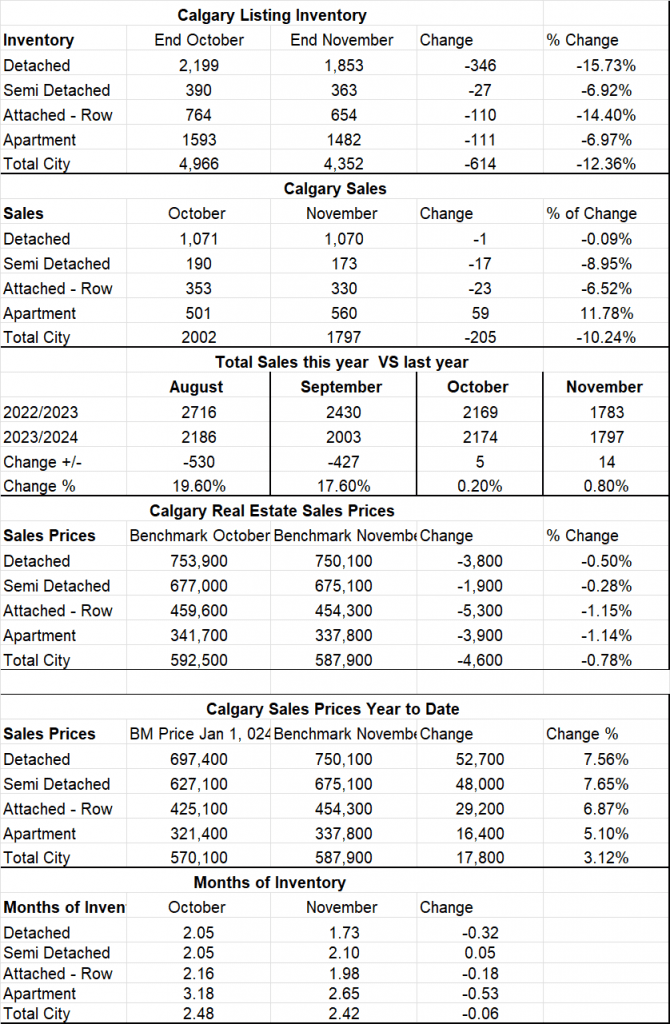
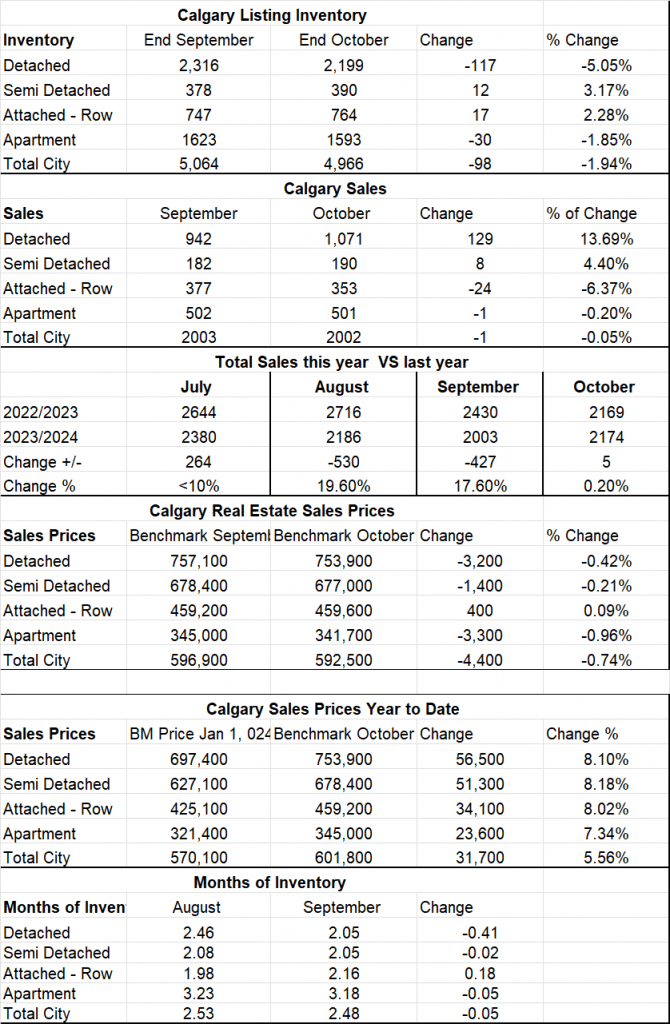
Our listing inventory increased in April, only by 179 listings so our inventory is still critically low especially in the lower price brackets.

Calgary Sales:

Sales increased again in April but only by 8.15% compared to a 24.8% increase from February to March.

As I have said before if we had more inventory the sales would be substantially higher.


Sales Compared to 2023: 

Sales in April were 195 (or 7.3%) over April of last year. Yes, this number has dropped compared to last month, so I point out that from march to April last year we saw a significant increase as I believe we were showing an increase due to the season.  This year we started off booming and it has stayed flatter.

  Jan Feb Mar Apr May June
2023 1198 1738 2135 2686    
2024 1650 2135 2664 2881    
Change +452 +397 +529 +195    
% Change 37.7% 22.8% 24.8% 7.3%    


  July Aug Sept Oct Nov Dec
2022 2249 2133 1893 1855 1642 1200
2023 2647 2729 2441 2171 1787 1366
Change +398 +596 +548 316 +145 +166
% Change +17.7% 27.9% +28.9% +17.1% 8.8% 15.5%


Calgary Real Estate Benchmark Sales Prices:

The overall Benchmark price increased by another $6,100 or 1.02% in April. Increases were fairly consistent across all sectors.

Calgary Real Estate Benchmark Year to Date Sales Price:  See chart below.

Year to date the entire market has increases by $33,600 or 5.89% which is substantial. As long as we are inventory challenged these increases will continue.


Current Months of Inventory (Absorption Rate):  Our Months of Inventory remained flat this month with the largest change being an increase in Apartment Condos of .10 and a decrease in Attached Row Homes of .9. Keep in mind that anything below 2.5 is in a seller’s market position so we are deep in Seller’s market territory and prices will continue to rise.

My Prediction for what is ahead:  Anything below 2.5 months of Inventory is in a seller’s market position so at .94 months of inventory we are deep in Seller’s market and prices will continue to rise. On the street I am seeing more offers on listings and the amount over list price appears to be rising.

If you are following Real Estate listings you will also notice that some listings, come on the market at what looks like an incredible deal! Some sellers are listing well below market value trying to create multiple offers and then those listings sell for substantially higher than list price.

 *Below is a summary of numbers in chart form. All numbers are taken from the Calgary Real Estate Boards monthly Stats package.

*All numbers vary by community and price ranges, if you would like stats specifically for your neighbourhood, please contact us.


See Calgary Real Estate Stats Below

Calgary Real Estate Board Stats

Calgary Real Estate Board Stats


Just Listed 4235 Shannon Drive Olds Ab.

Saturday, April 6th, 2024

Cheeck out this awesome new listing – this one won’t last.  Priced at only $599,900

Full details at:  https://www.tswrealestategroup.com/for-sale/4235-shannon-drive–89424947

Just Listed - 4235 Shannon drive Olds AB

Just Listed – 4235 Shannon drive Olds AB

Market Snapshot – Calgary Real Estate April 1, 2024

Tuesday, April 2nd, 2024

What is really happening in the Calgary Real Estate Market?


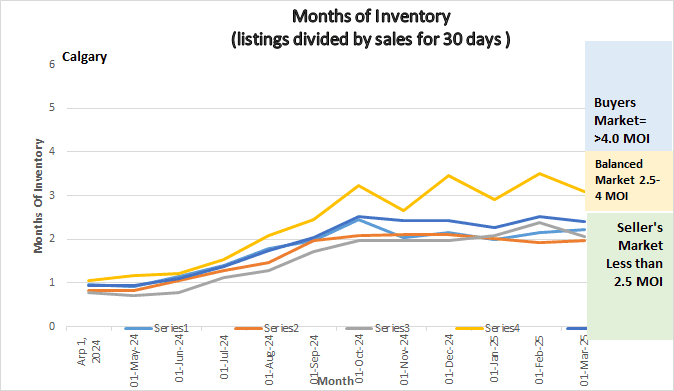
Following is a graph that shows the months of inventory for each housing sector. Looking at a one-year trendline gives you an indication of where things are really heading.

Graph showing Months of Inventory for Calgary Real Estate Market

Graph showing Months of Inventory for Calgary Real Estate Market


Gord’s commentary for the month (just my opinion).

March 2024 Highlights

A booming start to 2024!

  • Inventory increased but only marginally.
  • Sales Increased 10% over last year and are much higher than long term trends
  • Prices increased again!
  • Seller’s market continues….

Calgary Listing Inventory

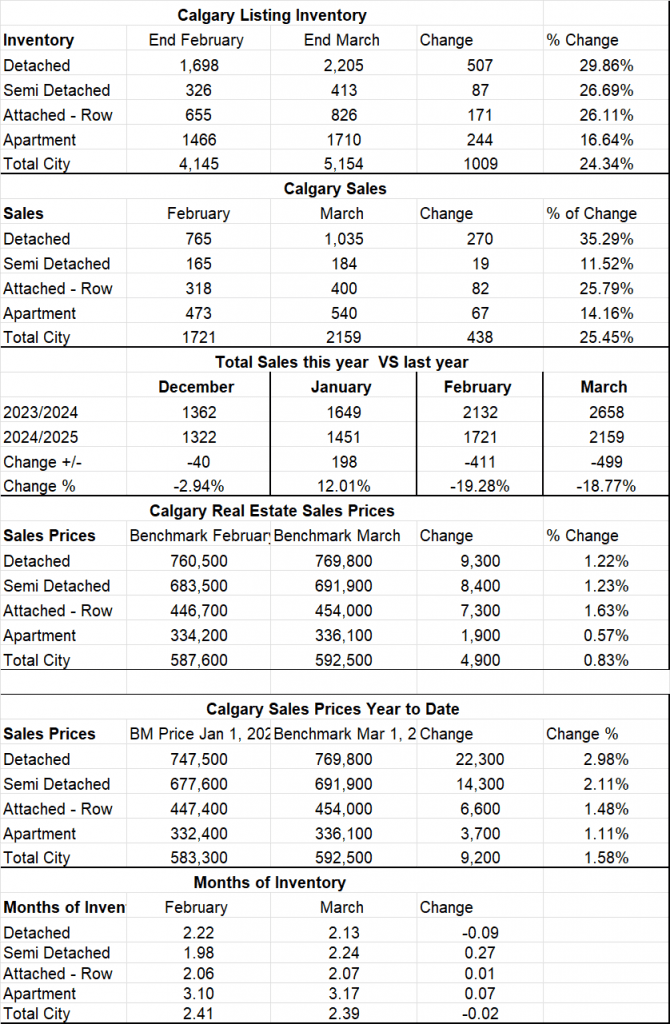
Our listing inventory increased in March but only by 177 listings across all sectors. The only sector the inventory decreased was in the Semi- Detached sector and that was by only 17 listings.

Calgary Sales:

Sales increased by 529 over last month. While it is normal to see sales increase in March over February this is a significant increase. I attribute this to new listings picking up in March.

Sales Compared to 2023: 

Sales in March were 529 (or24.8%) over March of last year. I attribute this to new listings picking up a bit. Demand in Calgary is still substantially higher than supply.


  Jan Feb Mar Apr May June
2023 1198 1738 2135      
2024 1650 2135 2664      
Change +452 +397 +529      
% Change 37.7% 22.8% 24.8%      


  July Aug Sept Oct Nov Dec
2022 2249 2133 1893 1855 1642 1200
2023 2647 2729 2441 2171 1787 1366
Change +398 +596 +548 316 +145 +166
% Change +17.7% 27.9% +28.9% +17.1% 8.8% 15.5%


Calgary Real Estate Benchmark Sales Prices:

The overall Benchmark price increased by another $12,600 or 2.15%. Increases were evenly distributed between all sectors except Apartment Condos which only saw an increase of $8,100 or 2.46%.

Calgary Real Estate Benchmark Year to Date Sales Price:  See chart below.

Year to date the entire market has increases by $27,500 or 4.82% which is substantial.


 Current Months of Inventory (Absorption Rate):  Our Months of Inventory declined again, this month by  .15 putting us into an even deeper Sellers Market. No sectors increased this month. Keep in mind that anything below 2.5 is in a seller’s market position so we are deep in Seller’s market territory and prices will continue to rise.


My Prediction for what is ahead:  Anything below 2.5 months of Inventory is in a seller’s market position so at .95 months of inventory we are deep in Seller’s market and prices will continue to rise. On the street I am seeing more offers on listings and the amount over list price appears to be rising.


*Below is a summary of numbers in chart form. All numbers are taken from the Calgary Real Estate Boards monthly Stats package.


See Calgary Real Estate Stats Below

Calgary Real Estate Board Stats

Calgary Real Estate Board Stats

Calgary Real Estate Market Snapshot – March 1, 2024

Friday, March 1st, 2024

What is really happening in the Calgary Real Estate Market?


Following is a graph that shows the months of inventory for each housing sector. Looking at a one-year trendline gives you an indication of where things are really heading.

Graph showing Months of Inventory for Calgary Real Estate Market

Graph showing Months of Inventory for Calgary Real Estate Market


Gord’s commentary for the month (just my opinion).

February 2024 Highlights

A booming start to 2024!

  • Inventory increased but only marginally.
  • Sales Increased
  • Prices increased!
  • Seller’s market continues….


Calgary Listing Inventory

Our listing inventory increased in February but only by 205 listings of which half of the increase is in the Apartment sector.


Calgary Sales:

Sales increased by 485 sales (or 29.4%).  This number is not surprising as the end of the year is always the low point and sales will normally increase from here until May or June.


Sales Compared to 2023: 

It is also important to look at sales compared to the Previous year. Sales for February beat sales from February 2023 by 397 or 22.8%.


  Jan Feb Mar Apr May June
2023 1198 1738
2024 1650 2135
Change +452 +397
% Change 37.7% 22.8%


Calgary Real Estate Benchmark Sales Prices:

The overall Benchmark price increased by $12,700 or 2.22%. Increases were seen in all market sectors with Detached homes leading (2.72%) followed by Attached Row (2.37%), then Semi-detached homes at (2.26%) and finally Apartment Condos at 1.73%


Calgary Real Estate Benchmark Year to Date Sales Price:  See chart below.

Year to date the entire market has increases by 2.61% with 2.22% of that being in February only.

Again, all sectors are up year to date.


Current Months of Inventory (Absorption Rate): 

Our Months of Inventory declined again by .20 putting us into an even deeper Sellers Market. The only sector that increased was the Attached Row sector and it increased by .01%

Keep in mind that anything below 2.5 is in a seller’s market position so we are deep in Seller’s market territory and prices will continue to rise.


My Prediction for what is ahead:  Anything below 2.5 months of Inventory is in a seller’s market position so at 1.1 month of inventory we are deep in Seller’s market and prices will continue to rise.


*Below is a summary of numbers in chart form. All numbers are taken from the Calgary Real Estate Boards monthly Stats package.


***All numbers vary by community and price ranges, if you would like stats specifically for your neighbourhood, please contact us.

Calgary Real Estate Board Stats

Calgary Real Estate Board Stats


Calgary Real Estate Market Snapshot February 1, 2024

Thursday, February 1st, 2024

What is really happening in the Calgary Real Estate Market?

Following is a graph that shows the months of inventory for each housing sector. Looking at a one-year trendline gives you an indication of where things are really heading.

Graph of Months of Inventory

Graph of Months of Inventory

Gord’s commentary for the month (just my opinion).

January 2024  Highlights

The seasonal slowdown is over and here we go again!

  • Inventory decreased again however only marginally.
  • Sales increased by 20.79 over December.
  • Prices increased slightly.
  • Seller’s market continues….


Calgary Listing Inventory

Our listing inventory declined but by only fourteen listings, so we are the same as last month.


Calgary Sales:

Sales in January increased over December by 20.79%   The reason for this increase is that new listings increased to 2137 new listings in January compared to 1248 new listings in December. I have said it before, and I will say it again that our sales depend on the number of listings as the demand is far more substantial than our supply.


Sales Compared to 2022: 

It is also important to look at sales compared to the Previous year. Sales for November were up by 8.8% from last year. The demand is still extraordinarily strong so the more we can list the more we sell.


  Jan Feb Mar Apr May June
2022 1198
2023 1650
Change +452
% Change 37.7%


  July 2023 Aug 2023 Sept 2023 Oct 2023 Nov 2023 Dec 2023
2022 2249 2133 1893 1855 1642 1200
2023 2647 2729 2441 2171 1787 1366
Change +398 +596 +548 316 +145 +166
% Change +17.7% 27.9% +28.9% +17.1% 8.8% 15.5%


Calgary Real Estate Benchmark Sales Prices:

The overall Benchmark price increased by $2,200, All sectors increased except Semi-Detached which declined by $2,100. Detached homes saw the largest increase at $4,800.


Calgary Real Estate Benchmark Year to Date Sales Price:  Same as above. 


Current Months of Inventory (Absorption Rate): 

Our Months of Inventory declined again by .28 putting us into an even deeper Sellers Market. The only sector that increased was the Semi-Detached sector and it increased by .1.

My Prediction for what is ahead: 

2024 will be a year of a Sellers Market and we will see substantial price increases in all Sectors. The root cause of our market imbalance continues to be immigration and I do not see that changing anytime soon.


**Below is a summary of numbers in chart form. All numbers are taken from the Calgary Real Estate Boards monthly Stats package.

*All numbers vary by community and price ranges, if you would like stats specifically for your neighbourhood, please contact us.


Blog Link:


See Stats from the Calgary Real Estate Market Below

Calgary Real Estate Board Stats

Calgary Real Estate Board Stats


Calgary Real Estate Market Snapshot for Jan 1, 2024

Tuesday, January 2nd, 2024

What is really happening in the Calgary Real Estate Market?


Following is a graph that shows the months of inventory for each housing sector. Looking at a one-year trendline gives you an indication of where things are really heading.

Graph of Months of Inventory

Graph of Months of Inventory


Gord’s commentary for the month (just my opinion).

December 2023 Highlights

The Calgary Market remains tight – exceptionally low in supply.

  • Sales declined by 11.06%
  • Sales are up from last December.
  • Prices declined marginally.
  • Seller’s market continues….


Calgary Listing Inventory

Our listing inventory remains extremely low with a total of 2164 listings on the market. This number decreased by 27.6% from November. It’s important to note that this number is only 55 listings lower than on Dec 31, 2022.  It is quite normal that the number of new listings declines at this time of year and I’m confident we will start seeing this number increase.

Calgary Sales:

Sales in December were down by 421 or 23.5% from November. The decreases were somewhat consistent in all sectors. This decline is very normal in December as Holiday celebrations trump Real Estate for many people.

As I have said many times what is keeping our sales down is our Inventory if there were more listings we would certainly sell more. It is interesting to note that Row Houses only decreased by 5.2%

 Sales Compared to 2022: 

It is also important to look at sales compared to the Previous year. Sales for December were up by 13.8% from last year. The demand is still extraordinarily strong so the more we can list the more we sell.


  Jan Feb Mar Apr May June
2022 2004 3305 4091 3401 3071 2837
2023 1199 1740 2432 2690 3120 3146
Change -805 -1565 -1659 -711 +57 +309
% Change -40.1% -47.4% -40.55% -20.9% +1.9% +10.9%


  July Aug Sept Oct Nov Dec
2022 2249 2133 1893 1855 1642 1200
2023 2647 2729 2441 2171 1785 1366
Change +398 +596 +548 316 143 166
% Change +17.7% 27.9% +28.9% +17.1% 8.7% 13.8%


Calgary Real Estate Benchmark Sales Prices:

The overall benchmark price decreased by $2,600 this month. The largest decreases were in the Attached-Row sector followed by Detached and then Semi-Detached. Price of Apartment condos increased by $1,300.


Calgary Real Estate Benchmark Year to Date Sales Price:  See chart below.

For all of Calgary in 2023, we saw an increase in all sectors of 9.89% or $51,300.

The lowest dollar increase was apartment condos at $46,600 followed by Attached Row at $66,800 then Semi-Detached at $64,100, and the highest sector is Detached homes at $77,800. It is important to note that this is a Calgary number and each community within Calgary will be different – some higher and some lower.


Current Months of Inventory (Absorption Rate): 

All sectors except Apartment Condos saw a small decrease in the Months of Inventory. Apartment Condos increased by .12. All sectors remain fairly deep in a seller’s market position.


My Prediction for what is ahead:  In 2024, I believe we are going to see more of the same. I know the demand is outpacing the supply by quite a but. What this means if we list more homes then it will increase our Sales not our inventory so we can expect a low inventory throughout 2024. Sales will either stay on pace or increase, and the months of inventory will remain low keeping us in a seller’s market ultimately increasing prices again.


**Below is a summary of numbers in chart form. All numbers are taken from the Calgary Real Estate Boards monthly Stats package.


*All numbers vary by community and price ranges, if you would like stats specifically for your neighbourhood, please contact us.


See Stats from the Calgary Real Estate Market Below

Calgary Real Estate Board Stats

Calgary Real Estate Board Stats

Calgary Real Estate Market Snapshot for dec 1, 2023

Friday, December 1st, 2023

What is really happening in the Calgary Real Estate Market?


Following is a graph that shows the months of inventory for each housing sector. Looking at a one-year trendline gives you an indication of where things are really heading.

Graph of Months of Inventory

Graph of Months of Inventory


Gord’s commentary for the month (just my opinion).

October 2023 Highlights

The Calgary Market appears to be slowing a little.

  • New listing in November were down 17% yet were up 38% from last year.
  • Sales declined by 18.2%%
  • Prices increased moderately.
  • Seller’s market continues….


Calgary Listing Inventory

Our inventory of listings declined in November by only 206 listings.  This is very normal as the normal trend is to see less new listings at this time of year.  When I look at last year the decline from Oct to Nov was 773 so the listing inventory change is much smaller this year.

Calgary Sales:

Sales in November were also down 382 Sales from October.  Seeing this decrease is very normal as moving towards the holiday season we typically see a slowdown.

Sales Compared to 2022: 

It is also important to look at sales compared to the Previous year. Sales for November were up by 8.8% from last year.  The demand is still very strong so the more we can list the more we sell.


  Jan Feb Mar Apr May June
2022 2004 3305 4091 3401 3071 2837
2023 1199 1740 2432 2690 3120 3146
Change -805 -1565 -1659 -711 +57 +309
% Change -40.1% -47.4% -40.55% -20.9% +1.9% +10.9%


  July Aug Sept Oct Nov Dec
2022 2249 2133 1893 1855 1642  
2023 2647 2729 2441 2171 1787  
Change +398 +596 +548 316 +145  
% Change +17.7% 27.9% +28.9% +17.1% 8.8%  


Calgary Real Estate Benchmark Sales Prices:

The overall benchmark price saw a slight increase in all sectors this month.  The overall benchmark price increased by $1,100 in November. The highest increase was $3900 in the Attached-Row sector followed by an increase of $3500 in the Apartment Condo sector. Detached homes gained $1,900 while Semi-Detached homes remained flat.


Calgary Real Estate Benchmark Year to Date Sales Price:  See chart below.

For all of Calgary year to date we have so far seen an increase in all sectors of 10.29% or $53,900.

Here are the dollar increases for each sector:

Detached: $79,900

Semi Detached: $65,700

Attached Row: $70,800

Apartment: $45,300

It is important to note that these are Calgary overall numbers and each community within Calgary will be different – some higher and some lower.


Current Months of Inventory (Absorption Rate): 

With the number of sales dropping less than the number of listings our Months of Inventory have been pushed up.  The largest change is in the Attached Row Sector which increased by .53.

While all sectors are increasing their months of inventory keep in mind that we are still very much in a seller’s market.


My Prediction for what is ahead:  Based on what I am seeing and taking history into account, I believe we will see the same slowing trend in December.  I believe this is going to be short lived and in January we will start to see the trend reverse pushing us into a deeper seller’s market.  This prediction is largely based on what is driving demand (immigration) and I do not see that changing any time soon, I predict sales are going to remain strong and prices are going to continue to trend upwards throughout 2024.

**Below is a summary of numbers in chart form. All numbers are taken from the Calgary Real Estate Boards monthly Stats package.


*All numbers vary by community and price ranges, if you would like stats specifically for your neighbourhood, please contact us.


See Stats from the Calgary Real Estate Market Below

Calgary Real Estate Board Stats

Calgary Real Estate Board Stats

Calgary Real Estate Market Snapshot for Nov 1, 2023

Wednesday, November 1st, 2023

What is really happening in the Calgary Real Estate Market?

 Following is a graph that shows the months of inventory for each housing sector. Looking at a one-year trendline gives you an indication of where things are really heading.

Graph of Months of Inventory

Months of Inventory


Gord’s commentary for the month (just my opinion).

October 2023 Highlights

The Calgary Market appears to be slowing a bit, but is it?

  • New listing in October were down 15.9% from September.
  • Sales declined by 11.06%
  • Listing Inventory declined by 5.51%
  • Prices increased moderately.
  • Seller’s market continues….

Calgary Listing Inventory

Our listing inventory remains very low with a total of 3190 listings on the market. This number decreased by 5.31% since September.  It is quite normal that the number of new listings declines at this time of year.

Calgary Sales:

Sales in October were down by 179 or 5.31% from September.  The sectors that saw the largest decreases were Apartment Condos at -76 and Detached Homes at -80.  As I have said many times what is keeping our sales down is our Inventory if there were more listings we would certainly sell more.

Sales Compared to 2022: 

It is also important to look at sales compared to the Previous year. Sales for October were up by 17.1% from last year.  The demand is still very strong so the more we can list the more we sell.


  Jan Feb Mar Apr May June
2022 2004 3305 4091 3401 3071 2837
2023 1199 1740 2432 2690 3120 3146
Change -805 -1565 -1659 -711 +57 +309
% Change -40.1% -47.4% -40.55% -20.9% +1.9% +10.9%


  July Aug Sept Oct Nov Dec
2022 2249 2133 1893 1855    
2023 2647 2729 2441 2171    
Change +398 +596 +548 316    
% Change +17.7% 27.9% +28.9% +17.1%    


Calgary Real Estate Benchmark Sales Prices:

The overall benchmark price saw a slight increase in all sectors this month. The highest increase was $7400 in the Semi-Detached sector followed by $5,800 in the Attached-Row sector.


Calgary Real Estate Benchmark Year to Date Sales Price:  See chart below.

For all of Calgary we have so far seen an increase in all sectors of 10.18% or $52,800.

The lowest dollar increases so far has been apartment condos at $41,800 and the highest is Detached homes at $78,000.  It is important to note that this is a Calgary number and each community within Calgary will be different – some higher and some lower.


Current Months of Inventory (Absorption Rate): 

Sales numbers decreased more than our listing inventory decreased moving our months of inventory slightly higher for the second month in a row.  All sectors remain in a seller’s market position.


My Prediction for what is ahead:  Based on what I am seeing, I believe we are going to see more of the same – so a little less intense competition for the next 2 months.  I predict that once January hits we will increase the number of sales and move into a deeper seller’s market.  This prediction is largely based on what is driving demand (immigration) and I do not see that changing any time soon, I predict sales are going to remain strong and prices are going to continue to trend upwards.


Calgary Real Estate Board Stats

Calgary Real Estate Board Stats


October 1, 2023: Calgary Real Estate Market Snapshot

Thursday, October 5th, 2023

What is really happening in the Calgary Real Estate Market?

 Following is a graph that shows the months of inventory for each housing sector. Looking at a one-year trendline gives you an indication of where things are really heading.

Calgary Real Estate Board Stats

Gord’s commentary for the month (just my opinion).

September 2023 Highlights

The Calgary Market is maintaining its strength, with no substantial change.

  • September sales recorded another high at 2441 Sales.
  • New listings increased over August preventing our inventory from declining more.
  • Inventory is 24% lower than last year.
  • Seller’s market continues….


Calgary Listing Inventory

Our listing inventory remains very low with a total of 3369 listings but did show a slight increase of 115 listings.  Its important to note that new listings are up, but they are being absorbed so the inventory is not increasing rapidly. Typically, in September we would see inventory rising but that is just not happening.


Calgary Sales:

Sales in September were down by 288 or 10.55% from August.  The sectors that saw the largest decreases were Apartment Condos at -170 and Attached Row houses at -60.  As I have said many times what is keeping our sales down is our Inventory if there were more listings we would certainly sell more.


Sales Compared to 2022: 

It is also important to look at sales compared to the Previous year. Sales for September were up by 28.9% from last year.  I attribute this to an increase in listings.  The demand is certainly still large so the more we can list the more we sell.


  Jan Feb Mar Apr May June
2022 2004 3305 4091 3401 3071 2837
2023 1199 1740 2432 2690 3120 3146
Change -805 -1565 -1659 -711 +57 +309
% Change -40.1% -47.4% -40.55% -20.9% +1.9% +10.9%


  July Aug Sept Oct Nov Dec
2022 2249 2133 1893      
2023 2647 2729 2441      
Change +398 +596 +548      
% Change +17.7% 27.9% +28.9%      


Calgary Real Estate Benchmark Sales Prices:

Surprise, the overall benchmark price remained almost flat this month showing a decrease of $400.  In my opinion we should have seen a rise since we are still in a seller’s market position.  I Believe this may have been just a little bounce back from last month.

Calgary Real Estate Benchmark Year to Date Sales Price:  See chart below.

For all of Calgary we have so far seen an increase in all sectors of 9.93% or $51,500.

The lowest dollar increases so far has been apartment condos at $38,000 and the highest is Detached homes at $76,500.  It is important to note that this is a Calgary number and each community within Calgary will be different – some higher and some lower.


Current Months of Inventory (Absorption Rate): 

Months of Inventory increased a little in all sectors.  The largest increase is in apartment condos (.35) and Semi-Detached (.29) while detached homes and Row Homes stayed flat.

My Prediction for what is ahead:  Based on what is driving demand (immigration) and I do not see that changing any time soon, I predict sales are going to remain strong and prices are going to continue to trend upwards although based on trends I see us slowly climbing out of the seller’s market, but it will likely take months.


**Below is a summary of numbers in chart form. All numbers are taken from the Calgary Real Estate Boards monthly Stats package.

*All numbers vary by community and price ranges, if you would like stats specifically for your neighbourhood, please contact us.

Months of Inventory