The Calgary Real Estate Market in changing.
Detached homes are now in a Seller’s market position
Semi-Detached homes are now into a balanced market position
Row (Townhouses) and Apartment condos are in a buyers market position but have moved drastically into a better market (towards balanced)
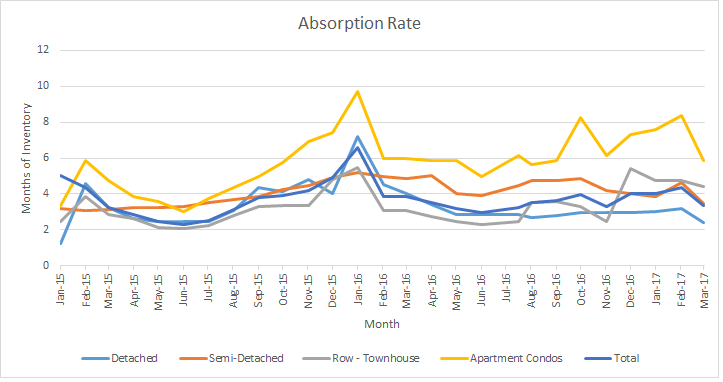
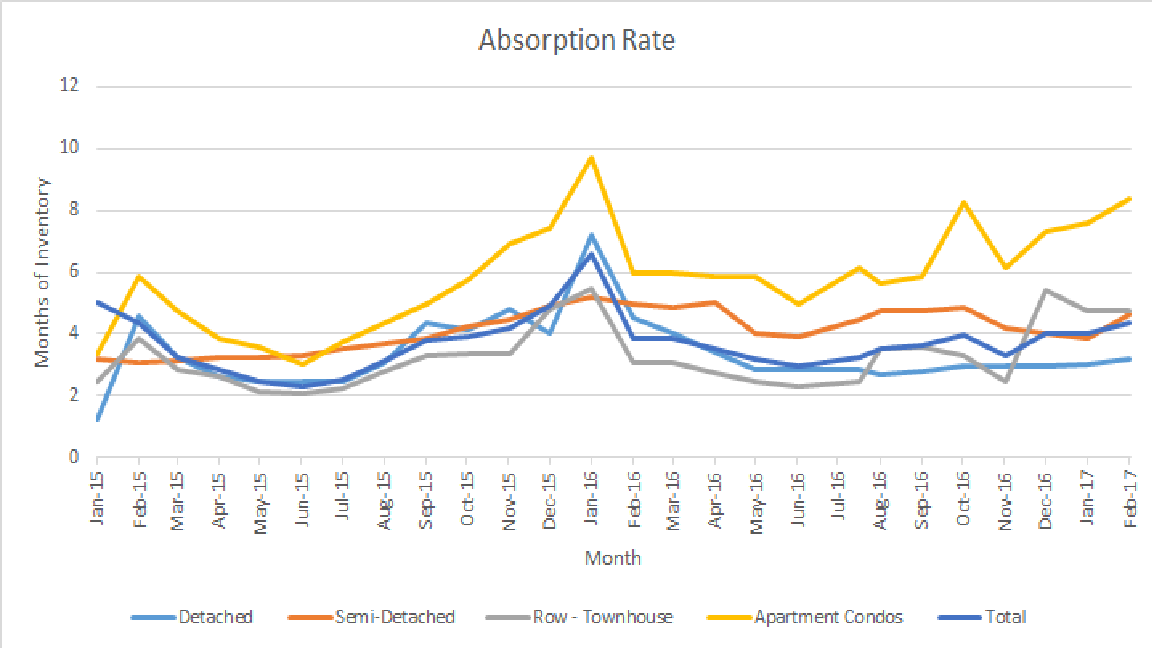
Absorption rate for the Calgary Real Estate market for February 2017.
What is really happening in the Calgary Real Estate market?
Stay ahead of everyone else by following our Monthly Market Snapshot of the Calgary Real Estate Market This shows what’s really happening! The market is driven by supply and demand so here we show the inventory (supply) and sales (demand) and most importantly the relationship between the two and how it affects the price of Calgary Real Estate. A simple way to keep up to date with how the market is trending and to stay ahead of most! All numbers are taken from the Calgary Real Estate Boards Stats package for Realtors. I have also included some general comments which are simply my opinion.
Absorption Rate (Months of Inventory) (the inventory divided by the number of sales in the last month). What does this mean you might ask?
| Buyer’s Market |
>4.0 |
Drives prices down |
| Balanced Market |
Between 2.4 to 4.0 |
Prices typically remain stable |
| Seller’s Market |
<2.4 |
Drives prices up |
*** Absorption Rate***
The absorption rate for all of Calgary decreased quite substantially this month. Not a lot of listings going on market but more importantly a large increase in sales is driving this. Detached homes have now gone into a Seller’s Market position, Attached-Row & Apartment condos are still in a buyer’s market and Semi-detached is in a balanced market.
|
December 2016 |
January 2017 |
Change |
| Detached |
3.17 |
2.41 |
-0.75 |
| Semi Detached |
4.61 |
3.44 |
-1.17 |
| Attached – Row |
4.73 |
4.41 |
-0.32 |
| Apartment |
8.40 |
5.88 |
-2.53 |
| Total City |
4.34 |
3.35 |
-0.99 |
Calgary Listing Inventory
February saw a slight increase in our inventory level in all categories. This is a normal pattern for February as were approaching the spring market. Normal trends would predict that over the next few months we will continue to see more listings so a further increase in inventory.
| Inventory |
December 2016 |
January 2017 |
Change |
| Detached |
1849 |
1990 |
141 |
| Semi Detached |
383 |
437 |
54 |
| Attached – Row |
610 |
679 |
69 |
| Apartment |
1269 |
1387 |
118 |
| Total City |
4112 |
4493 |
381 |
Calgary Sales:
Wow. Every Category saw a large increase in sales in February. The smallest increase was in Attached-row houses (townhouses) and they still increased over Jan by 19.38% It is normal for us to see an increase in sales from Jan to Feb but this is a large increase which the Calgary Market has been waiting for, for some time.
| Calgary Sales |
December 2016 |
January 2017 |
Change |
% Change |
| Detached |
584 |
825 |
241 |
41.27% |
| Semi Detached |
83 |
127 |
44 |
53.01% |
| Attached – Row |
129 |
154 |
25 |
19.38% |
| Apartment |
151 |
236 |
85 |
56.29% |
| Total City |
947 |
1342 |
395 |
41.71% |
Calgary Real Estate Sales Prices:
Prices are consistent with our Absorption rate with Detached and Semi Detached prices rising while Attached-Row houses and apartment condos decreased a little more as they are still in a buyer’s market position. My predictions for the next few months is more of the same trends.
| Sales Prices |
December 2016 Benchmark Price |
January 2017 Benchmark Price |
Change |
| Detached |
500,400 |
501,900 |
1,500 |
| Semi Detached |
384,600 |
386,300 |
1,700 |
| Attached – Row |
307,100 |
305,900 |
-1,200 |
| Apartment |
269,900 |
269,200 |
-700 |
| Total City |
437,400 |
438,100 |
700 |
Sales Prices “Year to Date”
| Sales Prices |
Jan 1, 2017 Benchmark Price |
January 2017 Benchmark Price |
Change
$ |
% Change |
| Detached |
498,300 |
501,900 |
3,600 |
0.72% |
| Semi Detached |
385,400 |
386,300 |
900 |
0.23% |
| Attached – Row |
307,900 |
305,900 |
-2,000 |
-0.65% |
| Apartment |
269,200 |
269,200 |
0 |
0.00% |
| Total City |
435,400 |
438,100 |
2,700 |
0.62% |
Price Sensitivity
**Please note that these numbers include only Calgary homes and do change on a community basis and more so for towns. This report does not include rural properties. If you would like to find stats on your community just let me know. If you have any questions about this summary or Real Estate questions please feel free to contact us.