September 1st Calgary Real Estate Market Snapshot

September 2nd, 2021

What is really happening in the Calgary Real Estate Market?

The market is a result of Supply and Demand therefore we look at both Supply (inventory) and Demand (Sales) and the relationship between the two.  We also update you on the current benchmark price for all housing sectors.

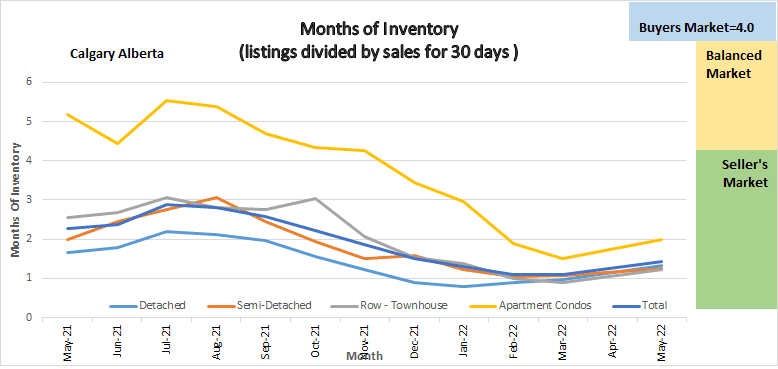
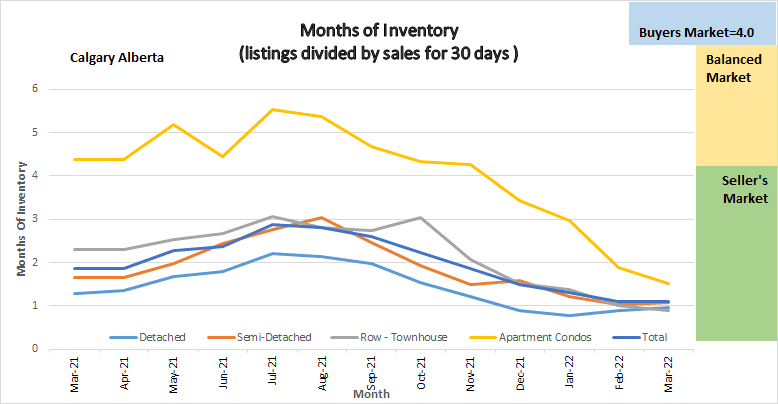
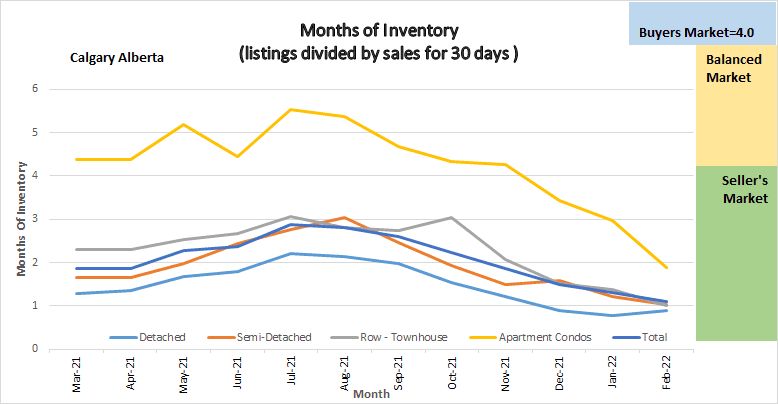
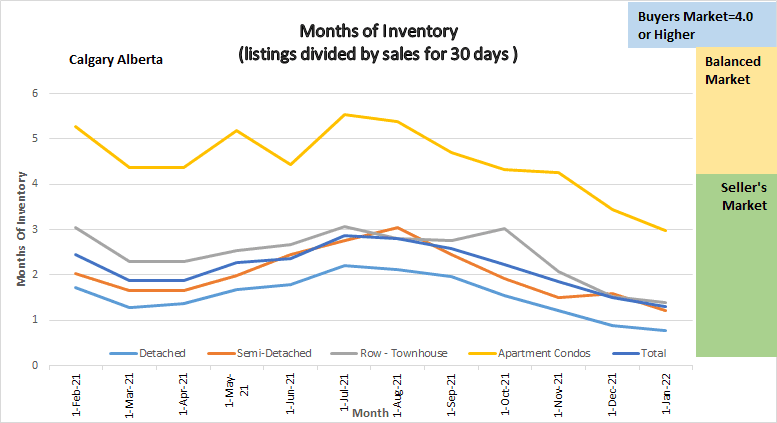
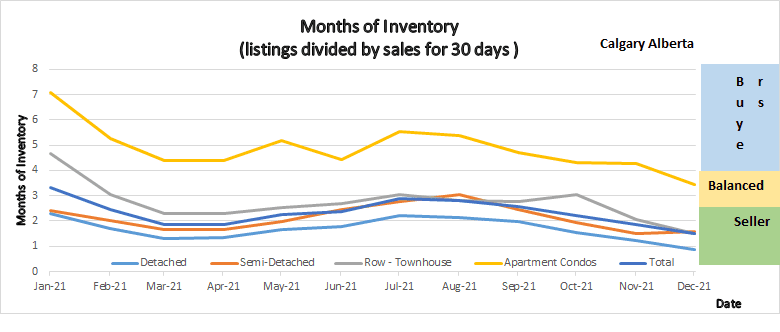
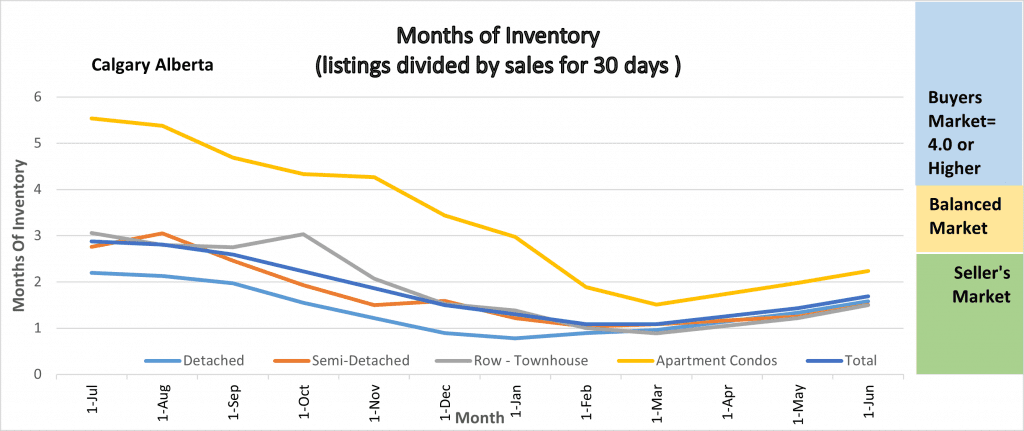
Following is a graph that shows the months of inventory for each housing sector.  Looking at a 2-year trendline gives you an indication of where things are really heading.

Graph shows 2 years of Months of Inventory for every sector in the Calgary housing market.

Gord’s commentary for the month (just my opinion).

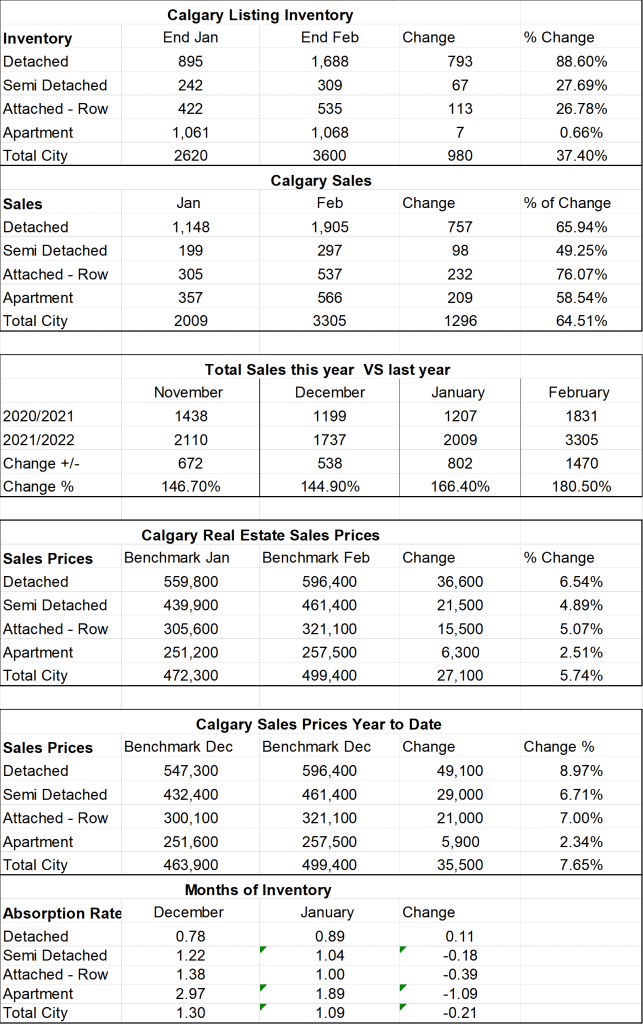
August saw a decline in inventory of 9.36%, and a decline in sales of 7.24% causing our months of inventory to decline very slightly.  Prices were mostly stable this month.


Calgary Listing Inventory

Typically, at this time of year, we see our inventory start to climb. This year that is not the case as our overall inventory declined by 625 listings.  The majority of the decline (339) were in the Detached home sector.  I believe the reason for this is there is still a pent-up demand and there are many people still shopping for that perfect home.


Calgary Sales:

Sales declined from July by a total of 168 fewer sales or 7.24%.  The majority of this is in the Detached home sector losing 113.  It is worth noting that typically sales show a decline from July to August so this is very normal.


Sales Compared to 2020:

Total sales were up by 36.6% over last year.  It is important to note that August sales did not break a record like in July however sales were 25% higher than long-term trends.  Normally this is a good category to watch however we are still comparing sales this year to when we were in a slower market due to Covid.  As you can also see every month the sales over last years are declining and this is a normal trend.


  Jan Feb Mar Apr May June
2020 861 1190 1175 573 1080 1763
2021 1208 1836 2903 3209 2989 2915
Change +347 +646 +1729 +2639 1,911 1,152
% Change +7.49 +54.4 247% +562% 277.3% 165.3%


  July Aug Sept Oct Nov Dec
2020 1835 1574 1702 1764 1437 1199
2021 2319 2151        
Change +484 +577        
% Change 126.4% 136.6%        


Calgary Real Estate Benchmark Sales Prices:

Overall, the benchmark price in Calgary decreased in July by $500

Declines were seen in the Detached Home sector (-$1200) and the Apartment Condo sector (-$800)

Increases were in the Semi-Detached sector (+$1600) and in the Attached Row sector (+$1000)

You may wonder why prices decreased in the detached home sector when the Months of Inventory is still at 2.13 which is very much a seller’s market.  I believe it’s because we have seen large increases in the last few months and things are slowing a little and settling down.


Calgary Real Estate Benchmark Sales Price:  See chart below.


Current Months of Inventory (Absorption Rate): 

The Months of inventory increased in the Semi-Detached sector and decreased marginally in all other sectors.  For all sectors, combined Months of Inventory decreased by .07


It is also important to note that these numbers vary by community, and by price range.  If you would like numbers for your community, or more specific numbers for your home please contact us.


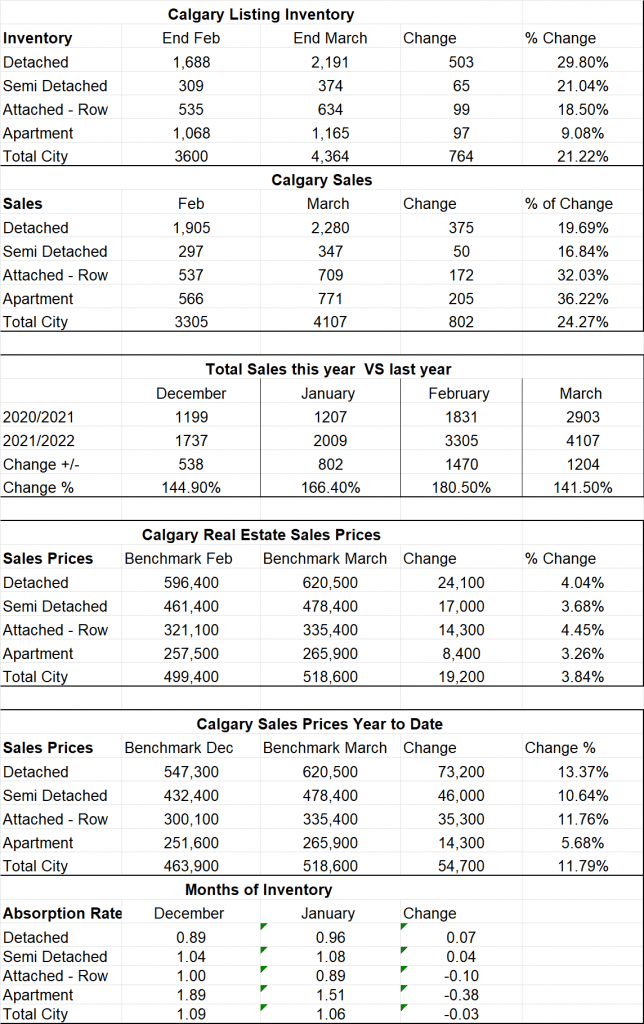
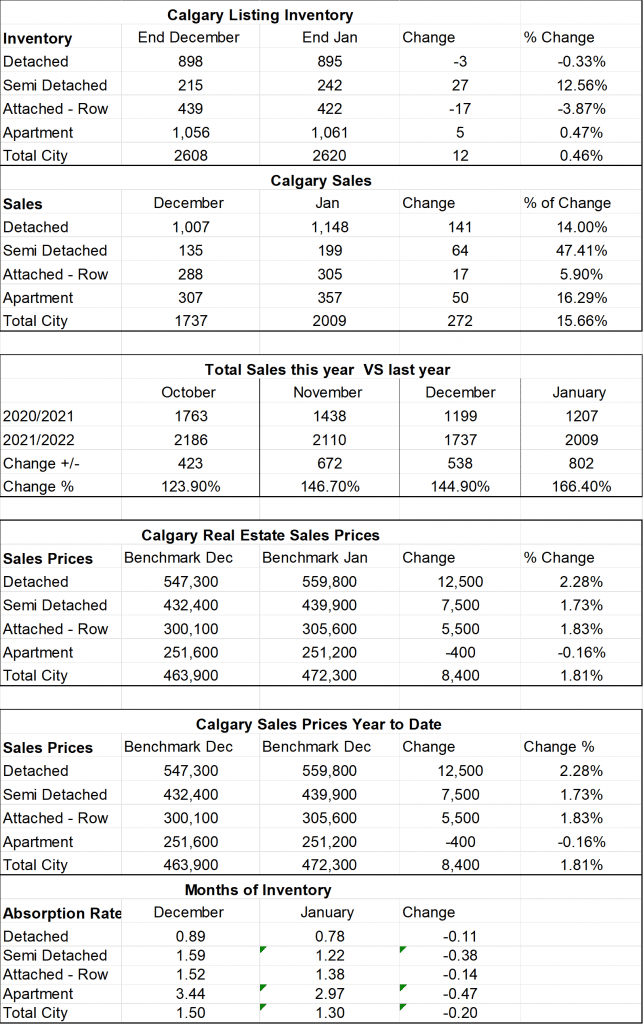
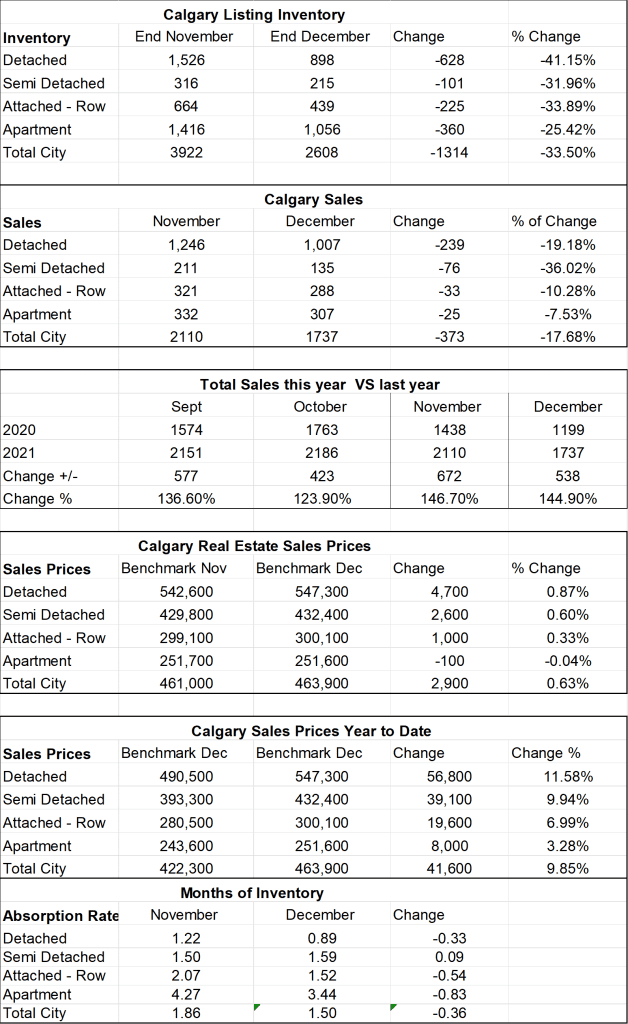
Below is a summary of numbers in chart form.  All numbers are taken from the Calgary Real Estate Boards monthly Stats package.
Key Market Stats taken from the Calgary Real Estate Boards monthly stats package for Realtors.

Just Listed 3103, 402 Kincora Glen Road NW

August 16th, 2021

Just listed this beautiful 18+ apartment condo in Kincora.  2 Bed + Den with 2 baths.

List Price:  $372,900

MLS # A1138935

See full Details: https://www.tswrealestategroup.com/for-sale/3103-402-kincora-glen-road-nw–65460995

Luxury living at its finest! Welcome to this executive suite in this spectacular and exclusive 18+ condo.  This stunning home is ready to embrace your opulent lifestyle with a spacious layout offering natural light throughout and copious design options for home offices and cozy living spaces.  This modern kitchen is ready for gourmet cooking with gorgeous quartz counters, under cabinet lighting, and stainless-steel appliances. In addition, this suite offers carefree living for all seasons within floor heating throughout and delightful air conditioning for those hot July days, paired beautifully with electronic Hunter Douglas blinds for easy access to natural light or privacy.  With 2 separate storage rooms, you can sit back worry-free for safekeeping of your many possessions as well as 2 titled parking stalls for your vehicles.  The main bedroom hosts an ensuite and a walk-in closet offering a plethora of storage options.  A west-facing patio provides a private area for you to snuggle up with a good book or entertain your many friends and family.  With walking distance to Sage Hill Crossing, all your local needs are met making this a perfect place to relax and call home.

August 1, 2021 Calgary Real Estate Market Snapshot

August 3rd, 2021

What is really happening in the Calgary Real Estate Market?

The market is a result of Supply and Demand therefore we look at both Supply (inventory) and Demand (Sales) and the relationship between the two.  We also update you on the current benchmark price for all housing sectors.

Following is a graph that shows the months of inventory for each housing sector.  Looking at a 2-year trendline gives you an indication of where things are really heading.

The graph shows the 2-year trend of months of inventory for all sectors of the Calgary Real Estate Market.


Gord’s commentary for the month (just my opinion).

Another record: Sales in July were 2319, the highest July on record!

Sales declined from last month but so did the number of listings on the market. The sales decline was slightly greater than the listings decline, pushing up the months of inventory on the market.


Calgary Listing Inventory

While inventory typically starts rising in July, our inventory declined by 240 listings. The decrease in inventory was consistent across all sectors.  I believe there is still a pent-up demand, if listings are priced right then they are selling very quickly.  Some listings I am seeing are substantially overpriced and these are sitting on the market.


Calgary Sales:

Another record: Sales in July were 2319, the highest July on record!

Compared to June sales dropped by 20.3% This is very typical as once we hit July people are focused on summer vacations and such.  The decrease in sales was consistent across all sectors.


Sales Compared to 2020:

Normally this is a good category to watch however we are now comparing sales this year to when we were in a slower market due to Covid.  As you can see sales in July were 126.4% above last July’s sales.  As you can also see every month the sales over last years are declining.


  Jan Feb Mar Apr May June
2020 861 1190 1175 573 1080 1763
2021 1208 1836 2903 3209 2989 2915
Change +347 +646 +1729 +2639 1,911 1,152
% Change +7.49 +54.4 247% +562% 277.3% 165.3%


  July Aug Sept Oct Nov Dec
2020 1835 1574 1702 1764 1437 1199
2021 2319          
Change +484          
% Change 126.4%          


 Calgary Real Estate Benchmark Sales Prices:

Overall, the benchmark price in Calgary increased again in June by $1,800

All Sectors showed price gains in July. The highest gains were in Detached homes at +$2,700 and the lowest gain was $300 in the Attached-Row sector which makes total sense based on Months of Inventory.  I am a little surprised that the Apartment sector increased by $1,100 even though that sector is still showing 5.54 months of Inventory (indicating a buyer’s market).


Calgary Real Estate Benchmark Sales Price:  See chart below.


Current Months of Inventory (Absorption Rate): 

Once again, our months of inventory gained slightly in all sectors.  The highest gain is in the Apartment Condo sector at 1.1   Every other sector was in the .4 to .5 increase range.

Detached homes are still sitting in a seller’s market.

Semi-Detached, Attached-Row homes are sitting in a balanced market position.

Apartment Condos are sitting in a buyer’s market position.


It is also important to note that these numbers vary by community, and by price range.  This month I sold an apartment condo in the SW and the months of inventory for that community was only 1.55 compared to a 5.54 in Calgary.

If you would like numbers for your community, or more specific numbers for your home please contact us.

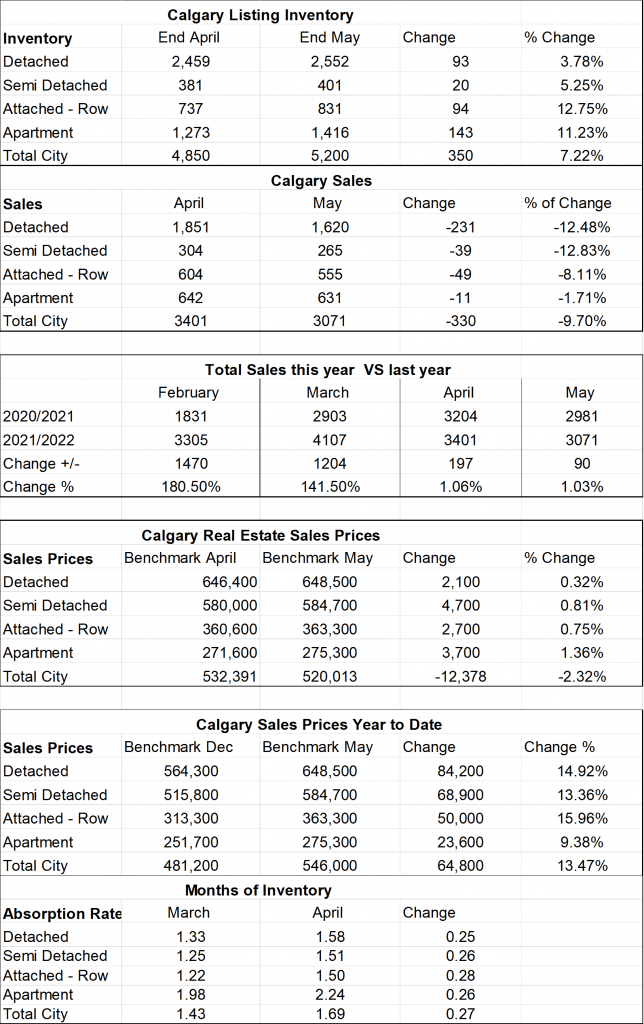
Below is a summary of numbers in chart form.  All numbers are taken from the Calgary Real Estate Boards monthly Stats package.
Just Listed 519, 20 Discovery Ridge Close SW

July 8th, 2021

Just listed this stunning apartment in the Wedgewoods.  View of Griffith Woods reserve area from all major rooms.

MLS: A1127878

Virtual Tour: https://youtu.be/3Ry272m6Qmg

Full Detailed Listing: https://www.tswrealestategroup.com/for-sale/519-20-discovery-ridge-close-sw–64948003

519, 20 Discovery Ridge Close


Beautiful Penthouse Suite facing the Griffith Woods Reserve area providing you with stunning views from all major rooms and access to many hiking trails.  This bright unit features new paint and hardwood floors throughout the living room and kitchen.  The living room features a wall of windows providing plenty of natural light and stunning views along with 9-foot ceilings and a gas fireplace with a stone front.  The Kitchen features Stainless steel appliances, maple cabinets, and a breakfast bar with an adjoining dining area.  Master Bedroom is spacious and features stunning forest views, a walk-in closet, and a 4-piece Ensuite. Complete the unit with the spacious second bedroom (again with forest views), a 3-piece bath, and a storage room with in-suite laundry. Features Titled underground parking with a full storage cage. Enjoy all the amenities including the gym and social room. Discovery Ridge Community association provides the playground, Soccer fields, basketball court, tennis courts, and skating rink.  Essential shopping is within the community and only 10 minutes to West Hills Shopping Centre.  Soon the ring road will be complete increasing accessibility to everything.  This unit is a must-see!

July 1, 2021 Calgary Real Estate Market Snapshot

July 2nd, 2021


What is really happening in the Calgary Real Estate Market?

The market is a result of Supply and Demand therefore we look at both Supply (inventory) and Demand (Sales) and the relationship between the two.  We also update you on the current benchmark price for all housing sectors.

Following is a graph that shows the months of inventory for each housing sector.  Looking at a 2-year trendline gives you an indication of where things are really heading.

Graph shows the 2 month trend of months of inventory for all sectors in the Calgary Real Estate Market.


Gord’s commentary for the month (just my opinion).

Another solid month in the Calgary Real Estate Market showing the highest number of sales in June on record. Although sales have declined the market is still favoring Sellers or balanced except for the Apartment Condo sector.

The booming market has already brought out sellers who are fishing for huge dollars, yes there are more than a normal number of homes listed substantially above what the market will bear.  This is what is going to cause the inventory to increase and balance out the market.  Buyers be aware when shopping.

I have also noticed a decline in the intensity of buyers to compete on offers, there are still competing offers happening everywhere but the amount that buyers are going above list price is in my opinion shrinking.


Calgary Listing Inventory

Our listing inventory increased by 136 through June.  As of today, we are 2.01% higher than currently a month ago.


Calgary Sales:

Sales in June decreased by 74 or 2.48%

What is interesting here is that sales declined by 4.8% in Detached homes and 13.5% in Semi-Detached homes while sales in the Apartment sector increased by 16.6%

What is likely driving this is with the price increases some people may have moved into the Apartment Condo sector.


Sales Compared to 2020:

Normally this is a good category to watch however we are now comparing sales this year to when we were

in a collapsed market due to Covid and the First Shutdown.  As you can see sales in June were 65.3% higher

than in June 2020.


  Jan Feb Mar Apr May June
2020 861 1190 1175 573 1080 1763
2021 1208 1836 2903 3209 2989 2915
Change +347 +646 +1729 +2639 1,911 1,152
% Change +7.49 +54.4 247% +562% 277.3% 65.3%


  July Aug Sept Oct Nov Dec
2020 1835 80 1702 1764 1437 1199
2021            
Change            
% Change            


 Calgary Real Estate Benchmark Sales Prices:

Overall, the benchmark price in Calgary increased again in June by $3,100.

The highest gains were in Detached homes at +$3,900 and the lowest gains we $400 in the Apartment sector which makes total sense based on Months of Inventory.


Current Months of Inventory (Absorption Rate): 

With a slight increase in Inventory and a slight decrease in sales, all sectors (except apartment Condos) increased our months of Inventory slightly.  Apartment condos months of Inventory went from 5.18 to 4.44 the largest decrease is quite some time as apartment condos have been struggling since 2015.

Buyers Markets include Apartment Condos.

Balanced Markers include Attached Row homes and Semi-Detached sectors.

Sellers Markets include just Detached Homes.


It is also important to note that these numbers vary by community, and by price range.  If you would like numbers for your community, or more specific numbers for your home please contact us.

Below is a summary of numbers in chart form.  All numbers are taken from the Calgary Real Estate Boards monthly Stats package.

This photo shows key stats that are taken from the stats package produces by the Calgary Real Estate Board.

June 1, 2021 Calgary Real Estate Market Snapshot

June 1st, 2021

What is really happening in the Calgary Real Estate Market?

The market is a result of Supply and Demand therefore we look at both Supply (inventory) and Demand (Sales) and the relationship between the two.  We also update you on the current benchmark price for all housing sectors.

Following is a graph that shows the months of inventory for each housing sector.  Looking at a 2-year trendline gives you an indication of where things are really heading.

2 year trend – Months of Inventory


Gord’s commentary for the month (just my opinion).

Another huge month for Calgary Real Estate although Change is on the way again.

“Buyers Beware” The booming market has already brought out sellers who are fishing for huge dollars, yes there are more than a normal number of homes listed substantially above what the market will bear.


Calgary Listing Inventory

Listing inventory in Calgary increased in every sector with the largest increase in the Detached Sector at 15%.  The lowest increase was in Semi-Detached homes at 3.92. The overall market increased by 11.73%

Calgary Sales:

Sales in all sectors are booming although we are seeing signs of a slight slowdown across all sectors. The largest decrease was in Apartment condos at 13.86% decline, the lowest decline in sales was Attached-Row homes at 1.42% Overall decline in sales was 6.86% from April highs.

I do not for a minute believe the demand has gone down, what I believe is causing the decline is the availability of homes.

 Sales Compared to 2020:

Normally this is a good category to watch however we are now comparing sales this year to when we were

in a collapsed market due to Covid and the First Shutdown.


  Jan Feb Mar Apr May June
2020 861 1190 1175 573 1080
2021 1208 1836 2903 3209 2989
Change +347 +646 +1729 +2639 1,911
% Change +7.49 +54.4 247% +562% 277.3%


  July Aug Sept Oct Nov Dec
2020 1835 80 1702 1764 1437 1199
2021            
Change            
% Change            


 Calgary Real Estate Benchmark Sales Prices:

Overall, the benchmark price in Calgary increased again in May by $3,800.

The largest gain was in Semi-Detached at $5,700 Detached homes at $4,200, Attached Row at $3,000, and Apartment Condos at $700.


Current Months of Inventory (Absorption Rate): 

With the increases in inventory and the reduction in sales our Months of Inventory is starting to rise again.  Still positioned in a Seller’s market are Detached and Semi-Detached homes.  Attached Row homes just came out of the seller’s market to a balanced market position.  Apartment condos are still sitting at 5.18 Months of inventory so very much in a buyer’s market.

It is also important to note that these numbers vary by community, and by price range.  If you would like numbers for your community, or more specific numbers for your home please contact us.

Below is a summary of numbers in chart form.  All numbers are taken from the Calgary Real Estate Boards monthly Stats package.


Data taken from the Calgary Real Estate Boards Monthly Stats Package.

Just Listed – 234 Edgedale Gardens NW Calgary

May 20th, 2021

Just listed a beautiful Townhouse in Edgemont.

MLS: A1110344

See full listing here: https://www.tswrealestategroup.com/for-sale/234-edgedale-gardens-nw–63381765


Welcome to Edgedale Gardens, a hidden gem in Edgemont. Beautiful, substantially updated 2 Storey Townhouse with 1408 sq ft. features a fully developed basement and a double attached garage. This unique open layout has character and offers high vaulted ceilings, hardwood floors, and fresh paint throughout the main floor. Home shows 10/10 and is move-in-ready.  The living room features vaulted ceilings creating an open feeling, large south-facing windows providing plenty of natural light, a wood-burning fireplace, and an elegant built-in wall unit with hardwired 5.1 surround sound and Ethernet.  The spacious kitchen is open to the Dining room and was updated a few years back with new cabinets, granite countertops, backsplash, lighting, and new appliances. Complete the main floor with an updated 2-piece powder room. Upstairs features a loft hallway that overlooks the living and dining room spaces.  The spacious Primary Bedroom features a spa-like updated 4-piece ensuite and a walk-in closet.  Complete the upstairs with 2 additional spacious bedrooms and the main updated bathroom.   Downstairs is one large recreation room that is currently divided into a family gathering room, exercise room, and an office. Plenty of space to create your own comfort. Complete the basement with a separate laundry room. The basement is also hardwired for 7.1 Surround and Ethernet.   Enjoy your south-facing deck with lots of trees for privacy. Home is in the desired community of Edgemont and is close to paths, Nose Hill Park, schools, superstore, and shopping.  Just a short drive to Dalhousie LRT, U of C, Foothills Medical Centre, and the Alberta Children’s Hospital. The complex is pet-friendly.

Just Listed 31 Somerset Drive SW

May 15th, 2021

Just Listed 

Check out this 1351 Sq Ft Bungalow that is located across from a park in Somerset.

MLS:  A1108070

Video Tour:  https://youtu.be/waVhITI4VW4

Price: $440,000

Full listing details:  https://www.tswrealestategroup.com/for-sale/31-somerset-drive-sw–63279744

Bright freshly painted bungalow situated on a corner lot across the street from Somerset Park. This 1351 sq Foot Bungalow has been substantially renovated and feature’s hardwood floors and soaring vaulted ceilings throughout.  The kitchen features views of the park, a  pantry, and has been updated with quartz countertops,   and new  Stainless-Steel appliances. Enter the living room – dining room and you will love the vaulted ceilings, on cooler nights relax by the fireplace.   On warmer days soak up the sun on your massive southwest-facing deck (15’ x 11’) where you have fantastic views of the park.   The primary bedroom features double closets and a newly renovated 5-piece ensuite. Complete the main floor with a second bedroom, main floor laundry, and the newly renovated main bath.  Downstairs is untouched and awaits your personal touches and has roughed in plumbing for a bathroom. Also features a double attached garage and vacuum system. Outstanding location across the street from the park, 3 minutes to the LRT, close to Daycare,  Shopping center, Walmart, and only a few minutes to Fish Creek Park.

Coming Soon Listings

May 4th, 2021

Should you use coming soon to market your listing? 

Here is what you need to know!

Now that Calgary has moved into a very strong Sellers’ market we are seeing “Coming Soon” listings everywhere. A coming soon listing advertises your listing prior to it going live on the MLS System for the public to view.

Here is my opinion on Coming Soon Listings.

From a Sellers Perspective:  

As a Seller, you want to maximize the exposure to your listing so coming soon is certainly a smart way to do that,  but hold on.  What I am seeing in the marketplace is coming soon listings are being marketed with a sign on your lawn, on Social Media, and most importantly through interoffice communication.  Here is where the problem starts.  Most activity is being created through internal office communication.  The buyer’s Realtor always wants to get in before the general public and so a showing is arranged, often that buyer writes a strong offer and the Seller accepts the offer as it’s a quick sale.  So, looking at this process, how much exposure did this listing get – 1 showing, yes almost no exposure.  Will the seller get top dollar using this strategy – most likely not.

Using Coming Soon to your advantage:  Again in my opinion using “Coming Soon” is a fantastic marketing tool and should be used.  It should be used to attract attention and get people excited about viewing your home.  The key to doing this effectively is to collect names of people interested and let them know the minute it goes on the market, while still giving the general public the opportunity to view your home before you accept any offers.  This will maximize the exposure to your listing and get you top dollar for your home.

A Buyer’s Perspective:  If you are buying a home then use the “Coming Soon” listings to your advantage, if you can get in before everyone else you will not only get your home but you may not have to compete with several other buyers. A word of caution,  make sure your Realtor does a comparative market analysis on the property so you don’t get too excited about a home that is substantially overpriced.

If you are considering Selling, reach out to us for a free consultation


April 2021 Calgary Real Estate Market Snapshot.

May 3rd, 2021

What is really happening in the Calgary Real Estate Market? 

The market is a result of Supply and Demand therefore we look at both Supply (inventory) and Demand (Sales) and the relationship between the two.  We also update you on the current benchmark price for all housing sectors.

Following is a graph that shows the months of inventory for each housing sector.  Looking at a 2-year trendline gives you an indication of where things are really heading.

The graph shows the 2-year trend of the number of months of Inventory for all housing sectors within the Calgary Real Estate Market.

The graph shows the 2-year trend of the number of months of Inventory for all housing sectors within the Calgary Real Estate Market.

Gord’s commentary for the month (just my opinion).


Wow, another huge month for Real Estate in Calgary. In addition to Detached homes being in a seller’s market position, Semi-Detached and Attached Rowhouses have joined that category leaving only Apartment condos in the balanced market territory.


Calgary Listing Inventory

In April we saw the inventory for homes in all sectors increase by approx. 12%

The number of new listings in April was 4670 compared to 4441 for March so a 5% increase.

It seems that most of the new listings are still immediately turning in sales.


Calgary Sales:

Calgary Sales are soaring.  Detached homes and Semi-Detached homes hit a record high in April.

Every category increased between 9.65%-14.3% over last month.  The only thing holding our sales from going higher seems to be the low inventory.


Sales Compared to 2020:

Normally this is a good category to watch however we are now comparing sales this year to when we were

in a collapsed market due to Covid and the First Shutdown.


  Jan Feb Mar Apr May June July Aug Sept Oct Nov Dec
2020 861 1190 1175 573 1080 1747 1835 80 1702 1764 1437 1199
2021 1208 1836 2903 3209                
Change +347 +646 +1729 +2639                
% change +7.49 +54.4 247% +562%                


Calgary Real Estate Benchmark Sales Prices:

Overall, the Benchmark Price for all sectors increased by $9,500.  The smallest increase was in the Apartment condo sector at $1,900 and the largest increase was in the detached home sector which increased by $12,800.  All other sectors were in between.  Interesting how the sectors with the lowest months of inventory are showing the highest price increases.  Truly supply and demand in at play here.


Current Months of Inventory (Absorption Rate): 

There was very little change in the Months of Inventory during April.   Detached and Semi-Detached decreased by .07 and .14 respectively.  Attached Row and Apartment Condos increased by .06 and .27 respectively.  With the months of Inventory where they are, I can only predict that prices will continue to increase with possibly the exception of Apartment Condos.


It is also important to note that these numbers vary by community, and by price range.  If you would like numbers for your community, or more specific numbers for your home please contact us.

Below is a summary of numbers in chart form.  All numbers are taken from the Calgary Real Estate Boards monthly Stats package.

Stats Photo