Posts Tagged ‘2026’

Calgary Real Estate Market Snapshot for Oct 1, 2026

Tuesday, October 6th, 2026

What is really happening in the Calgary Real Estate Market?

The following graph shows the months of inventory for each housing sector. Looking at a one-year trendline gives you an indication of where things are really heading.
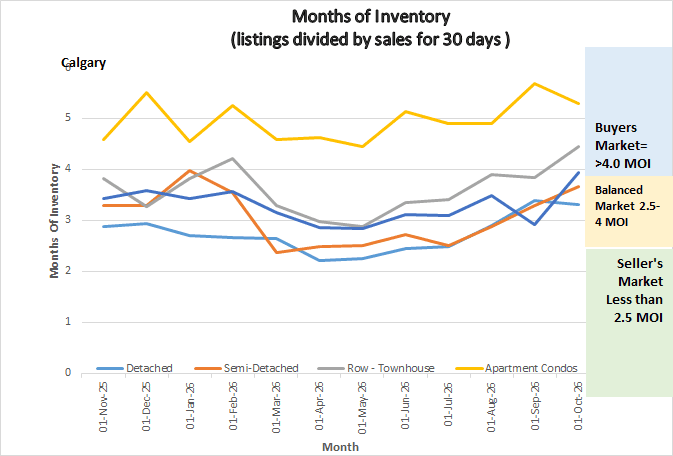
Graph shows the months of inventory for all sectors in the Calgary Real Estate Market

Graph shows the months of inventory for all sectors in the Calgary Real Estate Market


Gord’s commentary for the month (just my opinion).

August Highlights

  • Apartment Condo months of inventory decreased through September
  • Sales and listing inventory remained flat
  • Overall price declined by $3,100 or .54%


Calgary Listing Inventory

Inventory declined over all sectors but only by 23 listings so essentially flat.

 Calgary Sales

Sales over all sectors declined by 10 Sales so again essentially flat.  I will say however that every month from now till December the trend is for sales to decline so having them remain flat in September is showing a strong sign.


Sales Compared to 2025: 

As you can see sales in September of 2026 compared to 2025 Sales are lower by 3.9%. This looks like a bounce back from the 16.4% sales decline reported last month.  I believe there is still uncertainty in the world that is holding our sales back somewhat.


  April   May   June July August Sept
2025 2230 2559 2284 2096 1986 1716
2026 2104 2162 2197 1904 1660 1650
Change -126 -397 -87 -192 -326 -66
% Change -9.4 -18.4% -3.8% -9.1% -16.4% -3.9%


Calgary Real Estate Benchmark Sales Prices:

The overall Benchmark price decreased by $3,100 in September. All sectors showed a small decline this month.


Current Months of Inventory (Absorption Rate): 

The overall months of Inventory increased by only .01

The Attached Row and Semi-detached sectors both increased while the Detached home and Apartment condo sectors both saw a slight decline in the months of inventory.


My Prediction for what is ahead:

From here to the end of the year, we will see a decrease in the number of listings and a decrease in sales. This is a trend that happens every year as winter approaches. The Market is very likely to remain divided where Detached and Semi-detached homes remaining stable, and Apartment Condos and Townhouses will still struggle in a buyer’s market position.


* All numbers vary by community and price ranges, if you would like stats specifically for your neighbourhood, please contact us.


*Below is a summary of numbers in chart form. All numbers are taken from the Calgary Real Estate Boards monthly Stats package.
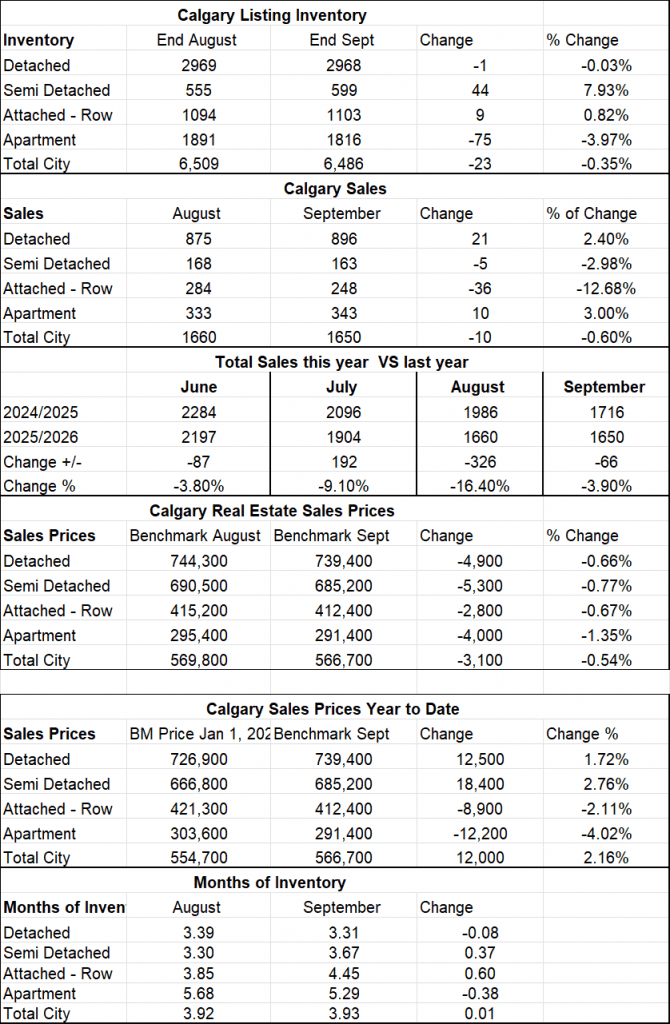
Summary of the Calgary Real Estate Board Realtors Stats

Summary of the Calgary Real Estate Board Realtors Stats

Calgary Real Estate market Snapshot for Sept 1, 2026

Tuesday, September 1st, 2026

What is really happening in the Calgary Real Estate Market?

The following graph shows the months of inventory for each housing sector. Looking at a one-year trendline gives you an indication of where things are really heading.


Gord’s commentary for the month (just my opinion).

August Highlights

  • Apartment Condo Segment continues to soften.
  • Both sales and listing inventory declined
  • Sales in the $1,000,000 recorded gains over last year

Calgary Listing Inventory

Inventory declined over all sectors but only by 117 listings or 1.77% – a normal occurrence for this time of year.

Calgary Sales

Sales over all sectors declined by 244 sales or 12.82% Over half of that was in the detached sector along with the Apartment Condo sector.

Sales Compared to 2025: 

As you can see sales in 2026 compared to 2025 are lower by 16.4%. This is a little larger number than last month but consistent for the year. Bottom line is Sales have slowed compared to 2025.  Why you ask, as usual there can be many reasons but the one that is having the largest effect is the unpredictable political environment – yes, the USA.


  March  April   May   June July August
2025 2156 2230 2559 2284 2096 1986
2026 1881 2104 2162 2197 1904 1660
Change -275 -126 -397 -87 -192 -326
% Change -12.8 -9.4 -18.4% -3.8% -9.1% -16.4%


Calgary Real Estate Benchmark Sales Prices:

The overall Benchmark price decreased by only $600. The attached row and Apartment Condo sectors took most of the decreases of $3300 and $2,200, respectively.

Current Months of Inventory (Absorption Rate): 

The overall months of Inventory increased by .44 which is a sizable increase.  Looking at above the inventory decreased by only 1.7% while sales decreased by 12.82%. Of special note here the Apartment condominium sector increased by .78 (see graph at the top) a big jump.

My Prediction for what is ahead:

From here to the end of the year, we will see a decrease in the number of listings and a decrease in sales. This is a trend that happens every year as the summer progresses into fall and winter. The Market is very likely to remain divided where Detached and Semi-detached homes remaining stable, and Apartment Condos and Townhouses will still struggle in a buyer’s market position.


* All numbers vary by community and price ranges, if you would like stats specifically for your neighbourhood, please contact us.

*Below is a summary of numbers in chart form. All numbers are taken from the Calgary Real Estate Boards monthly Stats package.

Summary of the Calgary Real Estate Board Realtors Stats