What is Really Happening in the Calgary Real Estate Market?
Stay ahead of everyone else by following our Monthly Market Snapshot of the Calgary Real Estate Market This shows what’s really happening! The market is driven by supply and demand so here we show the inventory (supply) and sales (demand) and most importantly the relationship between the two and how it affects the price of Calgary Real Estate. A simple way to keep up to date with how the market is trending and to stay ahead of most! All numbers are taken from the Calgary Real Estate Boards Stats package for Realtors. I have also included some general comments which are simply my opinion.
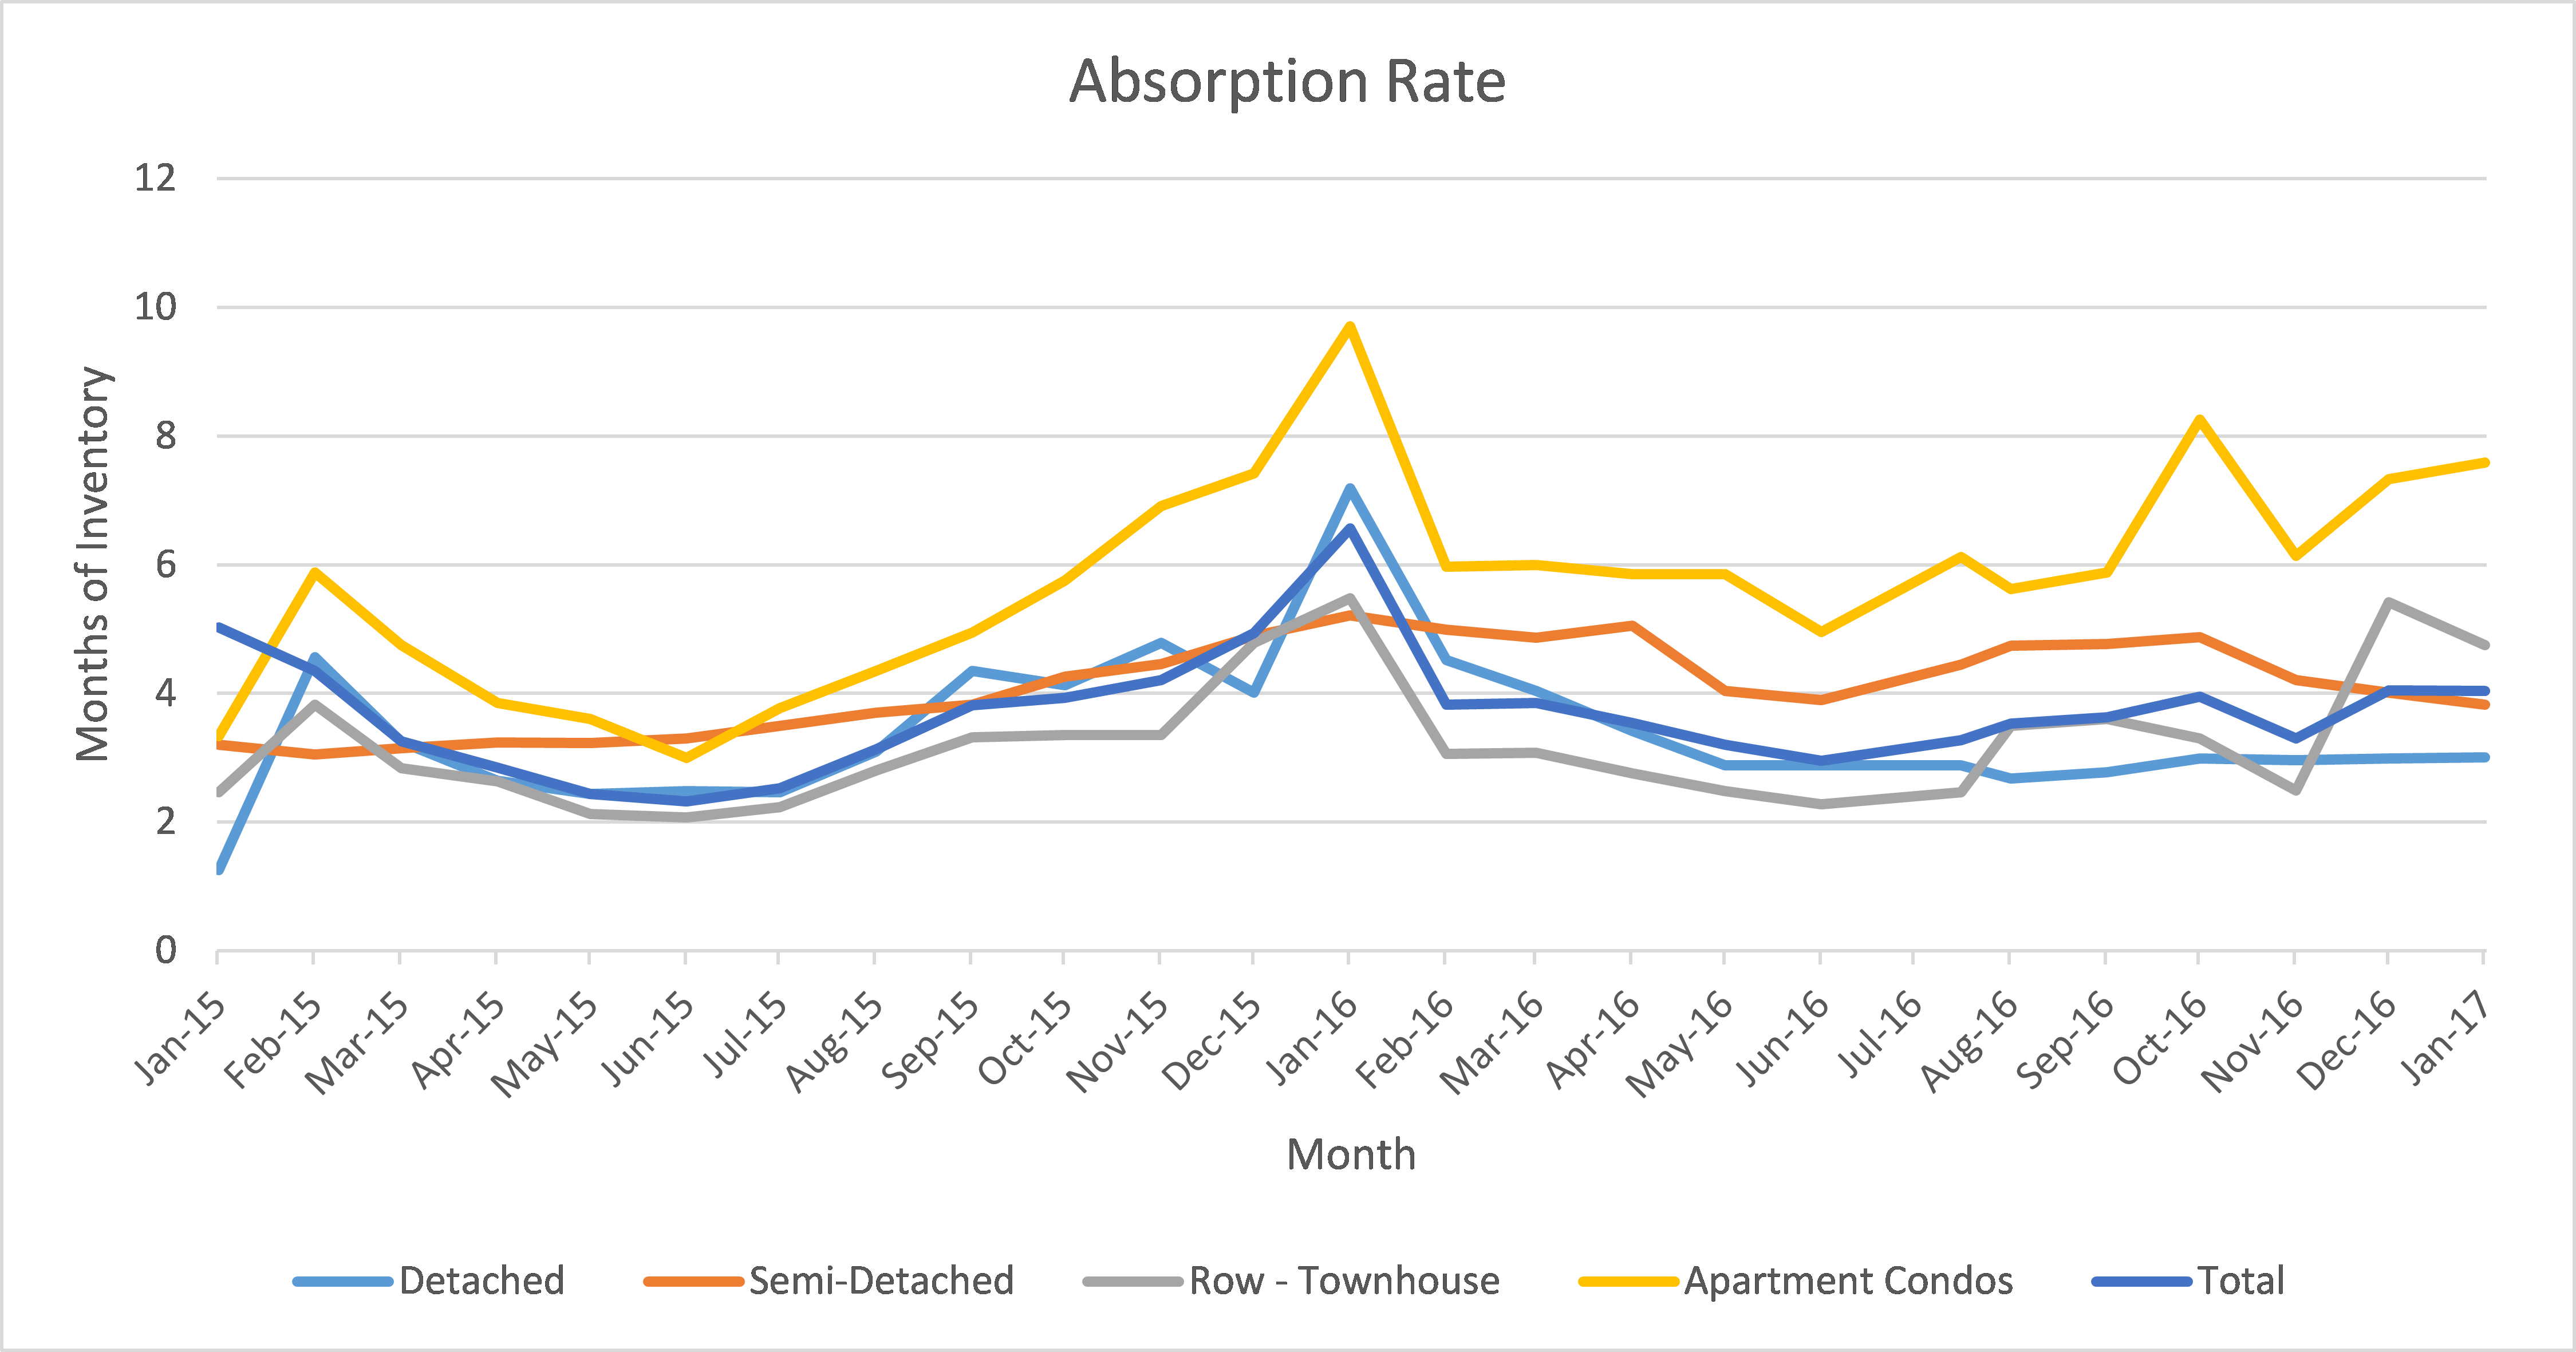
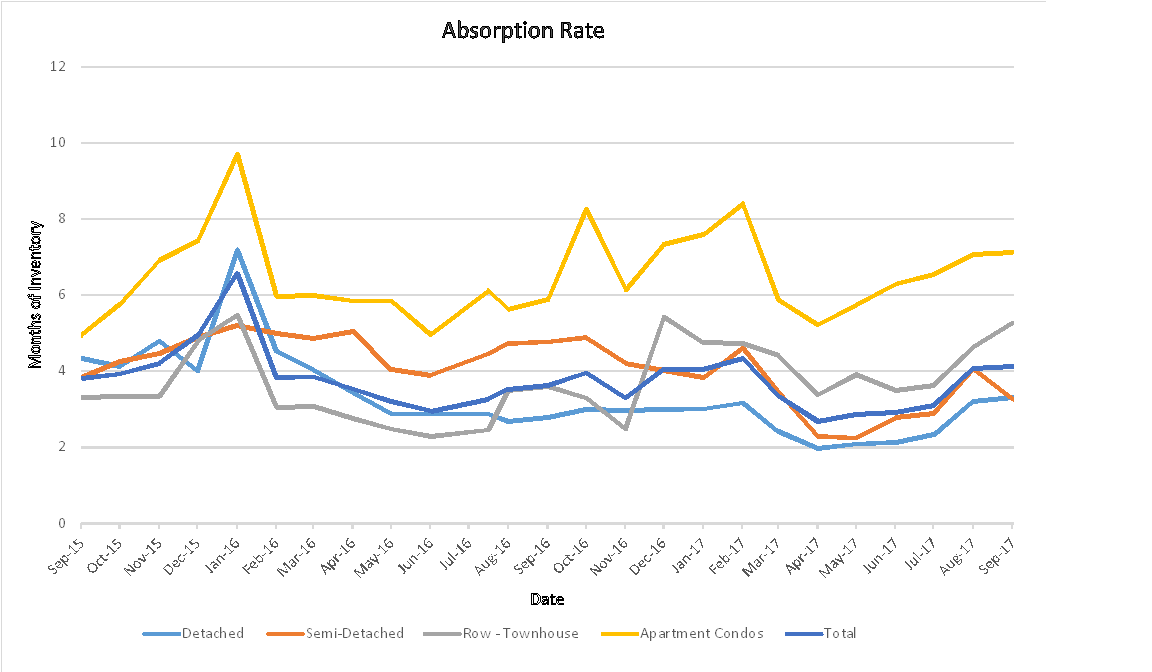
Absorption Rate (Months of Inventory) (the inventory divided by the number of sales in the last month). What does this mean you might ask?
| Buyer’s Market | >4.0 | Drives prices down |
| Balanced Market | Between 2.4 to 4.0 | Prices typically remain stable |
| Seller’s Market | <2.4 | Drives prices up |
Current Absorption Rate
The Absorption rate for August showed a very slight increase for detached homes, and Apartment condos. Attached (Row) houses showed a larger increase of .64 while Semi-detached (Duplexes) showed a substantial decrease of .79.
| July 2017 | Aug 2017 | Change | |
| Detached | 3.21 | 3.32 | 0.11 |
| Semi Detached | 4.05 | 3.27 | -0.79 |
| Attached – Row | 4.63 | 5.27 | 0.64 |
| Apartment | 7.07 | 7.13 | 0.06 |
| Total City | 4.08 | 4.13 | 0.06 |
Calgary Listing Inventory
In August we saw most categories stay almost the same. The one exception is Apartment Condos and they decreased by 41 listings. I believe the reason for this is listings expiring and not a sales increase.
| Inventory | July 2017 | Aug 2017 | Change |
| Detached | 3268 | 3280 | 12 |
| Semi Detached | 596 | 585 | -11 |
| Attached – Row | 1001 | 991 | -10 |
| Apartment | 1810 | 1769 | -41 |
| Total City | 6675 | 6624 | -51 |
Calgary Sales:
August sales remained very consistent to July’s numbers with all being within 35 either way.
| Calgary Sales | July 2017 | Aug 2017 | Change | % Change |
| Detached | 1018 | 987 | -31 | -3.05% |
| Semi Detached | 147 | 179 | 32 | 21.77% |
| Attached – Row | 216 | 188 | -28 | -12.96% |
| Apartment | 256 | 248 | -8 | -3.13% |
| Total City | 1637 | 1602 | -35 | -2.14% |
Calgary Real Estate Sales Prices:
Interestingly enough all categories except Row houses (townhouses) took a small drop this month.
The largest decrease was in apartment condos and my opinion is that due to the high absorption rate this will continue for some time.
| Sales Prices | July 2017 Benchmark Price | Aug 2017 Benchmark Price | Change |
| Detached | 512,100 | 510,900 | -1,200 |
| Semi Detached | 420,800 | 419,600 | -1,200 |
| Attached – Row | 306,700 | 307,000 | 300 |
| Apartment | 266,200 | 263,300 | -2,900 |
| Total City | 443,600 | 442,300 | -1,300 |
Sales Prices “Year to Date”
| Sales Prices | Jan 1, 2017 Benchmark Price | Aug 2017 Benchmark Price | Change
$ |
% Change |
| Detached | 498,700 | 510,900 | 12,200 | 2.45% |
| Semi Detached | 406,800 | 419,600 | 12,800 | 3.15% |
| Attached – Row | 302,600 | 307,000 | 4,400 | 1.45% |
| Apartment | 265,000 | 263,300 | -1,700 | -0.64% |
| Total City | 433,400 | 442,300 | 8,900 | 2.05% |
**Please note that these numbers include only Calgary homes and change on a community basis and more so for towns. This report does not include rural properties. If you would like to find stats on your community just let me know. If you have any questions about this summary or Real Estate questions please feel free to contact us.