Posts Tagged ‘calgary market’

Calgary Real Estate Market Snapshot

Tuesday, July 3rd, 2018

What is really happening in the Calgary Real Estate Market?

Calgary Real Estate Absorption Rate

Calgary Real Estate Absorption Rate

Calgary Real Estate Absorption Rate

Stay ahead of everyone else by following our Monthly Market Snapshot of the Calgary Real Estate Market. This shows what’s really happening! The market is driven by supply and demand so here we show the inventory (supply) and sales (demand) and most importantly the relationship between the two and how it affects the price of Calgary Real Estate.  A simple way to keep up to date with how the market is trending and to stay ahead of most! All numbers are taken from the Calgary Real Estate Boards Stats package for Realtors. I have also included some general comments which are simply my opinion.

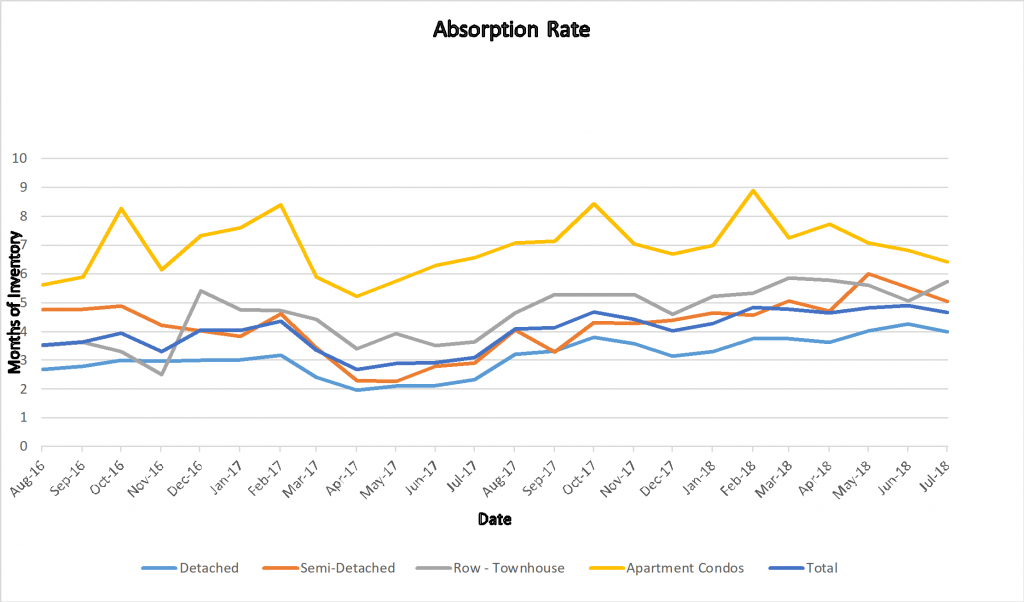
Absorption Rate (Months of Inventory) – the inventory divided by the number of sales in the last month). What does this mean you might ask?

Buyer’s Market >4.0 Drives prices down
Balanced Market Between 2.4 to 4.0 Prices typically remain stable
Seller’s Market <2.4 Drives prices up


Watch the Trend

On the above graph it is important to see the trends – Especially the apartment condo absorption rate- it  is trending downward and is closing the gap with the rest of the sectors.

 Current Absorption Rate

The absorption rate for all categories except Attached-Row houses declined this month which in my opinion is a good thing as it shows a little more balance in the market.

End of May 2018    June 2018    Change
Detached 4.26 3.98 -0.28
Semi Detached 5.53 5.04 -0.49
Attached – Row 5.06 5.73 0.67
Apartment 6.81 6.41 -0.40
Total City 4.90 4.65 -0.24


Calgary Listing Inventory

In June, our inventory increased in all sectors except apartment condos.  This is totally expected at this time of year.  July should be an interesting month as the typical July will see listings drop off.   The decrease in apartment condos I would contribute to listings expiring as sales were flat.


Inventory May 2018    June 2018    Change
  Detached 4504 4817 313
Semi Detached 862 922 60
Attached – Row 1163 1209 46
Apartment 1921 1872 -49
Total City 8450 8820 370


Calgary Sales:

Sales were again up in all categories except for Attached Row houses which were down only 19 from May. The percentage looks big at 8.26 due to small numbers in this sector.

Sales for June were 11% down from last year but this is again an improvement as May sales were down 18.4% from last year.

Calgary Sales  May 2018    June 2018    Change % Change
Detached 1058 1210 152 14.37%
Semi Detached 156 183 27 17.31%
Attached – Row 230 211 -19 -8.26%
Apartment 282 292 10 3.55%
Total City 1726 1896 170 9.85%


 Calgary Real Estate Sales Prices:

This one has me stumped.  In theory the sector with the highest absorption rate should have the biggest decline in price.  The opposite took place in June with every sector dropping a little except Apartment Condos which increased in price.

  Sales Prices May 2018   Benchmark Price   June 2018   Benchmark Price Change
Detached 504,500 503,100 -1,400
Semi Detached 419,000 418,000 -1,000
Attached – Row 303,200 302,300 -900
Apartment 256,200 259,100 2,900
Total City 436,900 436,500 -400


Sales Prices “Year to Date”  

Same as monthly number

Sales Prices Jan 1, 2018    Benchmark Price  June 2018   Benchmark Price Change

$

% Change
Detached 499,600 503,100 3,500 0.70%
Semi Detached 416,600 418,000 1,400 0.34%
Attached – Row 299,500 302,300 2,800 0.93%
Apartment 257,700 259,100 1,400 0.54%
Total City 433,200 436,500 3,300 0.76%


**Please note that these numbers include only Calgary homes and do change on a community basis and more so for towns.  This report does not include rural properties.  If you would like to find stats on your community just let me know.  If you have any questions about this summary or about Real Estate in general, please feel free to contact us.
Calgary Real Estate Market Snapshot Sept 2014

Friday, October 3rd, 2014

Stay ahead of the curve by following our Monthly Market Snapshot of the Calgary Real Estate Market.  This shows what’s really happening in the Calgary Real Estate Market.  The market is driven by supply and demand so here we show the inventory (supply) and sales (demand) and the effect on the price of Calgary Real Estate.   A simple way to keep up to date and ahead of most!  The Calgary housing market is deeply  entrenched is a Sellers Market however is slowly changing and is moving toward a balanced market.

Below are the details along with a few comments, all numbers were taken  from the Calgary Real Estate Boards Stats package for Realtors.

Want to see stats specific to your Community?  Register for our Market Report at http://www.calgaryareasolds.com/


Calgary Listing Inventory: Inventory levels for Single Family homes decreased while everything else increased this month. Typically this time of year we show increases in inventory. Single family home inventory went down which is not normal. I believe the reason is that we still have a large backlog of buyers waiting for the perfect home to come on the market, especially in the starter home price range.


Inventory Aug 2014 Sept 2014     Change
Single Family Home 3021 2961 -60
Condo Townhouse 437 552 +115
Condo Apartment 1056 1081 +25
Total 4514 4594 +80


Calgary Sales:

Sales in September decreased marginally in all categories. Sales numbers decreasing is very normal at this time of year.  It is critical to note that even though the sales are decreasing we are still substantially above our sales for 2013.

Sales Aug 2014 Sept 2014     Change % Change
Single Family Home 1477 1398 -79 -5.3
Condo Townhouse 338 318 -20 -5.9
Condo Apartment 452 432 -20 -4.4
Total 2267 2148 -119 -5.2


Calgary Real Estate Sales Prices:

In September, the benchmark price increased for all categories. Based on the inventory change, prices are likely to increase moderately for a few more months as we move from a seller’s market to a more balanced market. If you have been following my reports you will notice the increases are continuing to get smaller every month.

Sales Prices Aug 2014 Benchmark Price Sept   2014   Benchmark Price Change
Single Family Homes 512,300 512,800 +500
Condo Townhouse 328,300 330,200 +1900
Condo Apartment 298,200 298,800 +600


Sales Prices “Year to Date”

Year to date prices – Prices have increased in all categories. Good news if you are a homeowner.

Sales Prices Dec 31 2013 Benchmark Price Sept 2014 Benchmark Price Change$ % Change
Single Family Homes 472,200 512,800 +40,600 +8.6
Condo Townhouse 307,100 330,200 +23,100 +7.5
Condo Apartment 278,600 298,800 +20,200 +7.3


Absorption Rate (Months of Inventory)  (the inventory divided by the number of sales in the last month). What does this mean you might ask?

Buyer’s Market >4.0
Balanced Market Between 2.8 to 4.0
Seller’s Market <2.8


Absorption Rate:

This month the absorption rate increased in all categories. For Single Family homes the ratio went up even though our inventory decreased – this is because sales decreased more. Condo Townhouses took the largest jump of .45, I believe this is just catching up as last month it went opposite of everything else.

Absorption Rate Aug 2014 Sept 2014   Change
Single Family Homes 2.05 2.11 +.06
Condo Townhouse 1.29 1.74 +.45
Condo Apartment 2.33 2.50 +.17
Total Calgary 1.99 2.14 +.15


**Please note that these numbers do change on a community basis and more so for towns. If you would like to find stats on your community just let me know. If you have any questions about this summary, the attached stats package or any Real Estate questions please feel free to contact us.


If you know anyone else who might enjoy seeing our monthly summary please feel free to share

July 2014, Calgary Real Estate Market Snapshot

Monday, August 4th, 2014

Stay ahead of the curve by following our Monthly Market Snapshot of the Calgary Real Estate Market.  This shows what’s really happening in the Calgary Real Estate Market.  The market is driven by supply and demand so here we show the inventory (supply) and sales (demand) and the effect on the price of Calgary Real Estate.   A simple way to keep up to date and ahead of most!  The Calgary housing market is deeply  entrenched is a Sellers Market with very little supply and strong demand.  In July we started seeing a slight shift towards a buyers market but we have a long way to go.

Below are the details along with a few comments, all numbers were taken  from the Calgary Real Estate Boards Stats package for Realtors.

Want to see stats specific to your Community?  Register for our Market Report at http://www.calgaryareasolds.com/


Calgary Listing Inventory: Inventory levels decreased for single family homes and stayed flat for townhouses and condos. Normally our inventory would show a much higher increase in July. I speculate the reason is that we still have a large backlog of buyers waiting for the perfect home to come on the market. I am surprised that the levels did not increase more than they did.

Inventory June 2014 July 2014 Change
Single Family Home 3128 3056 -72
Condo Townhouse 523 536 +13
Condo Apartment 1071 1070 -1
Total 4722 4662 -60


Calgary Sales:

Sales in July decreased in all categories. Sales numbers decreasing is very normal at this time as people start to go on summer vacations and the city shuts down for the Stampede. No surprises here.

Sales June 2014     July 2014 Change % Change
Single Family Home 1769 1553 -216 -12.2
Condo Townhouse 427 339 -88 -20.6
Condo Apartment 474 444 -30 -6.3
Total 2670 2336 -334 -12.5


Calgary Real Estate Sales Prices:

In June, the benchmark price increased for all categories. Based on the inventory change, prices are likely to increase for a few more months as we move from a seller’s market to a more balanced market. If you have been following my reports monthly the increase is smaller than what we have been seeing.

Sales Prices June 2014     Benchmark Price July 2014

Benchmark Price

Change
Single Family Homes 509,700 511,600 +1900
Condo Townhouse 326,000 327,000 +1,000
Condo Apartment 299,700 298,100 -1,600


Sales Prices “Year to Date”

Year to date prices – same as above, Prices have increased in all categories. Good news if you are a homeowner.

Sales Prices Dec 31 2013 Benchmark Price July 2014     Benchmark Price Change

$

% Change
Single Family Homes 472,200 511,600 +39,400 +8.3
Condo Townhouse 307,100 327,000 +19,900 +6.5
Condo Apartment 278,600 298,100 +19,500 +7.00


Absorption Rate (Months of Inventory)  (the inventory divided by the number of sales in the last month). What does this mean you might ask?

Buyer’s Market >4.0
Balanced Market Between 2.8 to 4.0
Seller’s Market <2.8


Absorption Rate: For the fourth month in a row our absorption rate has increased. This indicates that the market is changing and we are moving towards a balanced market with apartment condos leading the way. Please note that we are so deep in a Seller’s market that it will take us a few more months of this trend to reach a balanced market. My prediction is that this trend will continue and by September or October we will be approaching a balanced market – sooner for apartment condos.

Absorption Rate June 2014   July 2014   Change
Single Family Homes 1.77 1.97 +.2
Condo Townhouse 1.22 1.58 +.36
Condo Apartment 2.26 2.40 +.14
Total Calgary 1.77 1.99 +.22

**Please note that these numbers do change on a community basis and more so for towns. If you would like to find stats on your community just let me know. If you have any questions about this summary, the attached stats package or any Real Estate questions please feel free to contact us.


Snapshot of Calgary’s Real Estate Market for December 2012

Wednesday, January 2nd, 2013

Following is a short summary of what is happening in the Calgary Real Estate Market.   All data is taken from the December 2012 Calgary Real Estate Boards monthly Stats package for Realtors. you will also find my comments on each area. Overall the Calgary housing market slowed for the month of December which is very typical for the holiday season.   

Calgary Listing Inventory:  Inventory levels for all categories decreased again in November.  Seeing our inventory decrease is very normal at this time of year as most people like to wait until after Christmas and into spring to list their homes.  I believe that starting this week we will see inventory start to rise again.       

Inventory 

November  2012      

December  2012 

Change

Single Family Home

2586

1859

(727)

Condo    Townhouse  

426

310

(116)

Condo    Apartment 

819

553

(266)

Total

3831

2722

(1109)


Calgary Sales: 

Sales decreased in all categories this month although it’s important to point out that we still beat last year’s sales by 5.6%.   This is a very normal trend as people are focused on Christmas and put off their home buying until the New Year.  The key here is that although sales decreased by 25.6% the number of listings on the market decreased by 29.0% meaning the market is still very strong.         

Sales

Nov  2012

Dec 2012

Change

% Change

Single   Family Home

1006

745

(261)

(25.9%)

Condo  Townhouse    

198

119

(79)

(40.0%)

Condo   Apartment

253

219

(34)

(13.4%)

Total

1457

1083

(374)

(25.6%)


Calgary Real Estate Sales Prices:  Please note that we are now using the Benchmark price for this comparison.

As the chart below demonstrates the benchmark price for all categories increased this month again.  In my opinion this is a very healthy market with good activity level and prices showing modest increases. We are however starting to see competing offers in some situations mostly in inner city, single family homes and rental properties.   


Sales Prices

Nov  2012 Benchmark Price  

Dec  2012 Benchmark Price  

Change

Single   Family Homes

433600

434,800

+1,200

Condo   Townhouse  

282800

284,100

+1,300

Condo  Apartment    

248,000

248,700

+700.


As we are at the end of another year here are the YTD numbers

Sales Prices

Dec  2011  Benchmark Price  

Dec  2012 Benchmark Price  

Change

% Change

Single   Family Homes

399,900

434,800

+ 34,900

+8.7%

Condo   Townhouse  

272,700

284,100

+11,400

+4.2%

Condo  Apartment    

236,000

248,700

+12,700

+5.38%


Absorption Rate (Months of Inventory)   (the inventory divided by the number of sales in the last month). What does this mean you might ask?

Below 3.0 indicates a Seller’s Market

Between 3.0 to 4.0 indicates a Balanced Market

Above 4.0 indicates a Buyer’s Market.

Absorption Rate  

Nov 2012

Dec  2012

Change

Single   Family Homes

2.57

2.50

(.07)

Condo   Townhouse  

2.15

2.61

+ .46

Condo  Apartment    

3.24

2.53

(.71)

Total   Calgary

2.63

2.51

(.12)


As you can see above we are in a Seller’s market for all categories. Please note that these numbers do change on a community basis and more so for towns.  If you would like to find stats on your community please contact us.  

If you have any questions about this summary, the attached stats package or any Real Estate questions please feel free to contact us.  

If you know anyone else who might enjoy seeing our monthly summary please feel free to pass it on. 

Gord, Eric & Brent

CMHC’s Calgary Housing Market Outlook

Monday, November 5th, 2012

The Fall 2012 edition of CMHC”s Housing Market Outlook – Calgary is now available and can be accessed by clicking on the link below.

http://www.cmhc-schl.gc.ca/odpub/esub/64339/64339_2012_B02.pdf

This report show some great info on the Calgary Housing Market.  If you have any questions about Calgary Real Estate feel free to contact me.


Calgary Housing Market August 2012

Monday, September 3rd, 2012

We have included a snapshot of what is happening in the Calgary Real Estate Market.  Below you will find a summary of some key areas including inventory, sales numbers and of course prices.  We have taken the information directly from the Stats package from The Calgary Real Estate Board .  Overall the Calgary housing market has slowed but is still in good shape and we are still exceeding last years sales.

Calgary Listing Inventory:  Inventory levels for all categories decreased slightly again in August.  Last year this was the time when our inventory started increasing rapidly so seeing a slight decline is a good sign and shows  stability in the Calgary market.

Inventory 

July  2012 

Aug  2012 

Change

Single   Family Home

3646

3535

-111

Condo  Townhouse    

623

584

-39

Condo  Apartment   

1161

1065

-96

Total  

5390

5184

-206


Calgary Residential Sales: 

Sales decreased in Single family homes but increased a little in townhouses and apartment style condos.    In my opinion this was expected and is more of a seasonal adjustment as we are following the same trend as last year when our sales peaked in June.  The other reason I see for the decrease in Single Family homes is some of my clients are having a hard time finding what they are looking for due to the low inventory levels.   Last year’s sales in August were 1569 and this year we sold 1725 showing a 9.9% increase this year over last.

Sales

July 2012  

Aug  2012

Change

% Change

Single Family Home

1386

1169

-217

-18.5%

Condo    Townhouse  

239

241

+2

+.01%

Condo Apartment

311

315

+4

       +1.2%
Total

1936

1725

-211        -12.2%


Calgary Real Estate Sales Prices:  Please note that we are now using the Benchmark price for this comparison.

As the chart below demonstrates the benchmark price for all categories stayed flat this month.  In my opinion this is a very healthy market with good activity level and prices showing modest increases.

Sales Prices July 2012   Benchmark Price   

Aug  2012 Benchmark Price  

Change

Single Family Homes

432400

432600

+200

Condo Townhouse  

277400

278200

+800

Condo    Apartment  

247600

248700

+1100

Absorption Rate (Months of Inventory) – Yes a new category!

The absorption rate is the inventory divided by the number of sales in the last month.

What does this mean you might ask?

An absorption rate of below 3.0 indicates a Seller’s Market

An absorption rate of between 3.0 to 4.0 indicates a Balanced Market

An Absorption rate of above 4.0 indicates a Buyer’s Market.


Absorption Rate   July  2012    

Aug  2012  

Change

Single Family Homes

2.63

3.02

+.39

Condo Townhouse  

2.61

2.42

-.19

Condo    Apartment  

3.73

3.38

-.35

Total Calgary

2.78

3.01

+.23


Therefore overall we are coming out of a seller’s market and entering a more balanced market.  Please note that these numbers do change on a community basis.  If you would like to find stats on your community just let me know.

If you have any questions about this summary, the attached stats package or any Real Estate questions please feel free to contact us anytime.

If you know anyone else who might enjoy seeing our monthly summary please feel free to pass it on.

Gord, Eric & Brent

January 2012 Calgary Housing Statistics

Wednesday, February 1st, 2012

What’s happening in the Calgary Real Estate Market? 

Ever heard that Real Estate is prices are a reflection of Supply and Demand?

Below is a summary made simple – what is happening in Real Estate in Calgary.

Information is taken from the Calgary Real Estate Boards monthly statistics package.

Calgary Listing Inventory:  Inventory levels for both Single Family homes and Condo’s increased this month.   This movement is normal for this time of year and we will most likely see this trend continue for the next several month.  

Inventory   December  2011 Jan 2012  Change
Single Family Home 2761 2980 +219
Condo’s 1287 1450 +163
Total 4048 4430 +382

Calgary Sales: 

Calgary Single Family home sales are up over December while Condo sales stayed flat.   Both Single Family home and Condo sales are almost the same as they were in January 2011.         

Sales December 2011 January 2012 Change
Single Family Home 722 773 +51
Condo’s 310 305 -5
Total 1032 1078 +46

 Calgary Real Estate Sales Prices:  In January Single family home median prices remained almost flat while Condo prices decreased by $12,875.  The median prices are not showing any certain direction but are bouncing up and down every month. 

Sales Prices December  Median Prices Jan 2012  Median Prices Change
Single Family Homes $393,750 395,000 +1250
Condo’s $257,875 245,000 -12,875

 Important note – As of Feb 2012 the Calgary Real Estate Board is changing the way it reports statistics.  The Canadian Real Estate Association in partnership with local Real Estate Boards has developed the MLS HPI (Home Price Index).  The Home Price Index identifies  turning points sooner, is the most current and is the most detailed and accurate gauge for Canadian home prices. 

With this change we will need to re-evaluate what information I can post for  monthly.  My goal is simply to make sure you are getting current up to date information that tells the real story about the Calgary Housing Market.

If you have any questions about this summary, the attached stats package or any Real Estate questions please feel free to contact us anytime.  

Gord, Eric & Brent

What’s happening in the Calgary Real estate market?

Saturday, September 3rd, 2011

This report gives you information on all the important indicators on whats happening in Calgary.  Real time, Real Estate Market stats at a glance for the Month of August 2011.  These stats  break the market down into what’s important and eliminates all the extra. Data is from the August Calgary Real Estate Boards Monthly stats package.

Calgary Listing
Inventory:
Inventory levels for Both Single Family homes and Condo’s stayed very flat this month.  This is generally a good number however with sales levels it would balance the market a little more if our inventory dropped slightly.

Inventory July
2011
August
2011
Change
Single Family Home 4630 4573 (57)
Condo’s 2003 1997 (6)
Total 6633 6570 (63)

Calgary Sales:

Calgary sales for the month of August showed marginal decreases for single family homes and a slight increase for condos. Sales numbers dropping is very normal at this time of year as the peak selling season is typically April through June.  Interestingly
sales in August 2010 were 865 Single family homes and 468 condos for a total of
1333 showing an increase of 18% this year over last.    

Sales July  2011 August
2011
Change
Single Family Home 1153 1106 (47)
Condo’s 453 468 +15
Total 1606 1574 (32)

Calgary Real Estate
Sales Prices:
Median prices for Single Family homes decreased by $6,749 and condo’s decreased by $14,000 in August.  To me this is not alarming as the direction is not a trend.  We seem to bounce up and down every month but overall prices are remaining fairly stable.

Sales Prices July
Median Prices
August 2011 Change
Single Family Homes $409,000 $402,251 ($6749)
Condo’s $269,000 $255,000 ($14,000)

Overall we are still in a buyer’s market – this month we moved slightly more in favour of buyers as our inventory stayed flat while sales did show a slight decrease therefore increasing our absorption rate.

Check out our new technology – we can now send you a custom monthly report including, active listing, sold listings, days on market and much more –with easy
to understand graphs all based on your home by the postal code you enter. All
you have to do is sign up and once we approve you will get your own personal Market Snapshot. Simply Click here to sign up: www.calgaryareasolds.com

If you have any questions about this summary, the attached
stats package or any Real Estate questions please feel free to contact us
anytime.

Gord & Brent & Eric

July 2011, Calgary Real Estate Stats at a glance

Friday, August 5th, 2011

Tired of trying to figure out whats happening in the Calgary Real Estate Market.   Below you will find a summary of some key indicators with a few short comments that will give you a clear indication of how the Calgary Real Estate market is performing.  This information is taken from the Calgary Real Estate Boards monthly stats package for realtors and is provided for you by Gord Piper and Associates.  If you would like to see the entire report contact us.

Calgary Listing Inventory:  Both Single Family homes and condo’s decreased marginally this month.     

Inventory June 2011 July 2011 Change
Single Family Home 4744 4630 Decrease of 114
Condo’s 2023 2003 Decrease of 20
Total 6767 6633 Decrease of 134


Calgary Sales: 

Calgary sales for the month of July showed decreases for both single family and condos. This is very normal as the peak selling season is typically April through June.  Of interest, even though sales numbers decreased in July our sales were still substantially higher than last July.     

Sales June 2011 July  2011 Change
Single Family Home 1398 1153 Decrease of 245
Condo’s 581 453 Decrease of 98
Total 1979 1606 Decrease of 373


Calgary Real Estate Sales Prices:    Prices for Single Family homes decreased slightly while condos increased very slightly this month.  Both seem to be remaining fairly flat with slight ups and downs but not heading in any one direction.    

Sales Prices June Median Prices July Median Prices Change
Single Family Homes $417,250 $409,000 Decrease of $8,250
Condo’s $265,000 $269,000 +$4,000


Overall we are still in a slight buyers market – this month we moved slightly more in favour of buyers as our inventory decreased only marginally while sales did show a decrease therefore increasing our absorption rate.

If you have any questions about this summary, the attached stats package or any Real Estate questions please feel free to contact us anytime.  

Gord Piper  & Brent Wilcox

CIR Realty