What is really happening in the Calgary Real Estate Market?
The market is a result of Supply and Demand therefore we look at both Supply (inventory) and Demand (Sales) and the relationship between the two. We also update you on the current benchmark price for all housing sectors.
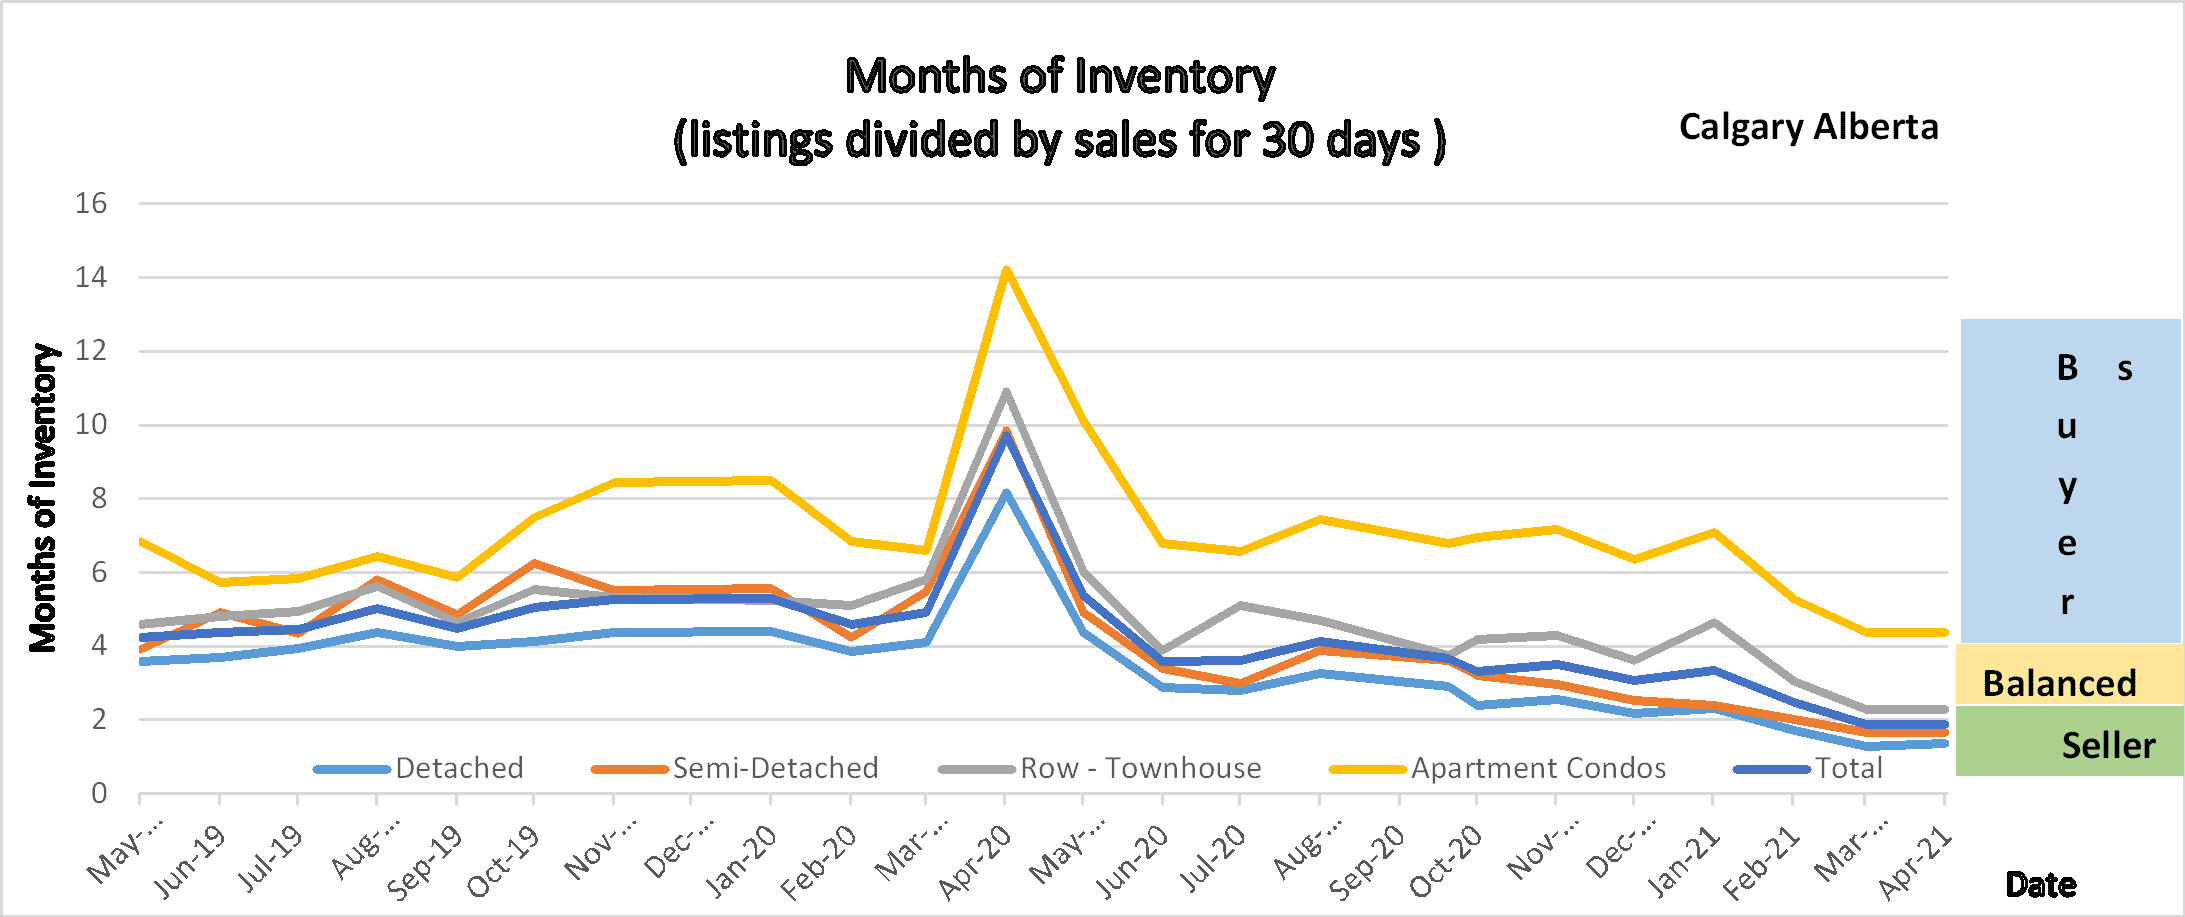
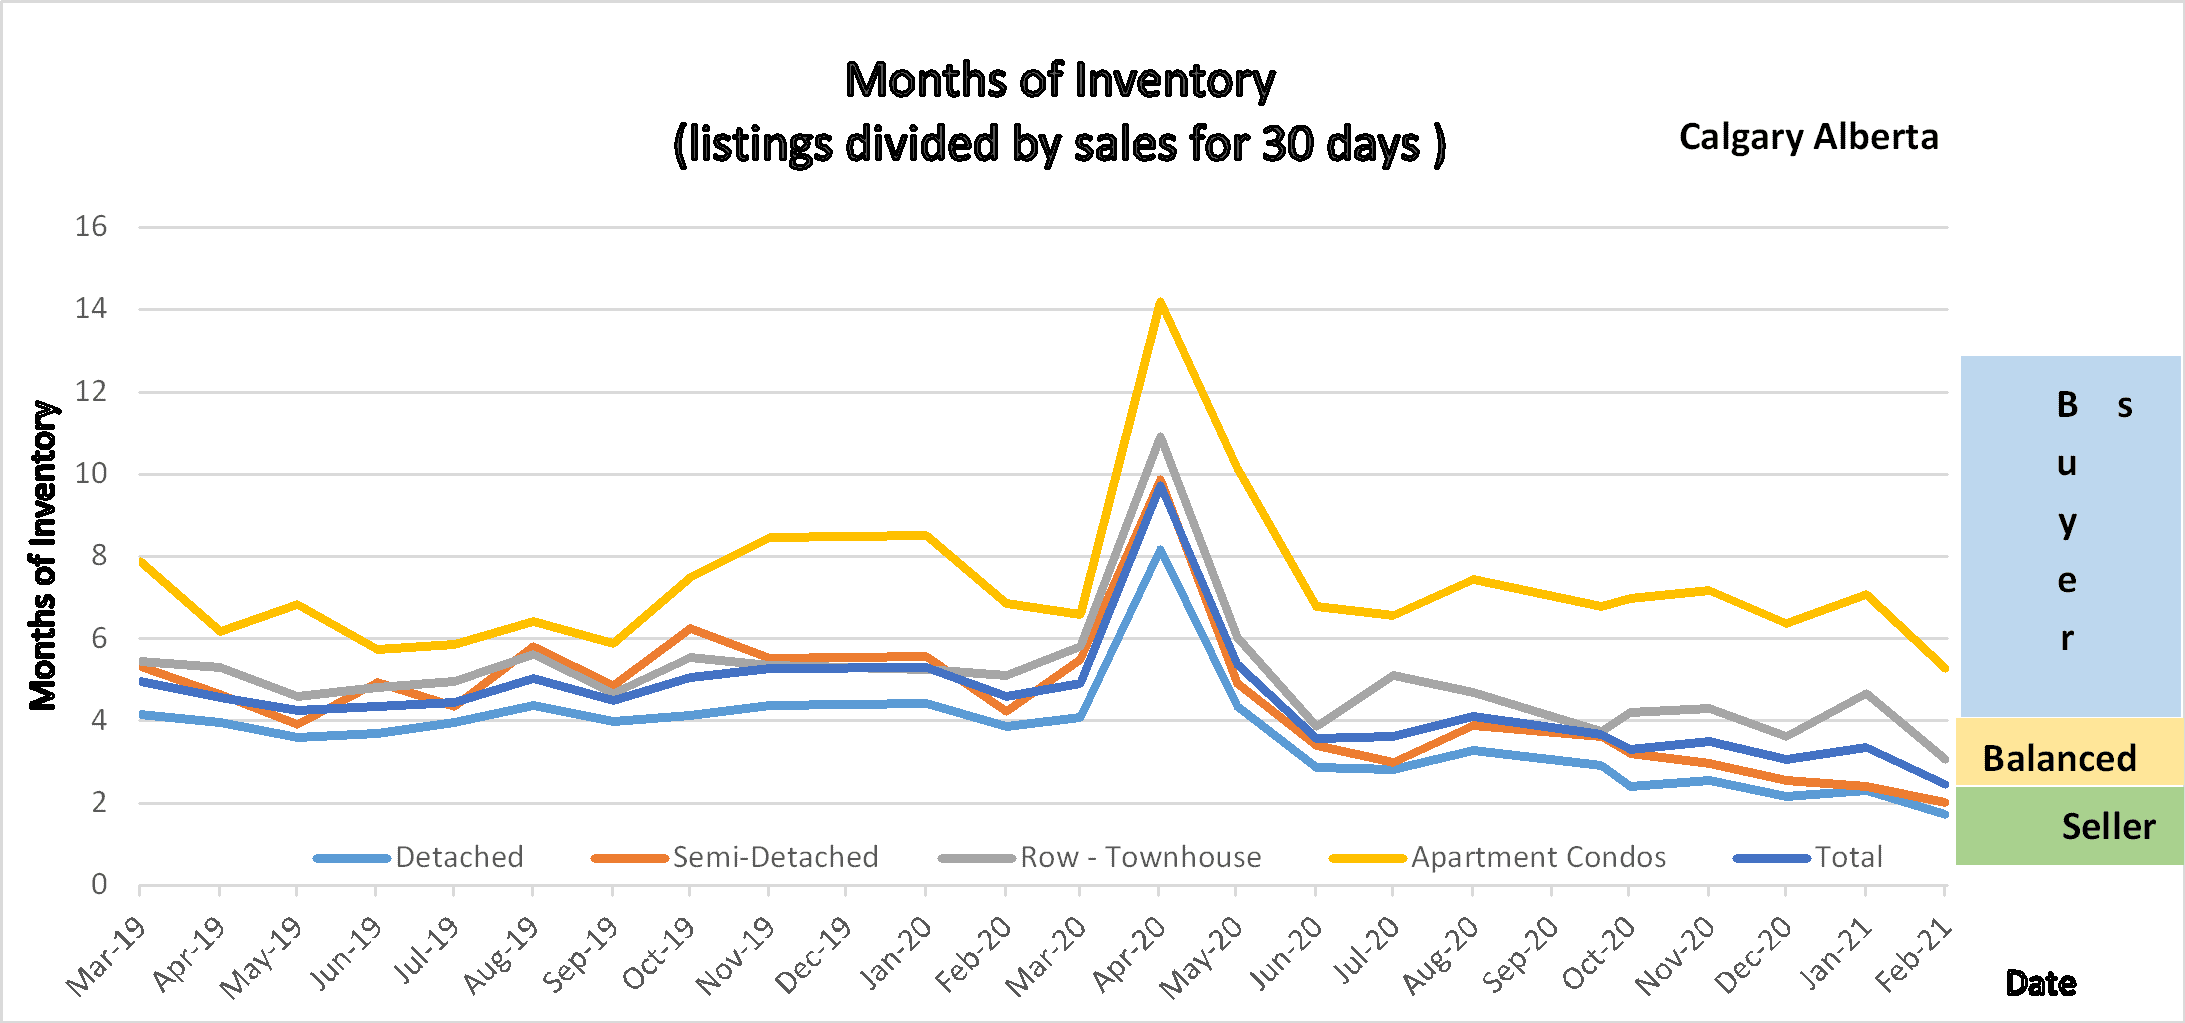
Following is a graph that shows the months of inventory for each housing sector. Looking at a 2-year trendline gives you an indication of where things are really heading.
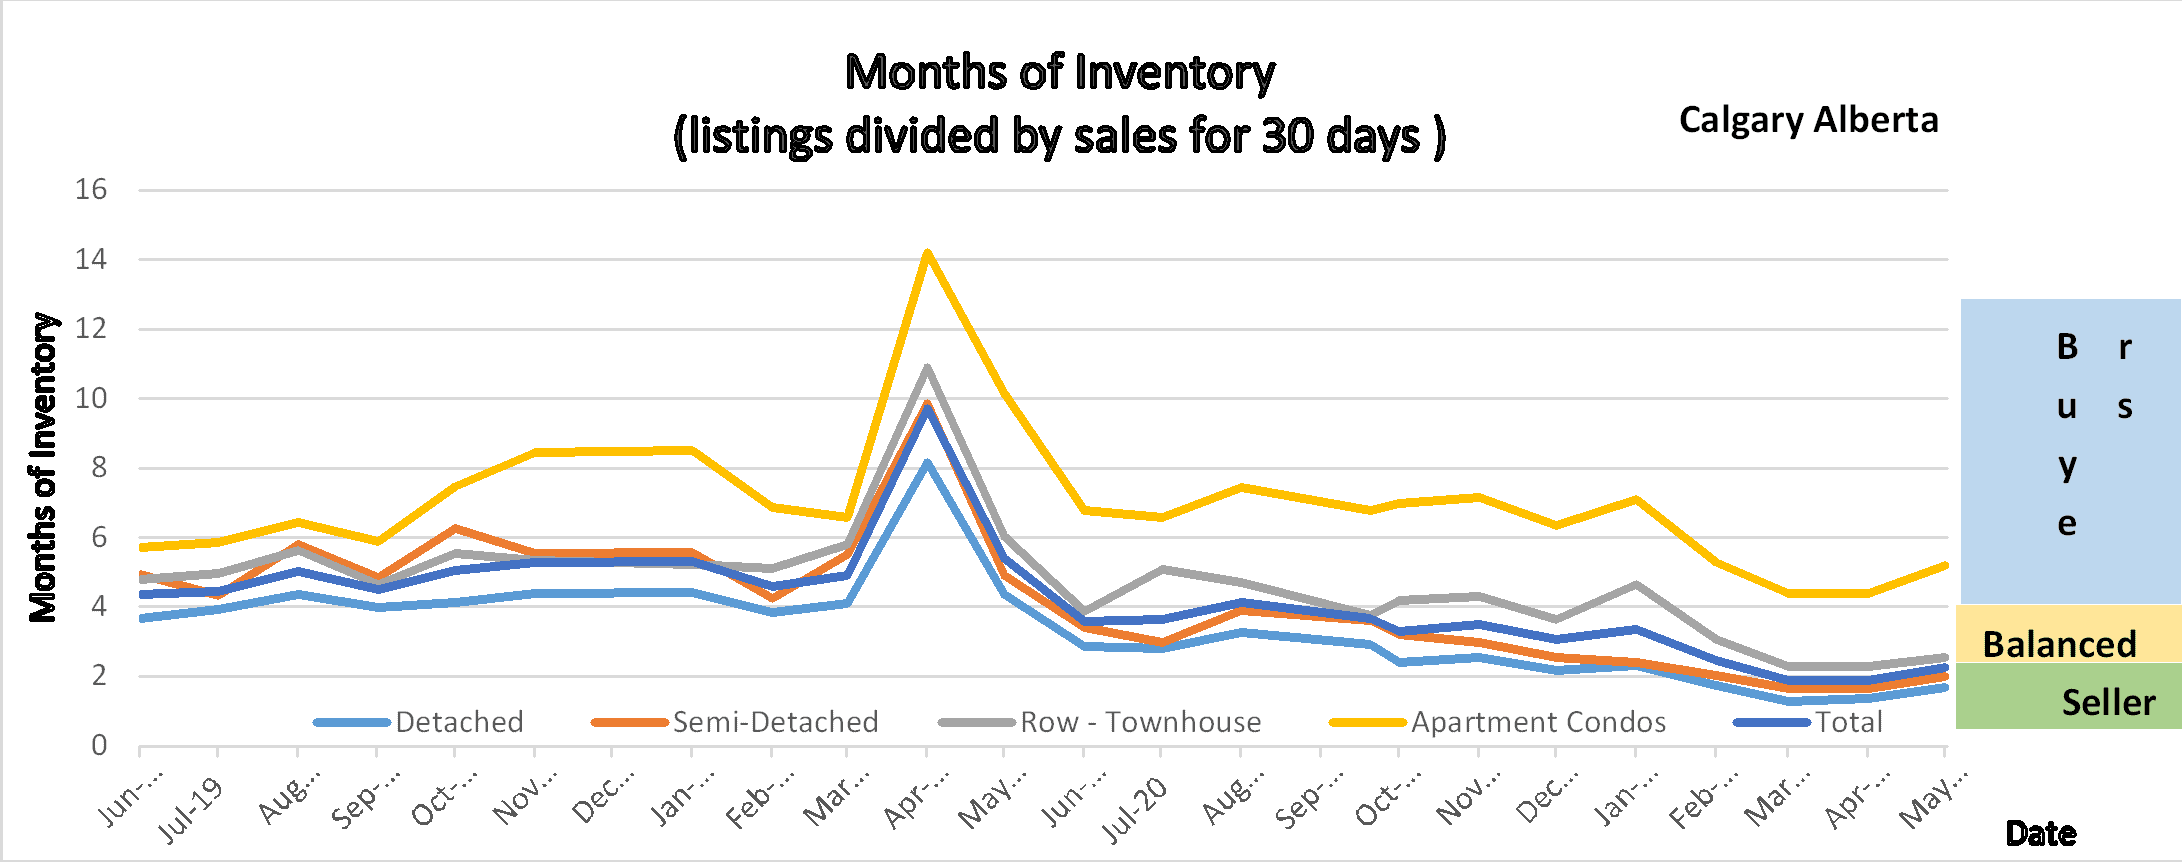
2 year trend – Months of Inventory
Gord’s commentary for the month (just my opinion).
Another huge month for Calgary Real Estate although Change is on the way again.
“Buyers Beware” The booming market has already brought out sellers who are fishing for huge dollars, yes there are more than a normal number of homes listed substantially above what the market will bear.
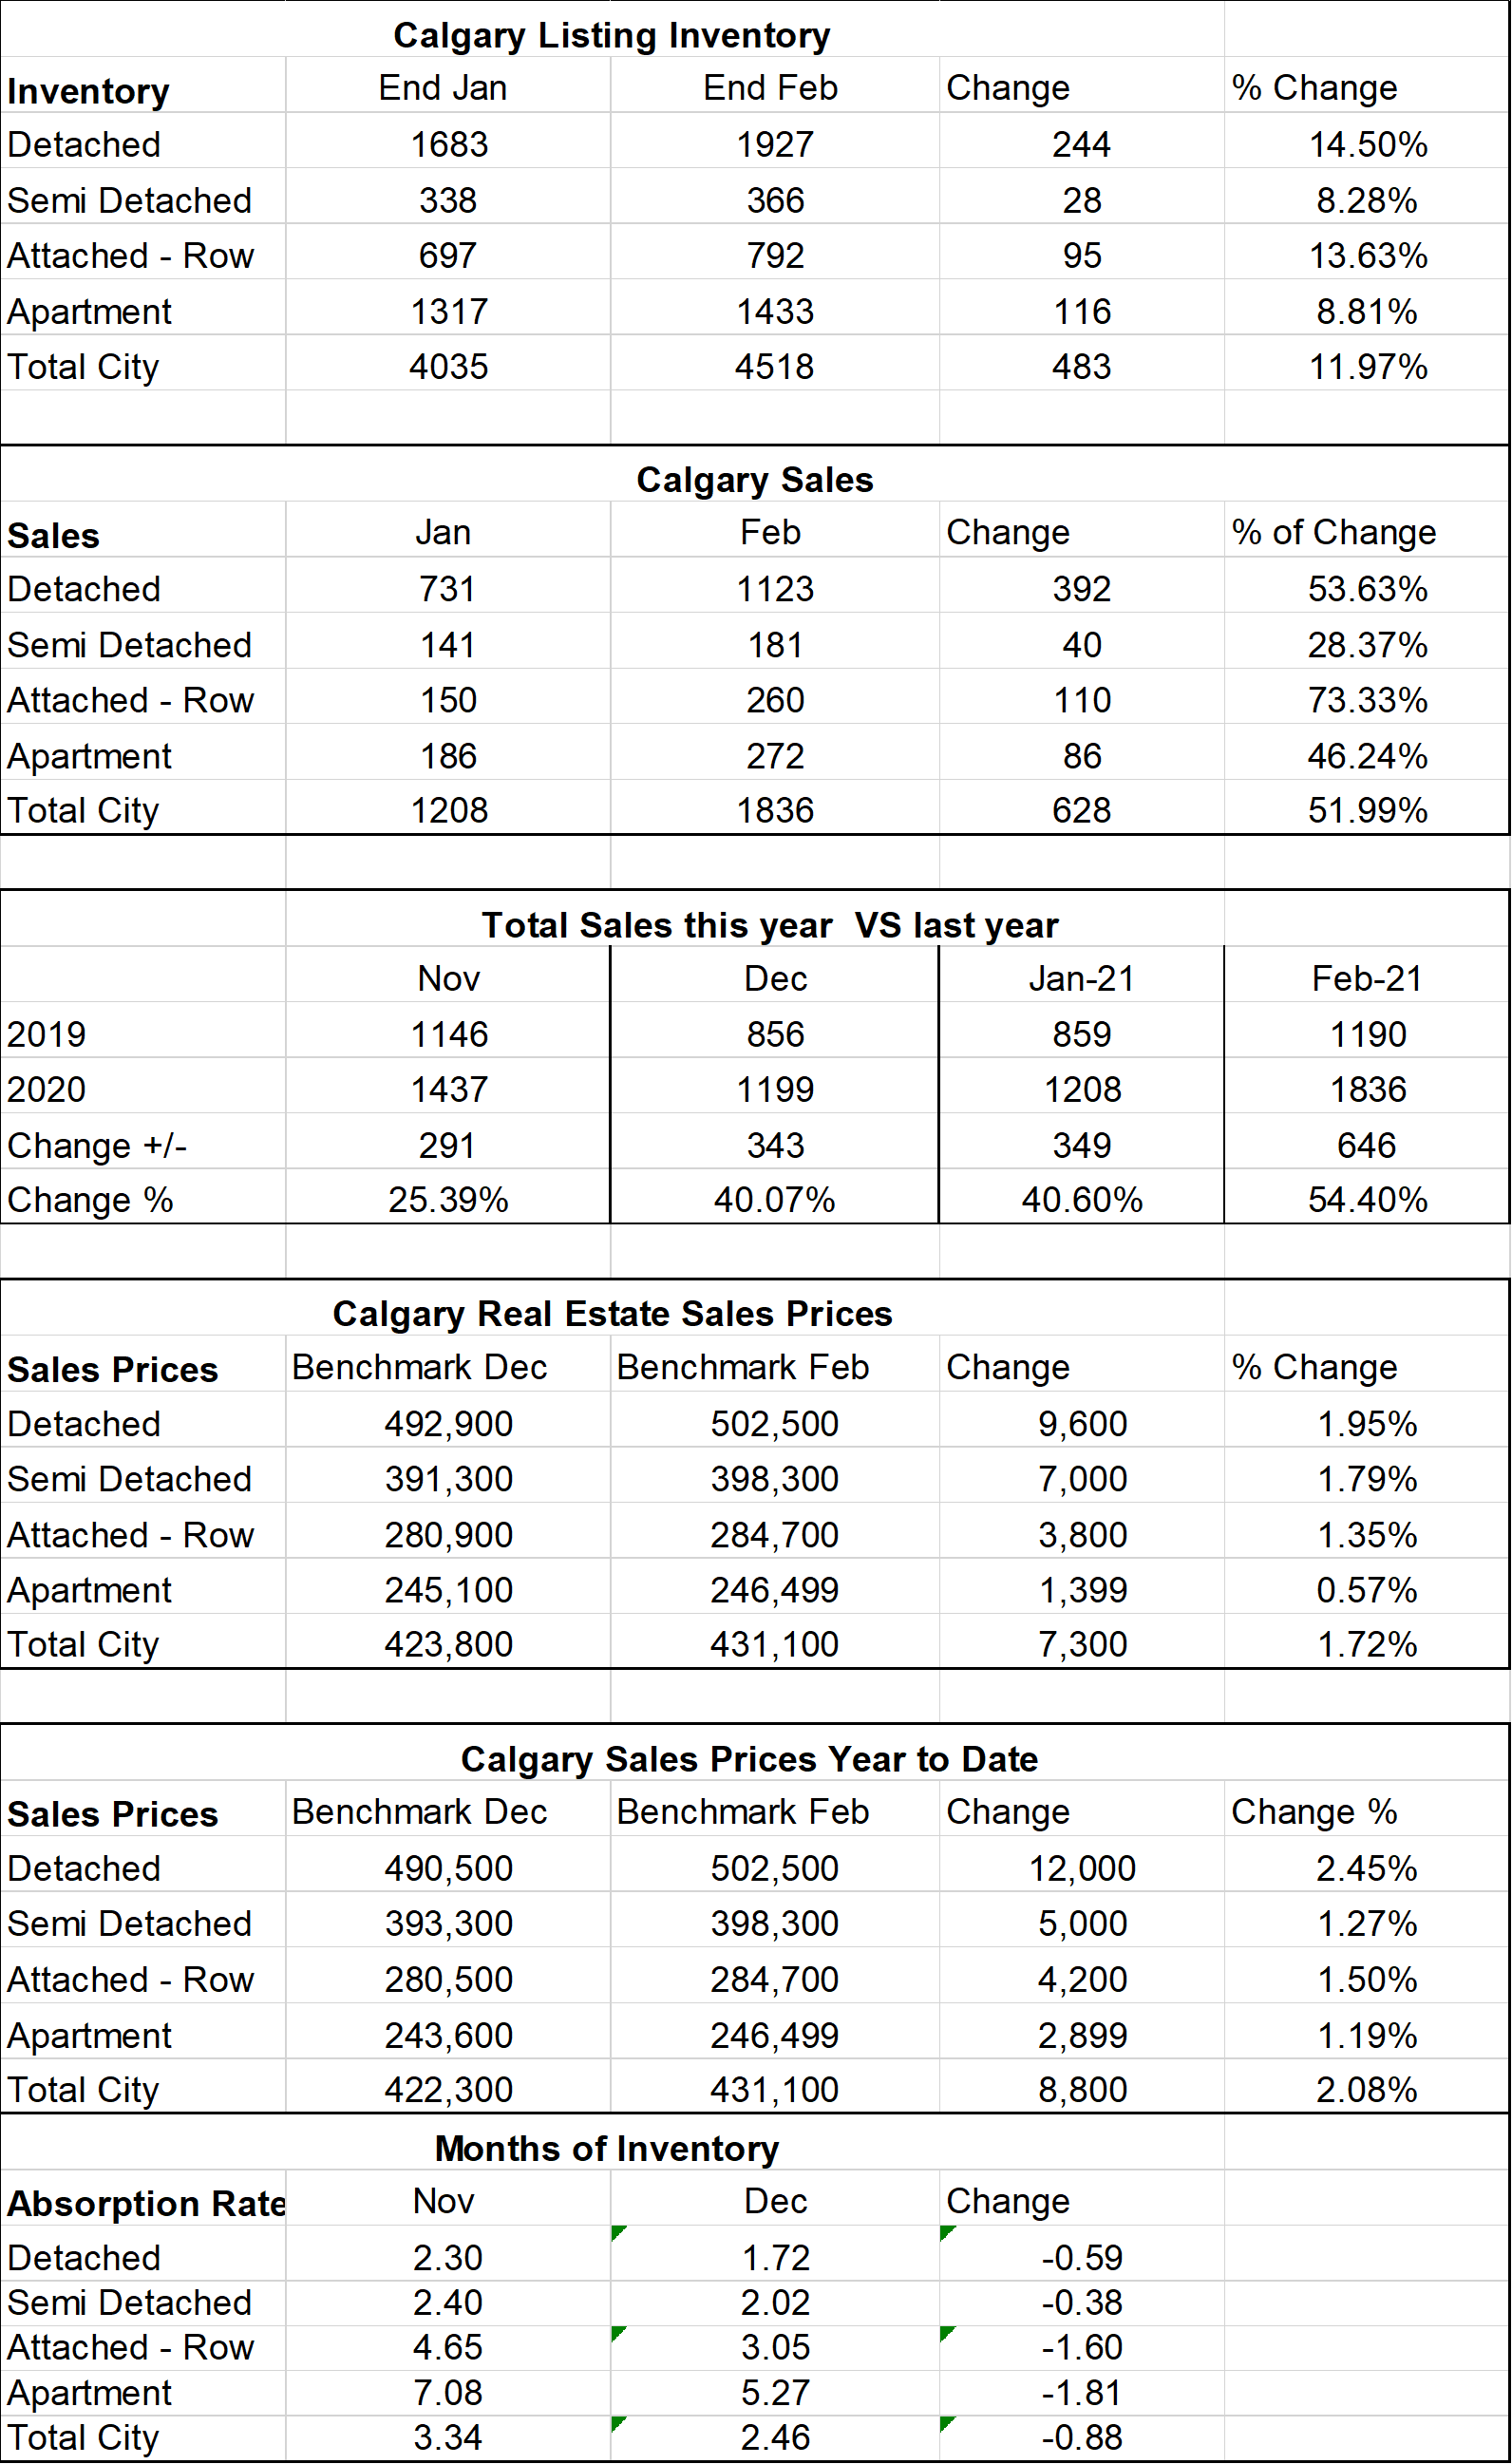
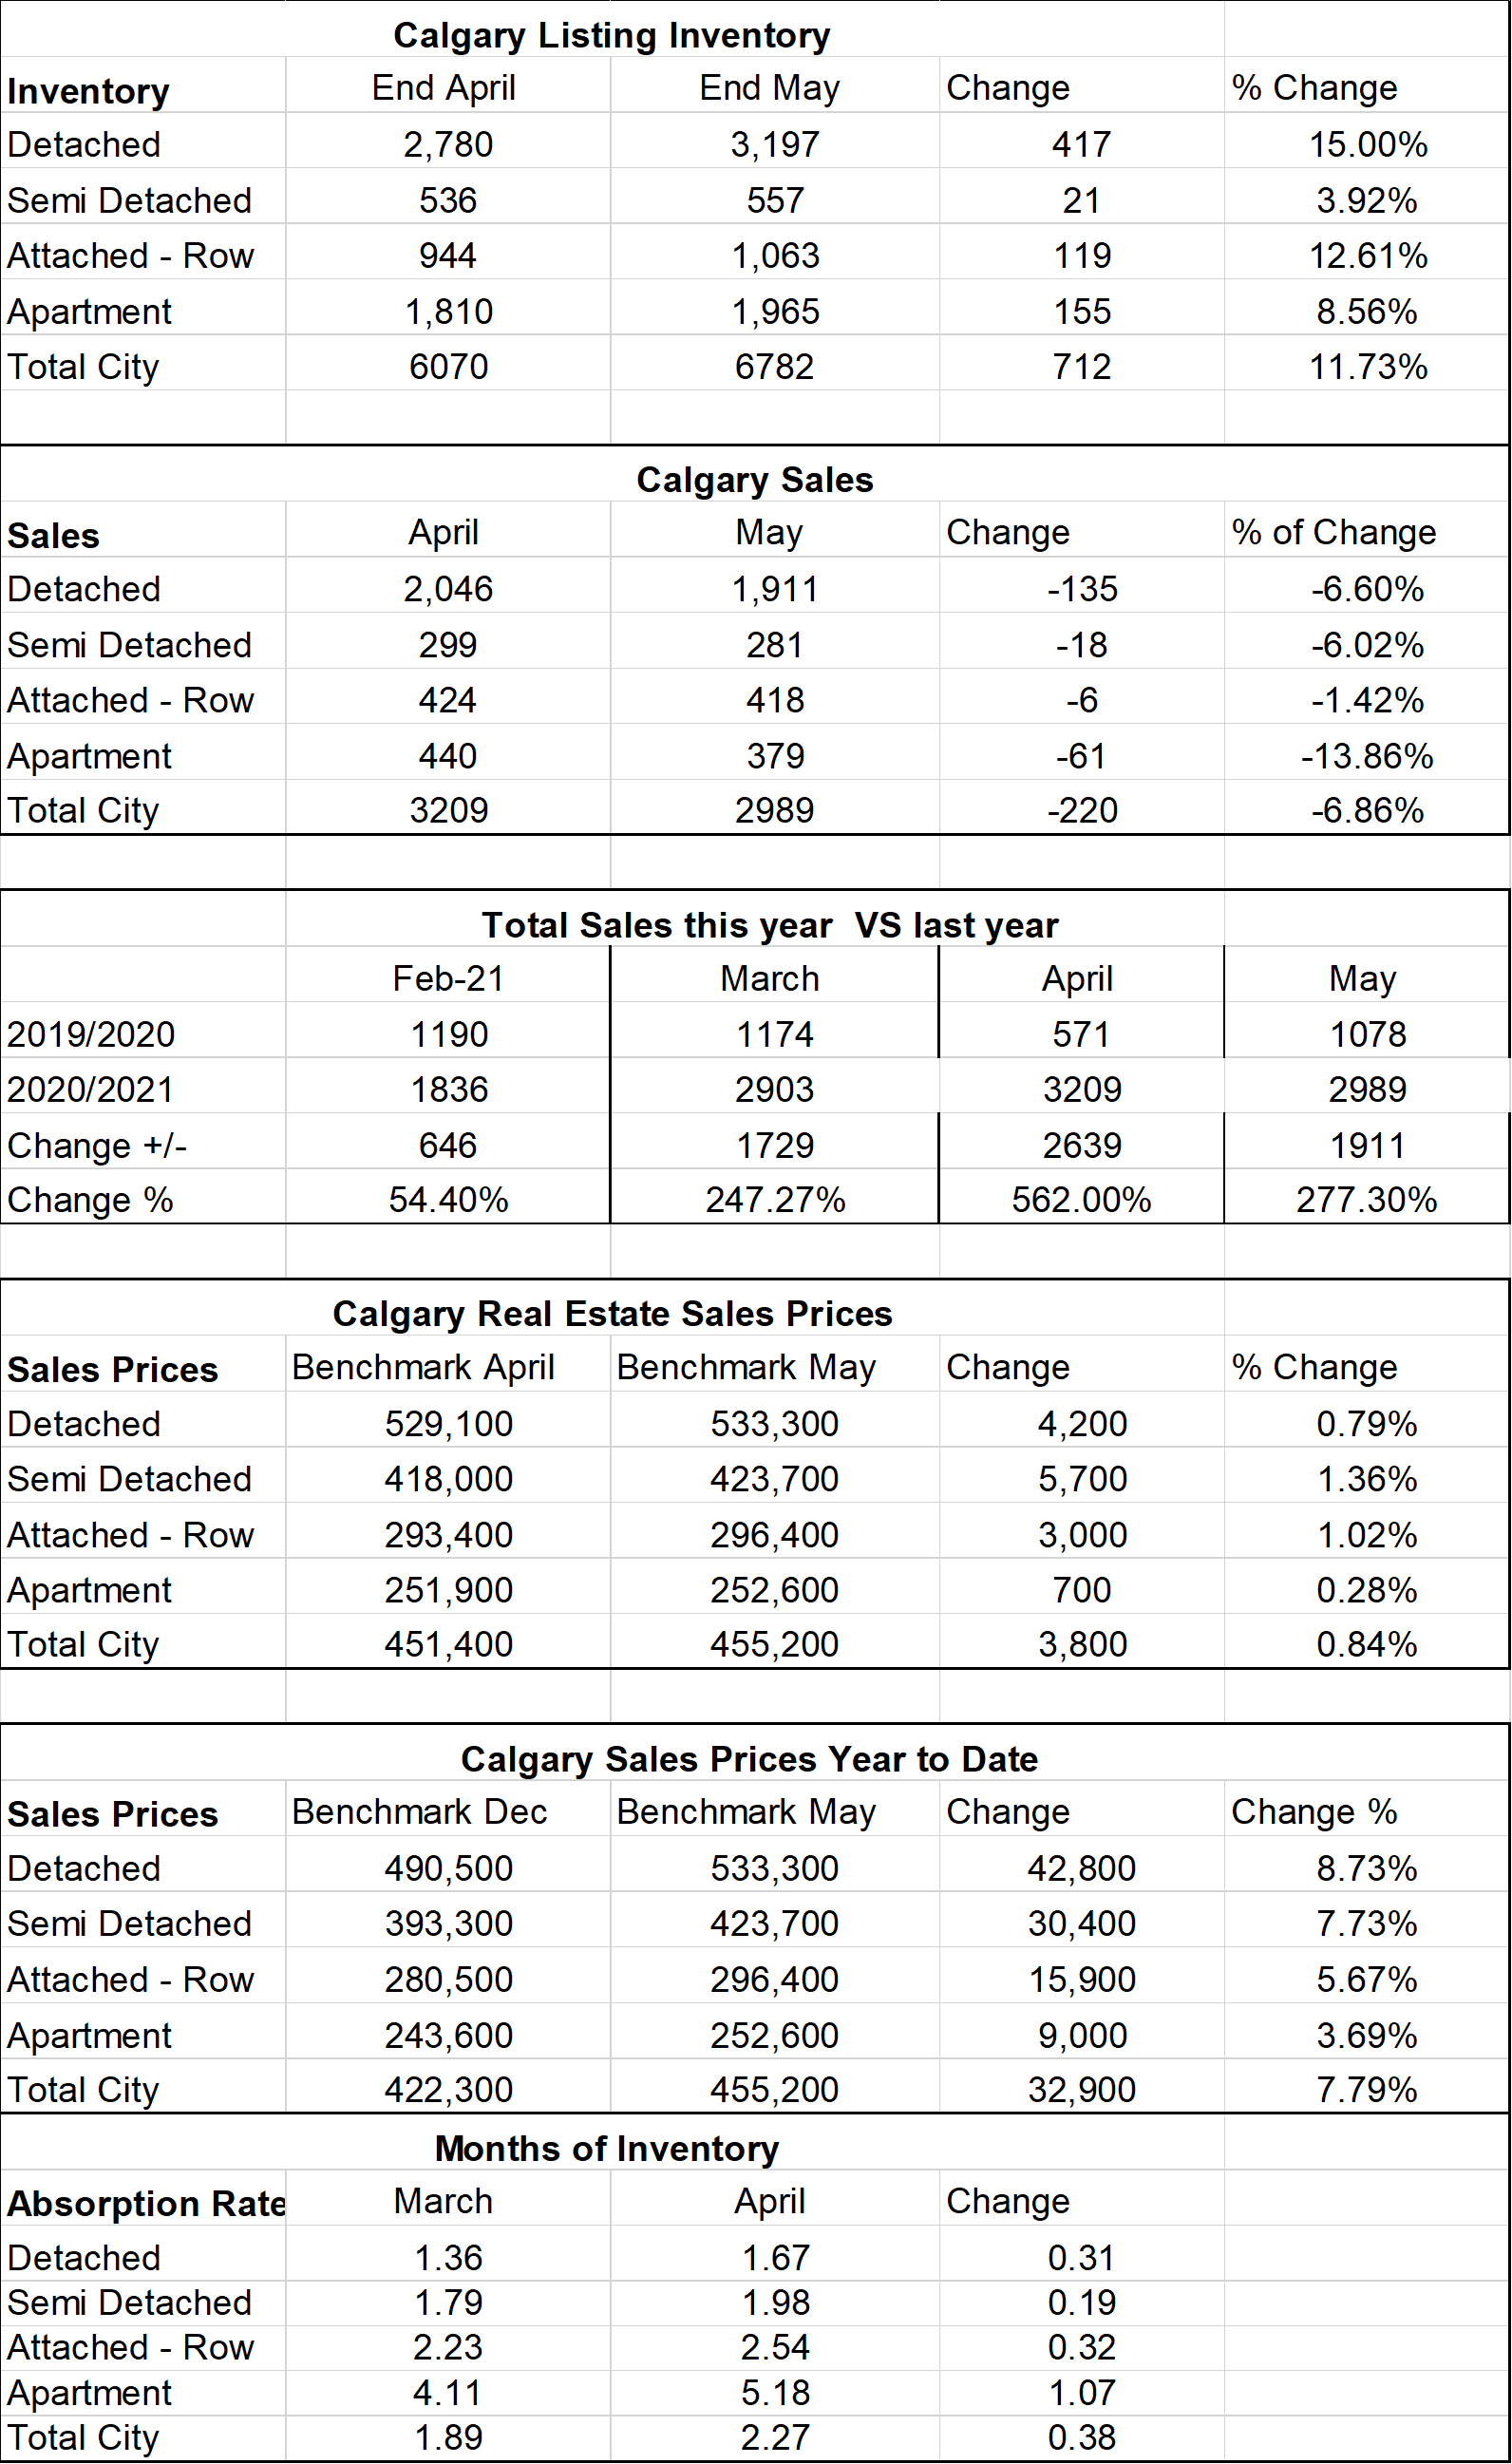
Calgary Listing Inventory
Listing inventory in Calgary increased in every sector with the largest increase in the Detached Sector at 15%. The lowest increase was in Semi-Detached homes at 3.92. The overall market increased by 11.73%
Calgary Sales:
Sales in all sectors are booming although we are seeing signs of a slight slowdown across all sectors. The largest decrease was in Apartment condos at 13.86% decline, the lowest decline in sales was Attached-Row homes at 1.42% Overall decline in sales was 6.86% from April highs.
I do not for a minute believe the demand has gone down, what I believe is causing the decline is the availability of homes.
Sales Compared to 2020:
Normally this is a good category to watch however we are now comparing sales this year to when we were
in a collapsed market due to Covid and the First Shutdown.
| Jan | Feb | Mar | Apr | May | June | |
| 2020 | 861 | 1190 | 1175 | 573 | 1080 | |
| 2021 | 1208 | 1836 | 2903 | 3209 | 2989 | |
| Change | +347 | +646 | +1729 | +2639 | 1,911 | |
| % Change | +7.49 | +54.4 | 247% | +562% | 277.3% |
| July | Aug | Sept | Oct | Nov | Dec | |
| 2020 | 1835 | 80 | 1702 | 1764 | 1437 | 1199 |
| 2021 | ||||||
| Change | ||||||
| % Change |
Calgary Real Estate Benchmark Sales Prices:
Overall, the benchmark price in Calgary increased again in May by $3,800.
The largest gain was in Semi-Detached at $5,700 Detached homes at $4,200, Attached Row at $3,000, and Apartment Condos at $700.
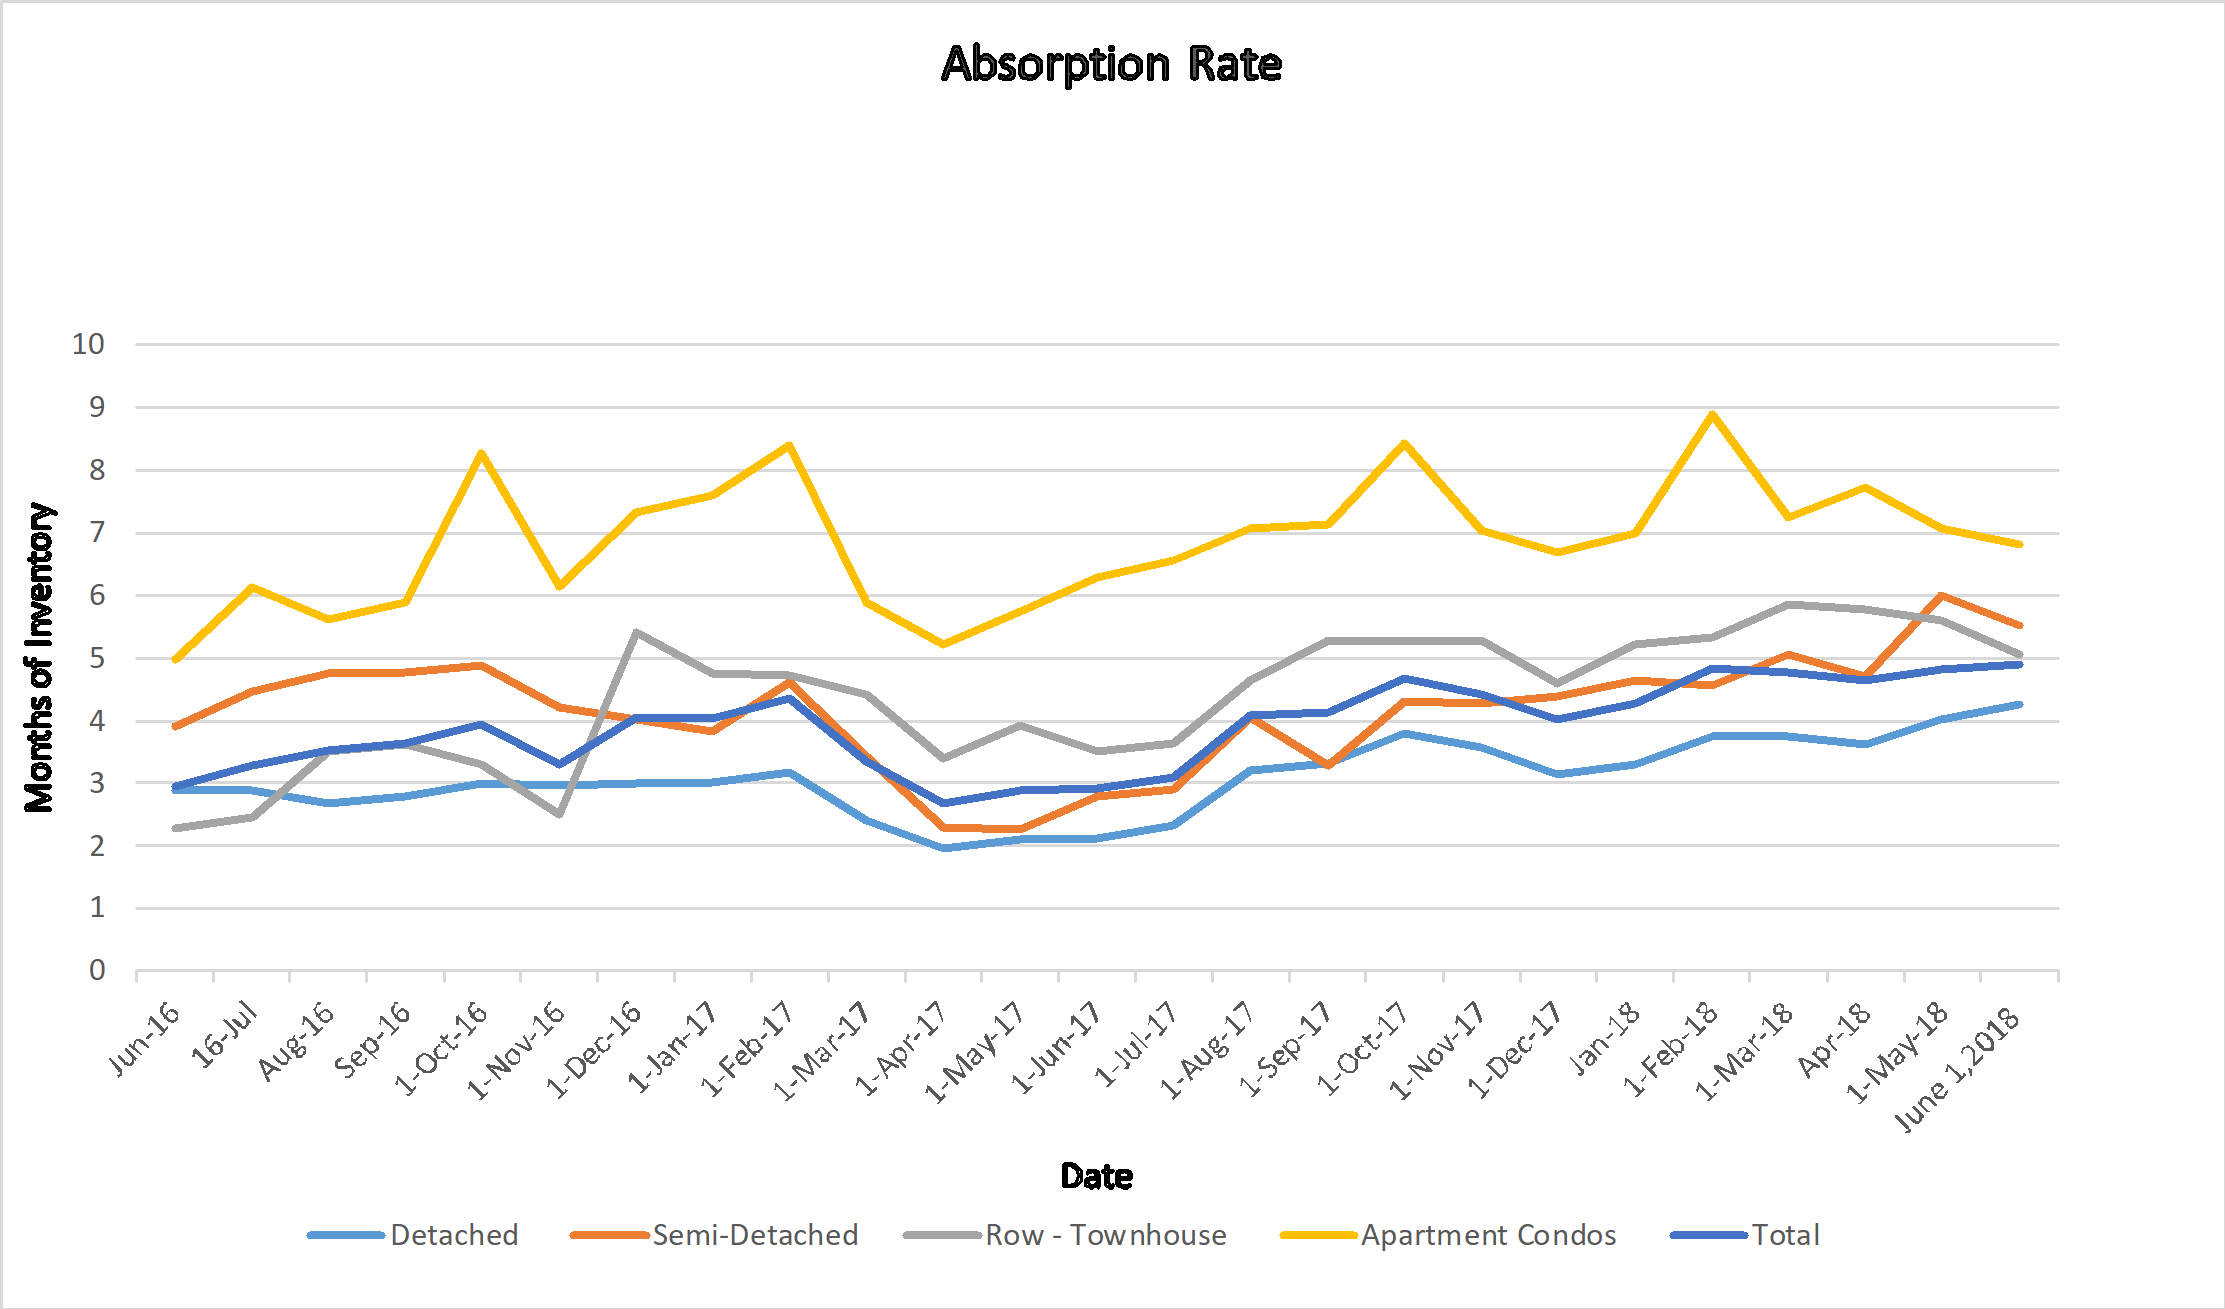
Current Months of Inventory (Absorption Rate):
With the increases in inventory and the reduction in sales our Months of Inventory is starting to rise again. Still positioned in a Seller’s market are Detached and Semi-Detached homes. Attached Row homes just came out of the seller’s market to a balanced market position. Apartment condos are still sitting at 5.18 Months of inventory so very much in a buyer’s market.
It is also important to note that these numbers vary by community, and by price range. If you would like numbers for your community, or more specific numbers for your home please contact us.
Below is a summary of numbers in chart form. All numbers are taken from the Calgary Real Estate Boards monthly Stats package.
Data taken from the Calgary Real Estate Boards Monthly Stats Package.