What is really happening in the Calgary Real Estate Market?
What is really happening in the Calgary Real Estate Market?
Stay ahead of everyone else by following our Monthly Market Snapshot of the Calgary Real Estate Market. This shows what’s really happening! The market is driven by supply and demand so here we show the inventory (supply) and sales (demand) and most importantly the relationship between the two and how it affects the price of Calgary Real Estate. A simple way to keep up to date with how the market is trending and to stay ahead of most! All numbers are taken from the Calgary Real Estate Boards Stats package for Realtors. I have also included some general comments which are simply my opinion.
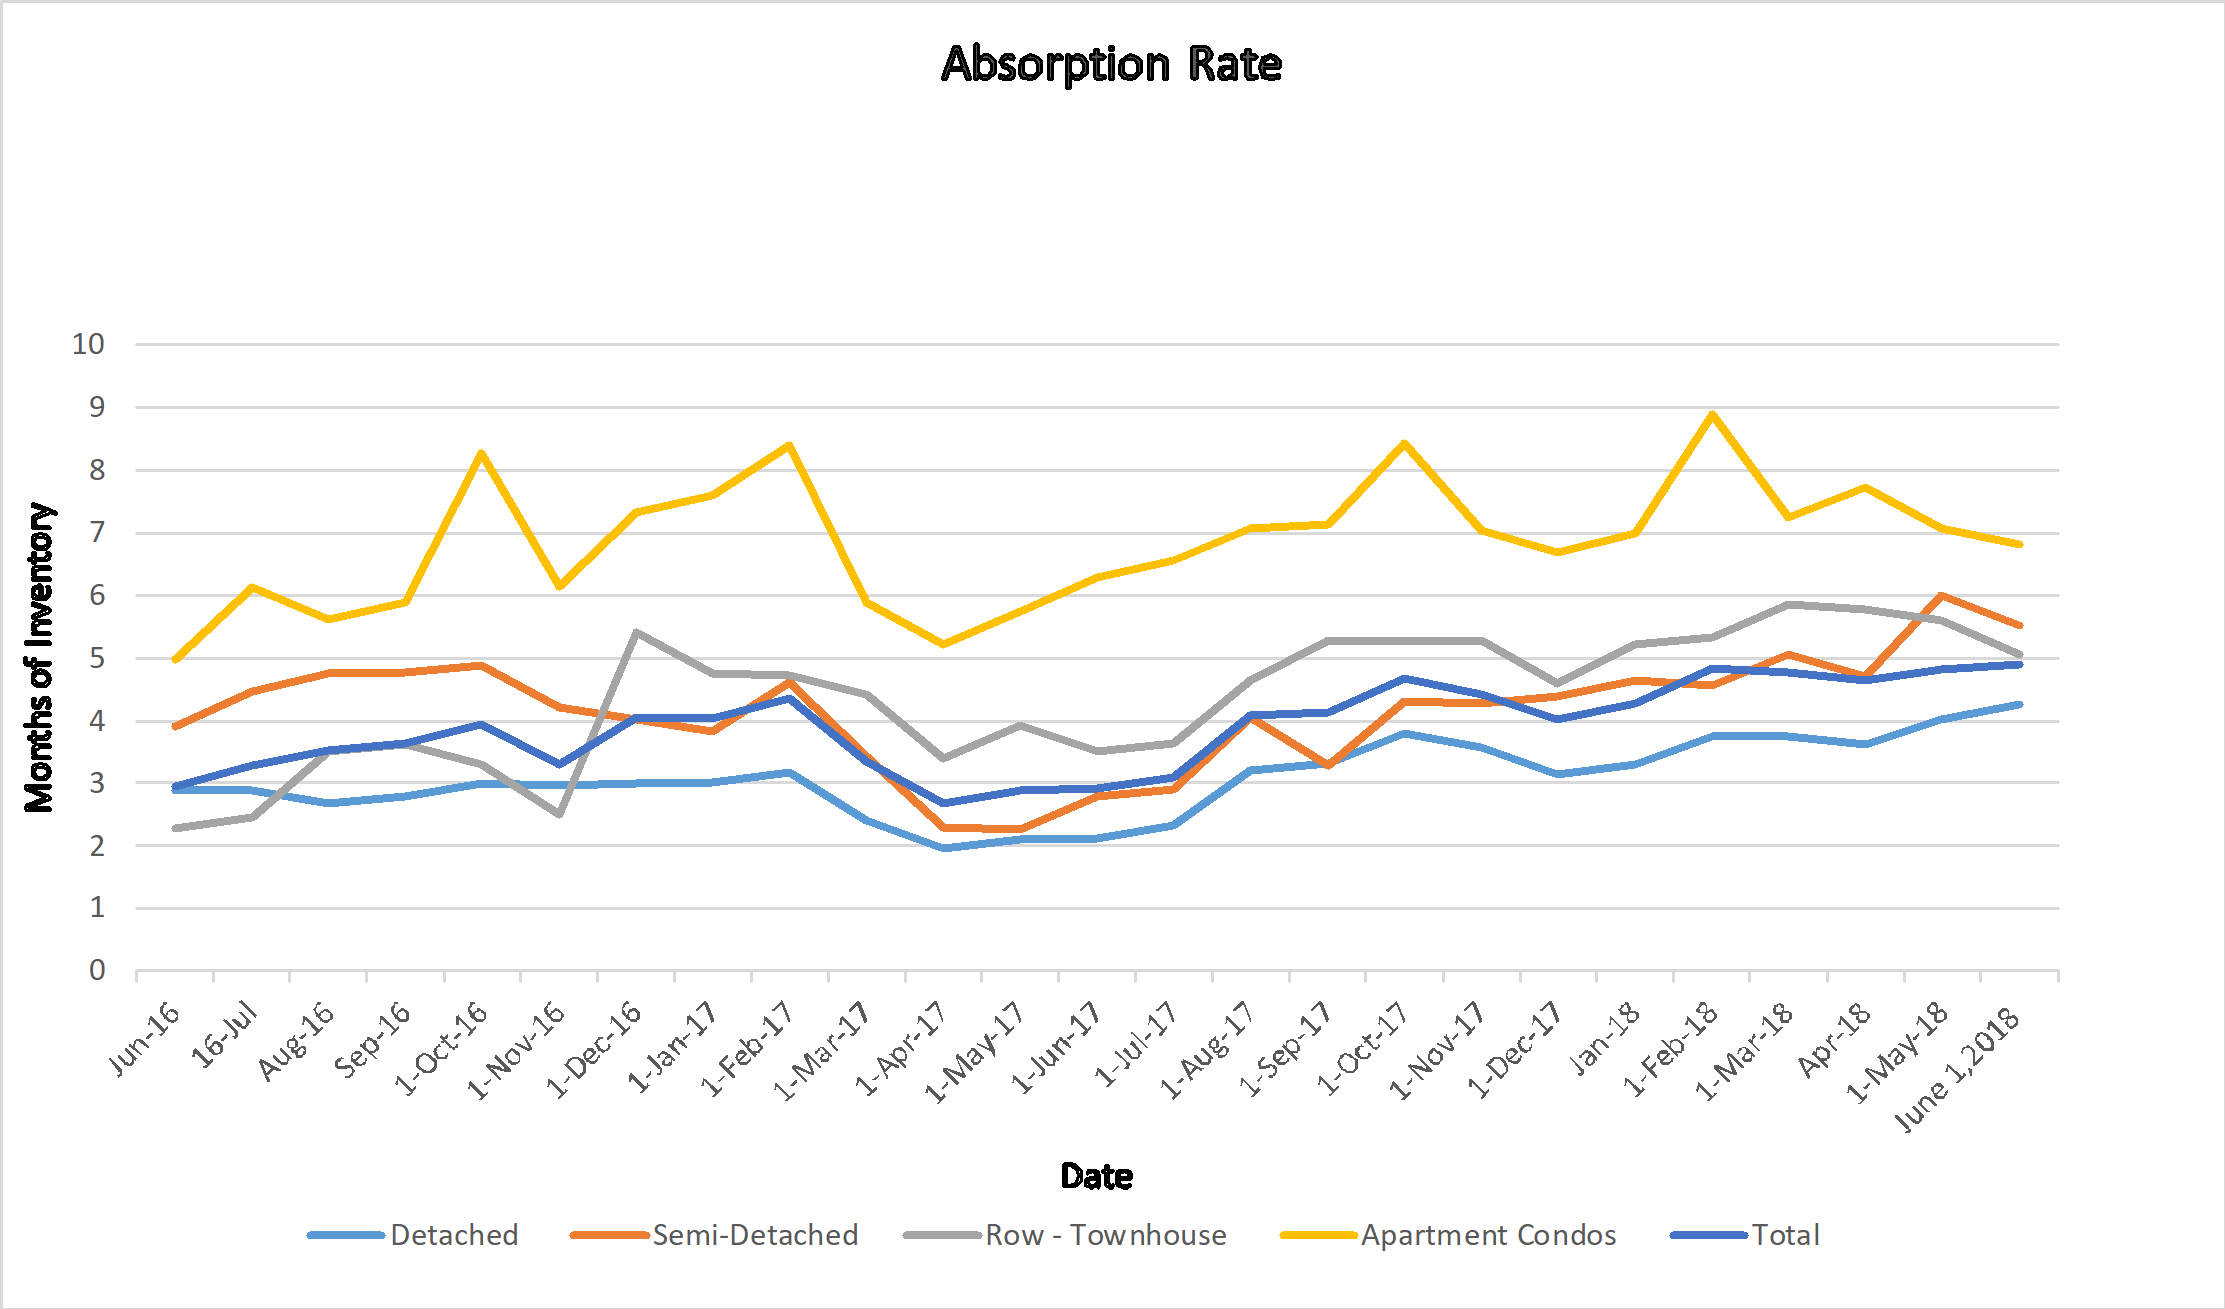
Months of Inventory/Absorption Rate – the inventory divided by the number of sales in the last month). What does this mean you might ask?
| Buyer’s Market |
>4.0 |
Drives prices down |
| Balanced Market |
Between 2.4 to 4.0 |
Prices typically remain stable |
| Seller’s Market |
<2.4 |
Drives prices up |
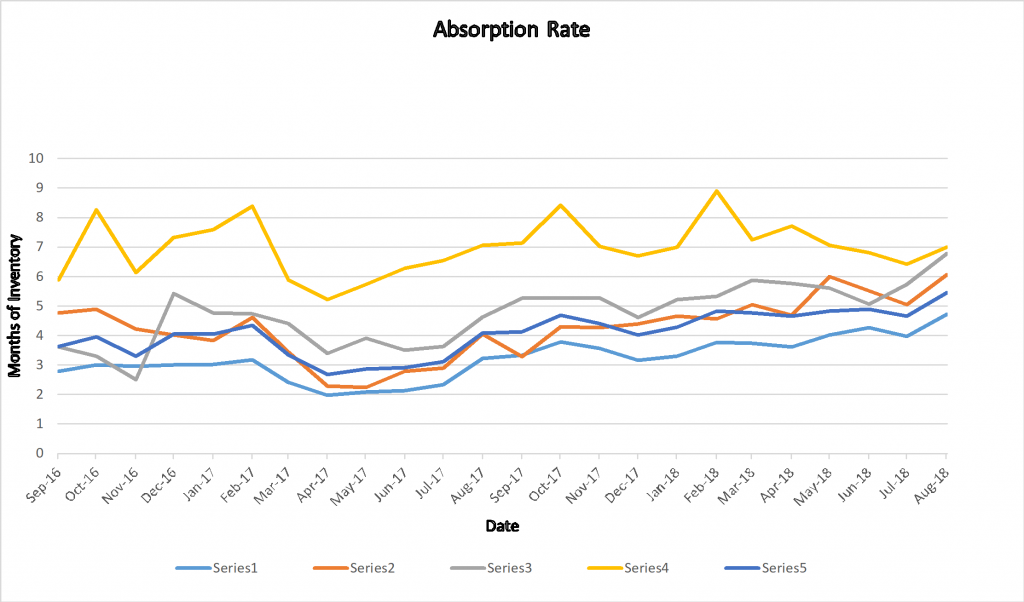
Watch the Trend
On the above graph it is important to see the trends – As you can see the apartment condo absorption rate is has been trending down however in July it reversed and when back up.
Current Months of Inventory: If we did not list any more homes this is how many months it would take to deplete inventory.
In July the months of inventory increased in every Category. If you have been following my monthly snapshot you will notice that most months when this changes it changes only a little where this month the numbers have increased substantially. This change puts us deep into a Buyer’s market in every category.
| End of |
June 2018 |
July 2018 |
Change |
| Detached |
3.98 |
4.72 |
0.74 |
| Semi Detached |
5.04 |
6.07 |
1.04 |
| Attached – Row |
5.73 |
6.78 |
1.05 |
| Apartment |
6.41 |
7.01 |
0.60 |
| Total City |
4.65 |
5.46 |
0.81 |
Calgary Listing Inventory
In July, our inventory decreased increased in all sectors and overall. This is totally normal at this time of year and we should expect this trend to continue for the rest of the year.
| Inventory |
June 2018 |
July 2018 |
Change |
| Detached |
4817 |
4578 |
-239 |
| Semi Detached |
922 |
911 |
-11 |
| Attached – Row |
1209 |
1187 |
-22 |
| Apartment |
1872 |
1774 |
-98 |
| Total Calgary |
8820 |
8450 |
-370 |
Calgary Sales:
Sales were down in all categories and again this is normal for July as this is moving out of our busy season when people are focused on vacations and outdoor activities.
Sales Compared to last year: Of interest if we compare to last year Sales in June we were 11.3% down from last year while July we were down only 4.8% from last year – a big improvement.
| Calgary Sales |
June 2018 |
July 2018 |
Change |
% Change |
| Detached |
1210 |
969 |
-241 |
-19.92% |
| Semi Detached |
183 |
150 |
-33 |
-18.03% |
| Attached – Row |
211 |
175 |
-36 |
-17.06% |
| Apartment |
292 |
253 |
-39 |
-13.36% |
| Total City |
1896 |
1547 |
-349 |
-18.41% |
Calgary Real Estate Sales Prices:
As we are now in a buyer market we should expect prices to decline slightly which is what happened except in the Apartment Condo sector where prices increased slightly.
| Sales Prices |
June 2018 Benchmark Price |
July 2018 Benchmark Price |
Change |
| Detached |
503,100 |
501,300 |
-1,800 |
| Semi Detached |
418,000 |
416,200 |
-1,800 |
| Attached – Row |
302,300 |
300,300 |
-2,000 |
| Apartment |
259,100 |
259,700 |
600 |
| Total City |
436,500 |
435,200 |
-1,300 |
Sales Prices “Year to Date”
Same as monthly number
| Sales Prices |
Jan 1, 2018 Benchmark Price |
July 2018 Benchmark Price |
Change
$ |
% Change |
| Detached |
499,600 |
501,300 |
1,700 |
0.34% |
| Semi Detached |
416,600 |
416,200 |
-400 |
-0.10% |
| Attached – Row |
299,500 |
300,300 |
800 |
0.27% |
| Apartment |
257,700 |
259,700 |
2,000 |
0.78% |
| Total City |
433,200 |
435,200 |
2,000 |
0.46% |
**Please note that these numbers include only Calgary homes and do change on a community basis and more so for towns. This report does not include rural properties. If you would like to find stats on your community just let me know. If you have any questions about this summary or about Real Estate in general, please feel free to contact us.