Posts Tagged ‘Business/Finance’

April 2021 Calgary Real Estate Market Snapshot.

Monday, May 3rd, 2021

What is really happening in the Calgary Real Estate Market? 

The market is a result of Supply and Demand therefore we look at both Supply (inventory) and Demand (Sales) and the relationship between the two.  We also update you on the current benchmark price for all housing sectors.

Following is a graph that shows the months of inventory for each housing sector.  Looking at a 2-year trendline gives you an indication of where things are really heading.
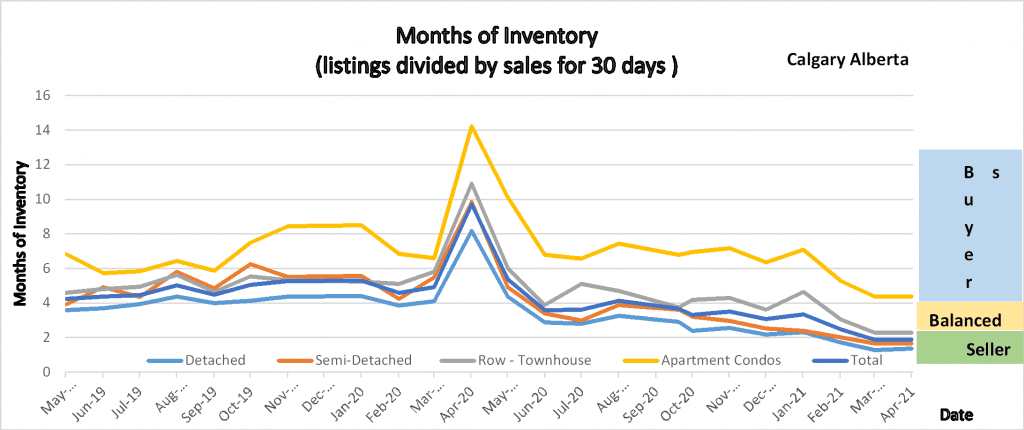
The graph shows the 2-year trend of the number of months of Inventory for all housing sectors within the Calgary Real Estate Market.

The graph shows the 2-year trend of the number of months of Inventory for all housing sectors within the Calgary Real Estate Market.

Gord’s commentary for the month (just my opinion).


Wow, another huge month for Real Estate in Calgary. In addition to Detached homes being in a seller’s market position, Semi-Detached and Attached Rowhouses have joined that category leaving only Apartment condos in the balanced market territory.


Calgary Listing Inventory

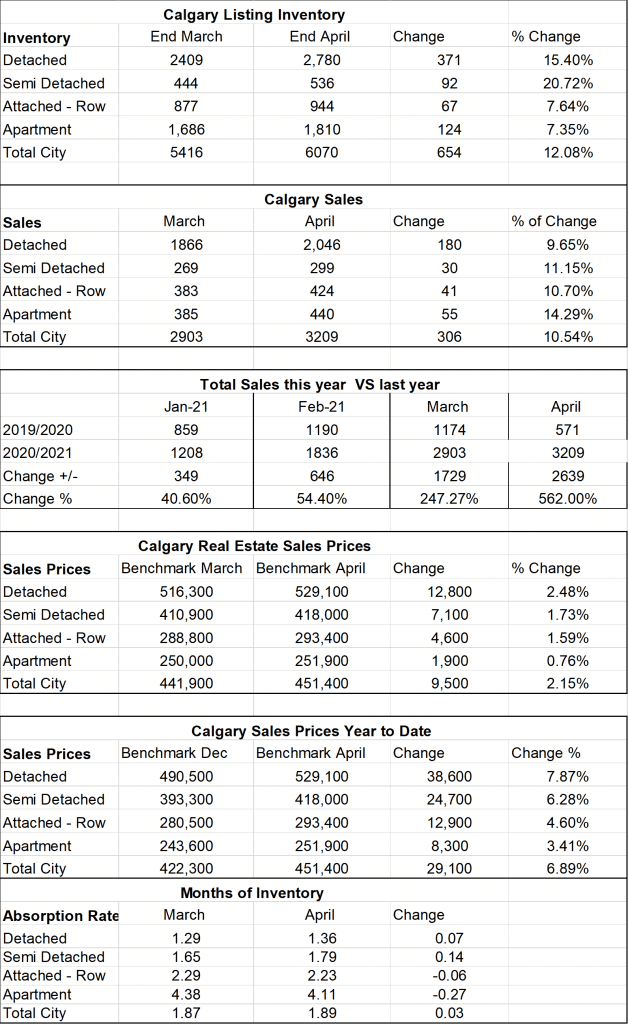
In April we saw the inventory for homes in all sectors increase by approx. 12%

The number of new listings in April was 4670 compared to 4441 for March so a 5% increase.

It seems that most of the new listings are still immediately turning in sales.


Calgary Sales:

Calgary Sales are soaring.  Detached homes and Semi-Detached homes hit a record high in April.

Every category increased between 9.65%-14.3% over last month.  The only thing holding our sales from going higher seems to be the low inventory.


Sales Compared to 2020:

Normally this is a good category to watch however we are now comparing sales this year to when we were

in a collapsed market due to Covid and the First Shutdown.


  Jan Feb Mar Apr May June July Aug Sept Oct Nov Dec
2020 861 1190 1175 573 1080 1747 1835 80 1702 1764 1437 1199
2021 1208 1836 2903 3209                
Change +347 +646 +1729 +2639                
% change +7.49 +54.4 247% +562%                


Calgary Real Estate Benchmark Sales Prices:

Overall, the Benchmark Price for all sectors increased by $9,500.  The smallest increase was in the Apartment condo sector at $1,900 and the largest increase was in the detached home sector which increased by $12,800.  All other sectors were in between.  Interesting how the sectors with the lowest months of inventory are showing the highest price increases.  Truly supply and demand in at play here.


Current Months of Inventory (Absorption Rate): 

There was very little change in the Months of Inventory during April.   Detached and Semi-Detached decreased by .07 and .14 respectively.  Attached Row and Apartment Condos increased by .06 and .27 respectively.  With the months of Inventory where they are, I can only predict that prices will continue to increase with possibly the exception of Apartment Condos.


It is also important to note that these numbers vary by community, and by price range.  If you would like numbers for your community, or more specific numbers for your home please contact us.

Below is a summary of numbers in chart form.  All numbers are taken from the Calgary Real Estate Boards monthly Stats package.
Stats Photo

Sept 2013 Calgary Real Estate Market Snapshot

Monday, September 2nd, 2013

Want to know what’s really happening in the Calgary Real Estate Market.  The market is driven by supply and demand so here we show the inventory (supply) and sales (demand) and the effect on the price of Calgary Real Estate.   In summary the Calgary housing market is still entrenched is a Sellers Market with limited supply and strong sales.

Below are the details along with a few comments, all numbers were taken  from the Calgary Real Estate Boards Stats package for Realtors.

Calgary Listing Inventory:  Inventory levels for all categories except townhouses decreased again throughout August.

Inventory 

July  2013    

August  2013   

Change

Single Family Home

2917

2791

-126

Condo    Townhouse

407

417

10

Condo    Apartment

768

690

-78

Total

4092

3898

-194

Calgary Sales: 

Sales decreased marginally in all categories this month.  This is very normal as many people are focused on summer vacations, back to school etc.  The other reason for this is that listings are so low that good homes are challenging to find.

Sales

July  2013 

August  2013  

Change

% Change

Single   Family Home

1575

1517

-59

-3.6%

Condo  Townhouse

295

282

-13

-.44%

Condo   Apartment

398

397

-1

Total

2268

2196

          -72

-3.2%


Calgary Real Estate Sales Prices:  

In August, the benchmark price increased slightly for all categories.  This is simply a reflection of demand outpacing supply Mens andre nettsider hovedsakelig fokuserer pa norske spilleautomater pa nett, onsker vi ogsa a servere deg informasjon om de ekte maskinene. and this trend will continue until the inventory starts to increase faster than sales.

Sales Prices

July 2013

Benchmark Price

August  2013

 Benchmark Price  

Change

Single   Family Homes

461,600

464,700

3,100

Condo   Townhouse

294,500

298,500

4,000

Condo  Apartment

267,600

270,600

3,000


Sales Prices  “Year to Date”   

Year to date prices have increased in all categories.

Sales Prices Dec  31 2012    Benchmark Price 

August 2013

Benchmark Price 

Change

% Change

Single   Family Homes

434,800

464,700

29,900

6.9%

Condo   Townhouse

284,100

298,500

14,400

5.1%

Condo  Apartment

248,700

270,600

21,900

8.8%

 Absorption Rate (Months of Inventory)   (the inventory divided by the number of sales in the last month). What does this mean you might ask?

Buyer’s Market

>4.0

Balanced Market

Between 2.8 to 4.0

Seller’s Market

<2.8

Absorption Rate:  Throughout August our absorption rate decreased in all categories except townhouses. With inventory shrinking faster than sales are slowing it is now pushing us into a stronger “Sellers market position”.

Absorption Rate  

July 2013 

August 2013  

Change

Single   Family Homes

1.85

1.84

-.01

Condo   Townhouse

1.37

1.47

.1

Condo  Apartment

1.93

1.74

-.19

Total   Calgary

1.80

1.78

-.02

**Please note that these numbers do change on a community basis and more so for towns.  If you would like to find stats on your community just let me know.  If you have any questions about this summary, the attached stats package or any Real Estate questions please feel free to contact us.

In Other News:

Rumor on the street is that CMHC has hit their annual $ limit for mortgage insurance so getting this product might be a little more difficult.

Interest Rates are on the rise – if you are even considering making a move talk  to your bank or mortgage broker  and get a mortgage commitment locked in at today’s rates.

Sign up for your personalized Market Report for your Community : http://www.calgaryareasolds.com/

Gord Piper

April’s Calgary Real Estate Market Snapshot

Tuesday, April 30th, 2013

Want to know what is really happening in Calgary’s Real Estate Market.  Bottom line Real Estate is all about supply and demand so that is our focus here.  Below you will find a summary of some key Factors  with a few short comments.  In summary the Calgary housing market is very strong.  Sales are strong and our inventory is on the low side making it a Seller’s market.   All numbers below are taken from the Calgary Real Estate Boards Stats Package for Realtors.

Calgary Listing Inventory:  Inventory levels for all categories increased throughout April.  Seeing our inventory increase is very normal at this time of year as many people wait until spring to list their homes.   This trend of increasing inventory should continue for the next few months.        

Inventory 

March 2013  

April   2013   

Change

Single Family Home

2727

2977

+250

Condo    Townhouse  

484

518

+34

Condo    Apartment 

796

871

+75

Total

4007

4366

+359

 Calgary Sales: 

Sales increased in all categories this month.  What is important here is that our sales increased at a higher rate than our inventory putting us into an even stronger sellers market than last month.  What I am seeing is that  good single family homes in the lower price ranges are harder to find and therefore we are seeing more buyers moving into the townhouse market, the condominium market and surrounding towns.  

Sales

March  2013

April  2013  

Change

% Change

Single   Family Home

1480

1611

+131

+8.8%

Condo  Townhouse    

283

341

+58

+20.4%

Condo   Apartment

347

429

+82

+23.6%

Total

2110

2381

+271

+12.84

 Calgary Real Estate Sales Prices:  Please note that we are now using the Benchmark price for this comparison.

In April the benchmark price increased slightly for all categories. This is simply a reflection demand outpacing supply and may continue until the inventory starts to increase faster than sales.   


Sales Prices

March  2013

Benchmark Price

April, 2013

 Benchmark Price  

Change

Single   Family Homes

446,500

452,900

+$6,400

Condo   Townhouse  

286,800

288,900

+$2,100

Condo  Apartment    

257,700

261,300

+$3,600


Sales Prices  “Year to Date”   

Once again we saw increases in all categories.   

Sales Prices

Dec  31 2012    Benchmark Price 

April 2013

Benchmark Price 

Change

% Change

Single   Family Homes

434,800

452,900

+18,100

+4.2%

Condo   Townhouse  

284,100

288,900

+4,800

+1.7%

Condo  Apartment    

248,700

261,300

+12,600

+5.1%

 Absorption Rate (Months of Inventory)   (the inventory divided by the number of sales in the last month). What does this mean you might ask?

Buyer’s Market

>4.0

Balanced Market

Between 2.8 to 4.0

Seller’s Market

<2.8


Absorption Rate  

March  2013

April  2013  

Change

Single   Family Homes

1.84

1.85

+.01

Condo   Townhouse  

1.71

1.52

– .19

Condo  Apartment    

2.29

2.03

– .26

Total   Calgary

1.90

1.83

– .07


                                                                                Yes, we are in a Sellers Market  

As you can see above we are in a Seller’s market for all categories and it is getting stronger in favour of sellers. Please note that these numbers do change on a community basis and more so for towns.  If you would like to find stats on your community just let me know.  

If you have any questions about this summary, the attached stats package or any Real Estate questions please feel free to contact us.  

If you know anyone else who might enjoy seeing our monthly summary please feel free to share.

Gord, Eric & Brent

December 2011, Monthly Housing Stats Report

Monday, January 2nd, 2012

What”s happening in the Calgary Real Estate market?

  The stats below are taken from information supplied to realtors through the Calgary Real Estate Board.  As Real Estate is all about supply and demand that is what this article will focus on :

  • Our Inventory
  • Our Sales
  • and of course Prices

  As we are at a year-end I am providing both monthly and then yearly results.

Calgary Listing Inventory:  Inventory levels for both Single Family homes and Condo’s decreased substantially this month.   This movement is normal for this time of year as many people do not want their home on the market during the holiday season.  Expect that starting January our listing inventory will start to creep upwards.

Inventory   November 2011  December  2011 Change
Single Family Home 3761 2761 Decrease of 1000
Condo’s 1676 1287 Decrease of 389
Total 5437 4048 Decrease of 1389

 Calgary Listing Inventory year to date.  Very Similar numbers compared to last year.  

Inventory  Dec 2010  December  2011 Change
2712 2761 49
Condo’s 1429 1287 -142
Total 4141 4048 -97

Calgary Sales: 

Calgary Single Family home sales and Condo sales for the month of December declined slightly from November.  Again the holiday season can account for this trend.         

Sales November 2011 December 2011 Change
Single Family Home 962 722 -240
Condo’s 391 310 -81
Total 1353 1032 -321

Calgary Sales Year to Date

Sales for both single family homes and condos showed an increase over 2010, a very positive sign moving forward.

Sales Total  2010  Total  2011 Change % Change
Single Family Home 12,091 13,186 1095 9.06%
Condo’s 5,176 5,382 206 3.98%
Total 17267 18,568 1301 7.53%

Calgary Real Estate Sales Prices:  In 2011 Single family home prices decreased by $9,175 while the median price of condo’s increased by $5,875.  The median prices are not showing any certain direction but are bouncing up and down every month.  Let’s look at the year to date numbers download free action game for girls below to really see what’s happening.

Sales Prices November Median Prices December  Median Prices Change
Single Family Homes $402,925 $393,750 -$9,175
Condo’s $252,000 $257,875 $5,875

 *** Calgary Real Estate Sales Prices Year to Date

As you can see from the chart below the Median Sales price of both single family homes and condos remained almost constant this year.  We had a bit of a roller coaster with prices bouncing up and down but they are not showing a single direction.

   End of 2010 End of 2011 Change % Change
Single Family Homes  $389,000 $393,750 $4,750 1.2%
Condo’s  $260,000 $257,875 -$2.125 -.82%


Forecast for 2012

On the 18th of January the Calgary Real Estate Board put’s on their annual forecast breakfast where they bring in experts and share the forecasts for 2012.  As soon as the forecasts are available I will summarize for you.  

If you have any questions about this summary, or would like a full copy of the December Stats package please contact us

Gord, Eric & Brent

Check out our new Market Snapshot – a monthly look at active and sold listings in your community.

November 2011 Calgary Real Estate Market Snapshot

Friday, December 2nd, 2011

It is our pleasure to provide key information from the Calgary Real Estate Boards monthly stats package and add a few short comments to help you really understand what is happening in the market.   The key areas that we look at include Inventory, Sales and the Median Price as this gives  a great snapshot of the market.

Calgary Listing Inventory:  Inventory levels for both Single Family homes and Condo’s decreased this month.   This is the first month in a long time that we have seen our inventory consistently decrease every week.  This movement is normal for this time of year as many people believe it is now better to wait till spring.

Inventory   October 2011  November 2011 Change
Single Family Home 4486 3761  Decrease of 725
Condo’s 1935 1676  Decrease of 259
Total 6421 5437 Decrease of 984

 Calgary Sales:  Calgary Single Family home sales for the month of November remained almost flat this month.  You may have read the news that says “sales are up” but that number is comparing sales to Nov 2010.  The normal trend at this time of year is to see sales drop so remaining flat is a sign of strength.        

Sales October 2011 November 2011 Change
Single Family Home 988 962 (26)
Condo’s 368 393 + 25
Total 1356 1355 (1)     

 Calgary Real Estate Sales Prices:  Single family home prices increased by $7,975 while the median price of condo’s decreased by $12,625.  The median prices are not showing any certain direction but are bouncing up and down every month.  Let’s look at the year to date numbers to really see what’s happening.

Single Family Home:  Dec 31, 2010 the median price was $406,000 so for the year the median price has decreased by $3,075

Condos:  Dec  31, 2010 the median price for condos was 267,250 compared to today at $250,000 showing a decrease of $17,250        

Sales Prices October Median Prices November Median Prices Change
Single Family Homes $395,000 $402,925 +$7,975
Condo’s $262,625 $250,000 $(12,625)

Overall we are still in a buyer’s market although with the decreased inventory levels and sales maintaining we are moving closer to a balanced market.

If you have any questions or comments about this snapshot please let us know.

For a full copy of the November Calgary Real Estate Boards Monthly Stats package please contact us.

Gord, Eric and Brent

October Monthly Housing Stats Report at a glance!

Wednesday, November 2nd, 2011

Trying to make sense of the Calgary Real Estate market?

Below I have reported key indicators on what is really happening in the Calgary Real Estate market.  All numbers are taken from the Monthly Stats report for Realtors prepared by the Calgary Real Estate Board.

Here is October’s summary.

Calgary Listing Inventory:  Inventory levels for Both Single Family homes and Condo’s decreased this month.  Inventory levels have moved both up and down so it is not showing a definite direction.

Inventory September 2011 October Change
Single Family Home 4753 4486 (267)
Condo’s 2008 1935 (73)
Total 6761 6421 (340)

 Calgary Sales: 

Calgary Single Family home sales for the month of October showed a slight decrease.  Sales for Condos,  however decreased by about 15% from September.   Sales numbers dropping is very normal at this time of year as the peak selling season is typically April through June.  Interestingly, sales for single family homes and condos beat sales levels for October 2010 and we are on track to have higher sales in 2011 than in 2010.       

Sales September 2011 October Change
Single Family Home 1036 988 (48)
Condo’s 429 368 (61)
Total 1465 1356 (109)


Calgary Real Estate Sales Prices:    For October Median prices for Single Family homes decreased by $5.000 while condo’s increased by $2,625.00 over September.  We seem to be bouncing up and down every month but overall prices are remaining fairly stable.      

Sales Prices September Median Prices October Change
Single Family Homes $400,000 $395,000 (5,000)
Condo’s $260,000 262,625 +2,625

 The median sales price of Single Family homes in January was 390,000 so we are up $5,000 for the year.

The Median sales price of Condos in January was $255,000 so we are up $7250 for the year.

Overall we are still in a buyer’s market where buyers have lots of selection and buyers although buying are looking for value.

If you have any questions about this summary please contact us.   

Gord Piper, Brent Wilcox & Eric Dennis

September 2011, Real Estate Market Snapshot

Sunday, October 2nd, 2011

Tired of sorting through all the reports and want a snapshot of whats happening in the Calgary Real Estate Market.  All data below has been taken from the Calgary Real Estate Boards monthly September 2011  Stats package for Realtors.

When trying to understand the market all we really need to know is supply and demand – the inventory and sales.  Of course you might want to know about prices too but what happens with prices is dependent on inventory and sales.  Below you will find this helpful information with a few of my own comments.

Calgary Listing
Inventory:
Inventory levels for both Single Family homes and Condo’s increased only marginally this month and going  up and down so it is not showing a definite direction.

Inventory August
2011
September
2011
Change
Single Family Home 4573 4753 +180
Condo’s 1997 2008 +11
Total 6570 6761 +191

Calgary Sales:

Calgary sales for the month of September showed small decreases
for single family homes and for condos. Sales numbers dropping is very normal at this time of year as the peak selling season is typically April through
June.  Interestingly, sales for single family homes in September were 10.6% higher than in Sept 2010 and sales for Condo’s were 17.2% higher than in 2010.     

Sales August
2011
September
2011
Change
Single Family Home 1106 1036 (70)
Condo’s 468 429 (39)
Total 1574 1465 (109)

Calgary Real Estate Sales Prices:

For September Median prices for Single Family homes decreased by $2,251 while condo’s increased by $5,000 over August.  We seem to be bouncing up and down every month but overall prices are remaining stable.

Sales Prices August
Median Prices 2011
September Median Prices Change
Single Family Homes $402,251 $400,000 ($2251)
Condo’s $255,000 $260,000 +$5,000

Overall we are still in a buyer’s market – however a slightly stronger Buyers market than last month with inventory going up and sales going down our turnover rate has increased.

If you have any questions about this summary, the attached
stats package or any Real Estate questions please feel free to contact us.

Free no obligation Home Evaluation

Gord Piper & Brent Wilcox

CIR Realty

What’s happening in the Calgary Real estate market?

Saturday, September 3rd, 2011

This report gives you information on all the important indicators on whats happening in Calgary.  Real time, Real Estate Market stats at a glance for the Month of August 2011.  These stats  break the market down into what’s important and eliminates all the extra. Data is from the August Calgary Real Estate Boards Monthly stats package.

Calgary Listing
Inventory:
Inventory levels for Both Single Family homes and Condo’s stayed very flat this month.  This is generally a good number however with sales levels it would balance the market a little more if our inventory dropped slightly.

Inventory July
2011
August
2011
Change
Single Family Home 4630 4573 (57)
Condo’s 2003 1997 (6)
Total 6633 6570 (63)

Calgary Sales:

Calgary sales for the month of August showed marginal decreases for single family homes and a slight increase for condos. Sales numbers dropping is very normal at this time of year as the peak selling season is typically April through June.  Interestingly
sales in August 2010 were 865 Single family homes and 468 condos for a total of
1333 showing an increase of 18% this year over last.    

Sales July  2011 August
2011
Change
Single Family Home 1153 1106 (47)
Condo’s 453 468 +15
Total 1606 1574 (32)

Calgary Real Estate
Sales Prices:
Median prices for Single Family homes decreased by $6,749 and condo’s decreased by $14,000 in August.  To me this is not alarming as the direction is not a trend.  We seem to bounce up and down every month but overall prices are remaining fairly stable.

Sales Prices July
Median Prices
August 2011 Change
Single Family Homes $409,000 $402,251 ($6749)
Condo’s $269,000 $255,000 ($14,000)

Overall we are still in a buyer’s market – this month we moved slightly more in favour of buyers as our inventory stayed flat while sales did show a slight decrease therefore increasing our absorption rate.

Check out our new technology – we can now send you a custom monthly report including, active listing, sold listings, days on market and much more –with easy
to understand graphs all based on your home by the postal code you enter. All
you have to do is sign up and once we approve you will get your own personal Market Snapshot. Simply Click here to sign up: www.calgaryareasolds.com

If you have any questions about this summary, the attached
stats package or any Real Estate questions please feel free to contact us
anytime.

Gord & Brent & Eric

May 2011, Calgary Real Estate Stats

Friday, June 3rd, 2011
Calgary Real Estate Board Stats for the month of May have been published and here is our summary  of some key areas with a few short comments. 

Calgary Listing Inventory:  As shown below our inventory in Calgary Metro increased by 308 listings this month.   This is very typical to see listings rise as spring arrives.  

Inventory  April  2011 May 2011 Change
Single Family Home 4395 4616 +221
Condo’s 2005 2092 +87
Total 6400 6708 +308
 Calgary Sales: 

Overall Calgary sales for the month of May increased slightly from April.  Single family home sales increased while condo sales decreased ever so slightly.  Interesting enough sales of Inner city homes increased by almost 4%    

Sales April 2011 May 2011 Change
Single Family Home 1217 1313 +96
Condo’s 535 503 -32
Total 1752 1816 +64
 Calgary Real Estate Sales Prices:    Prices for Single Family homes increased by $3,000 this month while condos increased by $8,500.  This makes sense as our inventory is holding steady and sales are remaining steady.  

Sales Prices April Median Prices May Median Prices Change
Single Family Homes $ 420,000 $423,000 +$3,000
Condo’s $260,000 $268,500 +$8,500
  

Absorption Rate:  When looking at Real estate stats it is imperative to look at the absorption rate.

Absorption rate is simply the total inventory divided by the number of sales in the last month.  An absorption rate of between 2.3 to 4.0 months reflects a balanced market while a higher rate reflects a buyer’s market and therefore a lower rate reflects a seller’s market.  From the chart below you can see that we are still in a slight buyers market.

 May Absorption Rate Chart

If you have any questions about this summary, the attached stats package or any Real Estate questions please feel free to contact us.  

Gord Piper  & Brent Wilcox                                                                                                                                                     

CIR Realty

403-861-2256

April 2011, Calgary Real Estate Board Statistics

Monday, May 2nd, 2011

As a Calgary Realtor we receive a monthly statistics package from the Calgary Real Estate Board and it is my pleasure to share with you some of the highlights.  As supply and demand is the basis for what happens in the market, we will simply look at inventory, sales and of course prices.  Hope you enjoy and if you would like a copy of the entire stats package or information regarding your community simply contact us.

Calgary Listing Inventory:  As shown below our inventory in Calgary Metro increased by 483 listings this month.   This is very typical to see listings rise as spring arrives.  

Inventory  March  2011 April 2011 Change
Single Family Home 4024 4395 371
Condo’s 1913 2005 92
Total 5937 6400 463

 Calgary Sales: 

Calgary sales for the month of April declined slightly from March for both single family homes and condos.   It is unknown at this point how much the changing mortgage rules have affected sales and we won’t really know for till the end of June when people’s pre-approvals from before the mortgage changes run out. My feeling is not very much which means sales could continue  very strong in the upcoming months.   

Sales March 2011 April 2011 Change
Single Family Home 1355 1217 -138
Condo’s 581 535 -46
Total 1936 1752 -184


Calgary Real Estate Sales Prices :    Prices for  Single Family homes increased by $20,000 this month while condos increased by $4,000.  This makes sense as our inventory is holding steady and sales are strong.  

Sales Prices March Median Price April Median Prices Change
Single Family Homes $400,000 $ 420,000 20,000
Condo’s $256,000 $260,000 4,000

 If you have any questions about this summary, the attached stats package or any Real Estate questions please feel free to contact us anytime.  

Gord Piper & Brent Wilcox

CIR Realty

403-861-2256

www.gordpiper.com