What is really happening in the Calgary Real Estate Market?
The market is a result of Supply and Demand therefore we look at both Supply (inventory) and Demand (Sales) and the relationship between the two. We also update you on the current benchmark price for all housing sectors.
Following is a graph that shows the months of inventory for each housing sector. Looking at a 2-year trendline gives you an indication of where things are really heading.
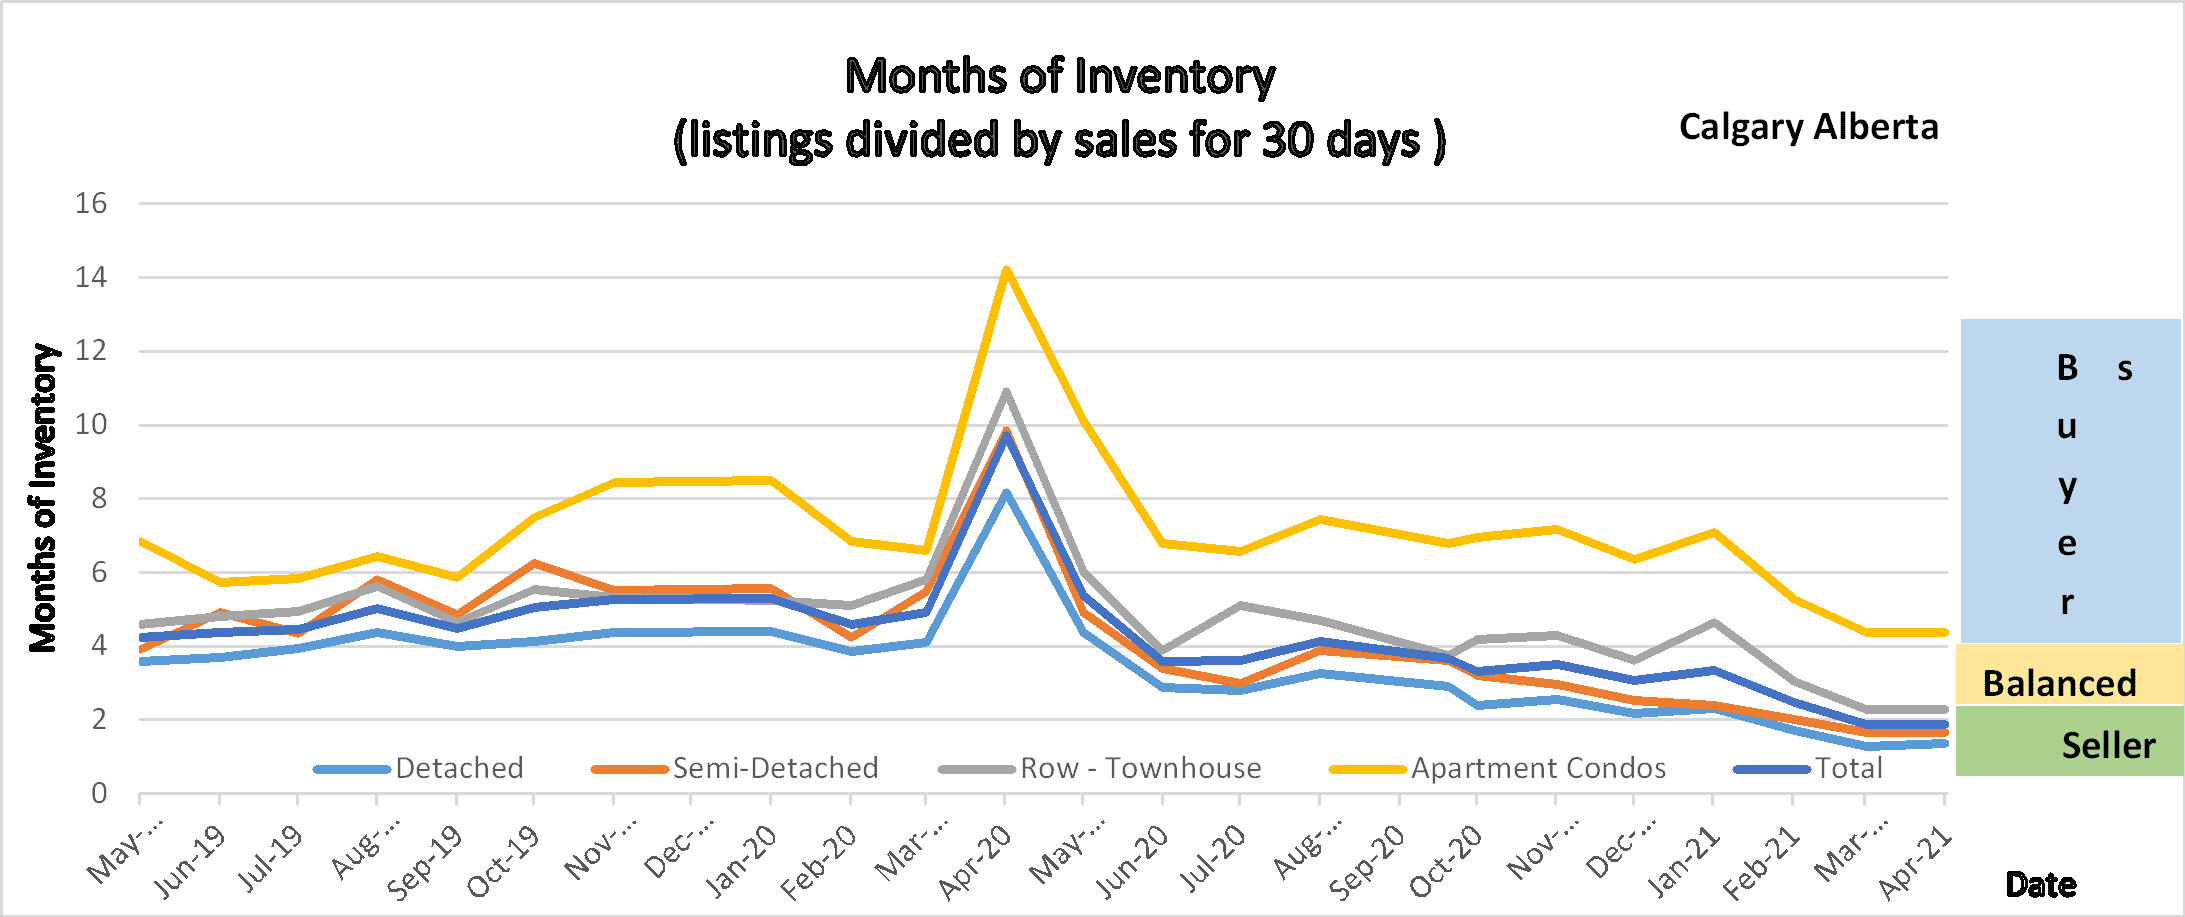
The graph shows the 2-year trend of the number of months of Inventory for all housing sectors within the Calgary Real Estate Market.
Gord’s commentary for the month (just my opinion).
Wow, another huge month for Real Estate in Calgary. In addition to Detached homes being in a seller’s market position, Semi-Detached and Attached Rowhouses have joined that category leaving only Apartment condos in the balanced market territory.
Calgary Listing Inventory
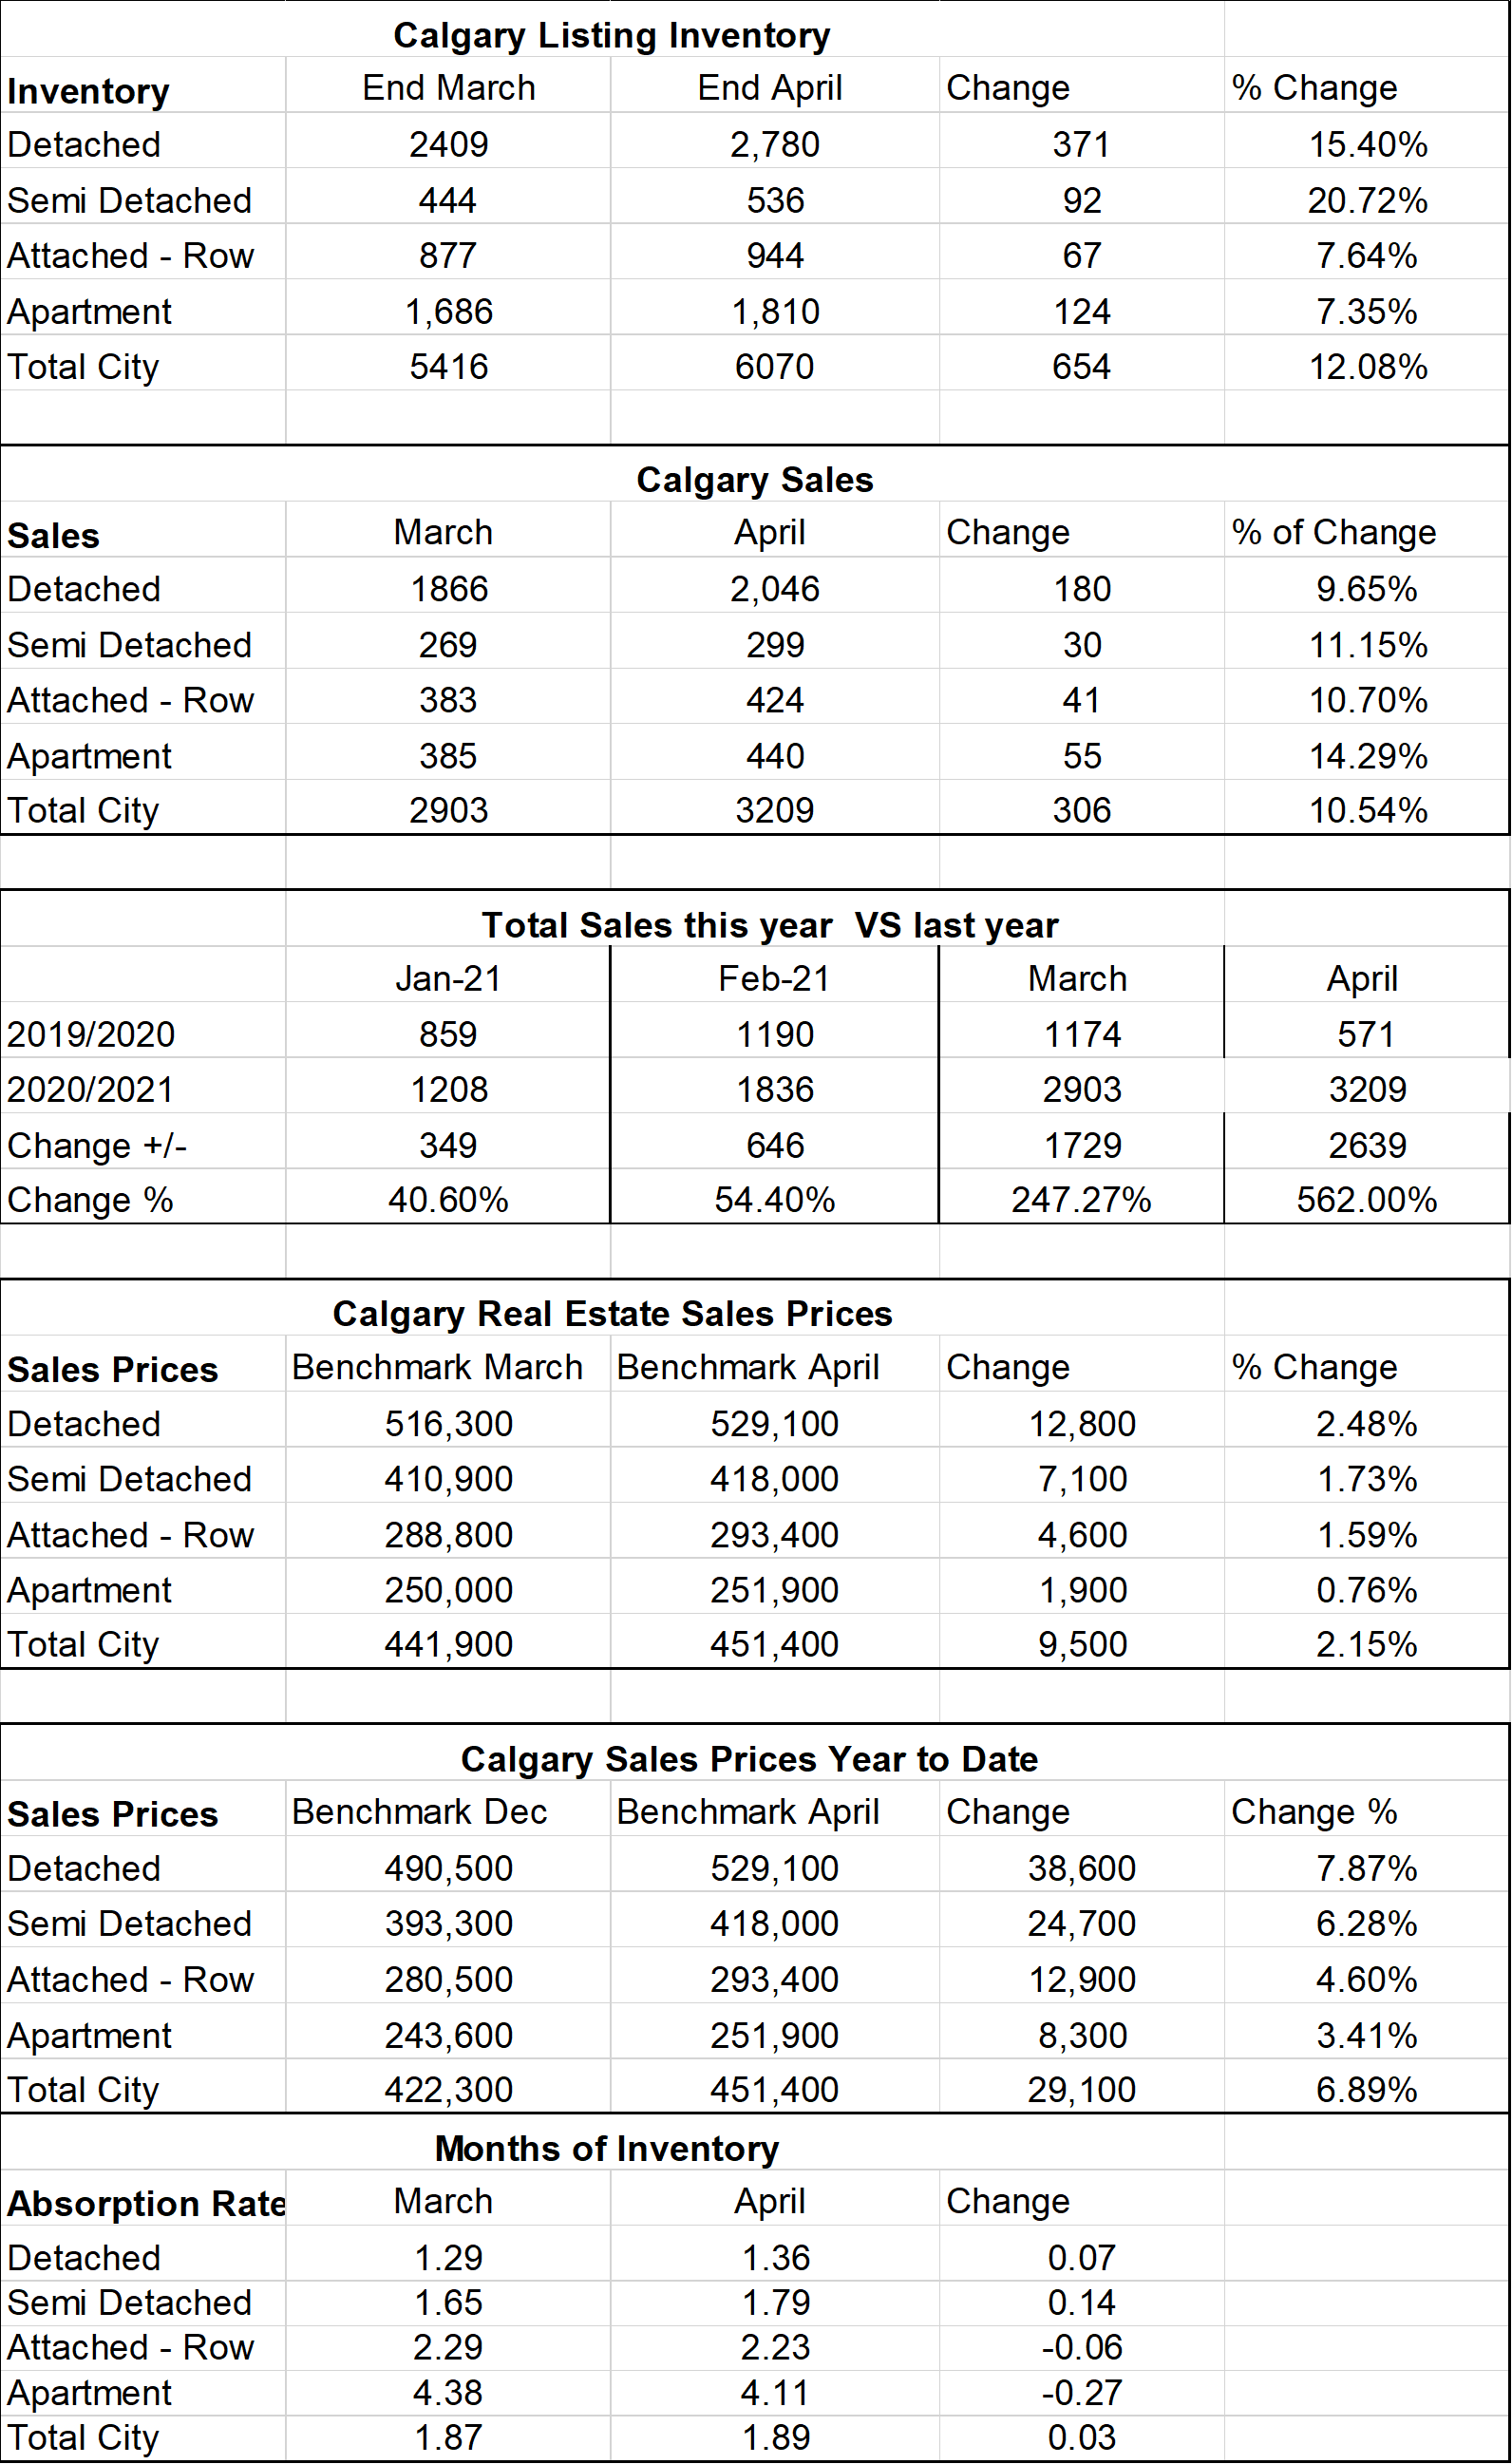
In April we saw the inventory for homes in all sectors increase by approx. 12%
The number of new listings in April was 4670 compared to 4441 for March so a 5% increase.
It seems that most of the new listings are still immediately turning in sales.
Calgary Sales:
Calgary Sales are soaring. Detached homes and Semi-Detached homes hit a record high in April.
Every category increased between 9.65%-14.3% over last month. The only thing holding our sales from going higher seems to be the low inventory.
Sales Compared to 2020:
Normally this is a good category to watch however we are now comparing sales this year to when we were
in a collapsed market due to Covid and the First Shutdown.
| Jan | Feb | Mar | Apr | May | June | July | Aug | Sept | Oct | Nov | Dec | |
| 2020 | 861 | 1190 | 1175 | 573 | 1080 | 1747 | 1835 | 80 | 1702 | 1764 | 1437 | 1199 |
| 2021 | 1208 | 1836 | 2903 | 3209 | ||||||||
| Change | +347 | +646 | +1729 | +2639 | ||||||||
| % change | +7.49 | +54.4 | 247% | +562% |
Calgary Real Estate Benchmark Sales Prices:
Overall, the Benchmark Price for all sectors increased by $9,500. The smallest increase was in the Apartment condo sector at $1,900 and the largest increase was in the detached home sector which increased by $12,800. All other sectors were in between. Interesting how the sectors with the lowest months of inventory are showing the highest price increases. Truly supply and demand in at play here.
Current Months of Inventory (Absorption Rate):
There was very little change in the Months of Inventory during April. Detached and Semi-Detached decreased by .07 and .14 respectively. Attached Row and Apartment Condos increased by .06 and .27 respectively. With the months of Inventory where they are, I can only predict that prices will continue to increase with possibly the exception of Apartment Condos.
It is also important to note that these numbers vary by community, and by price range. If you would like numbers for your community, or more specific numbers for your home please contact us.
Below is a summary of numbers in chart form. All numbers are taken from the Calgary Real Estate Boards monthly Stats package.
Stats Photo
