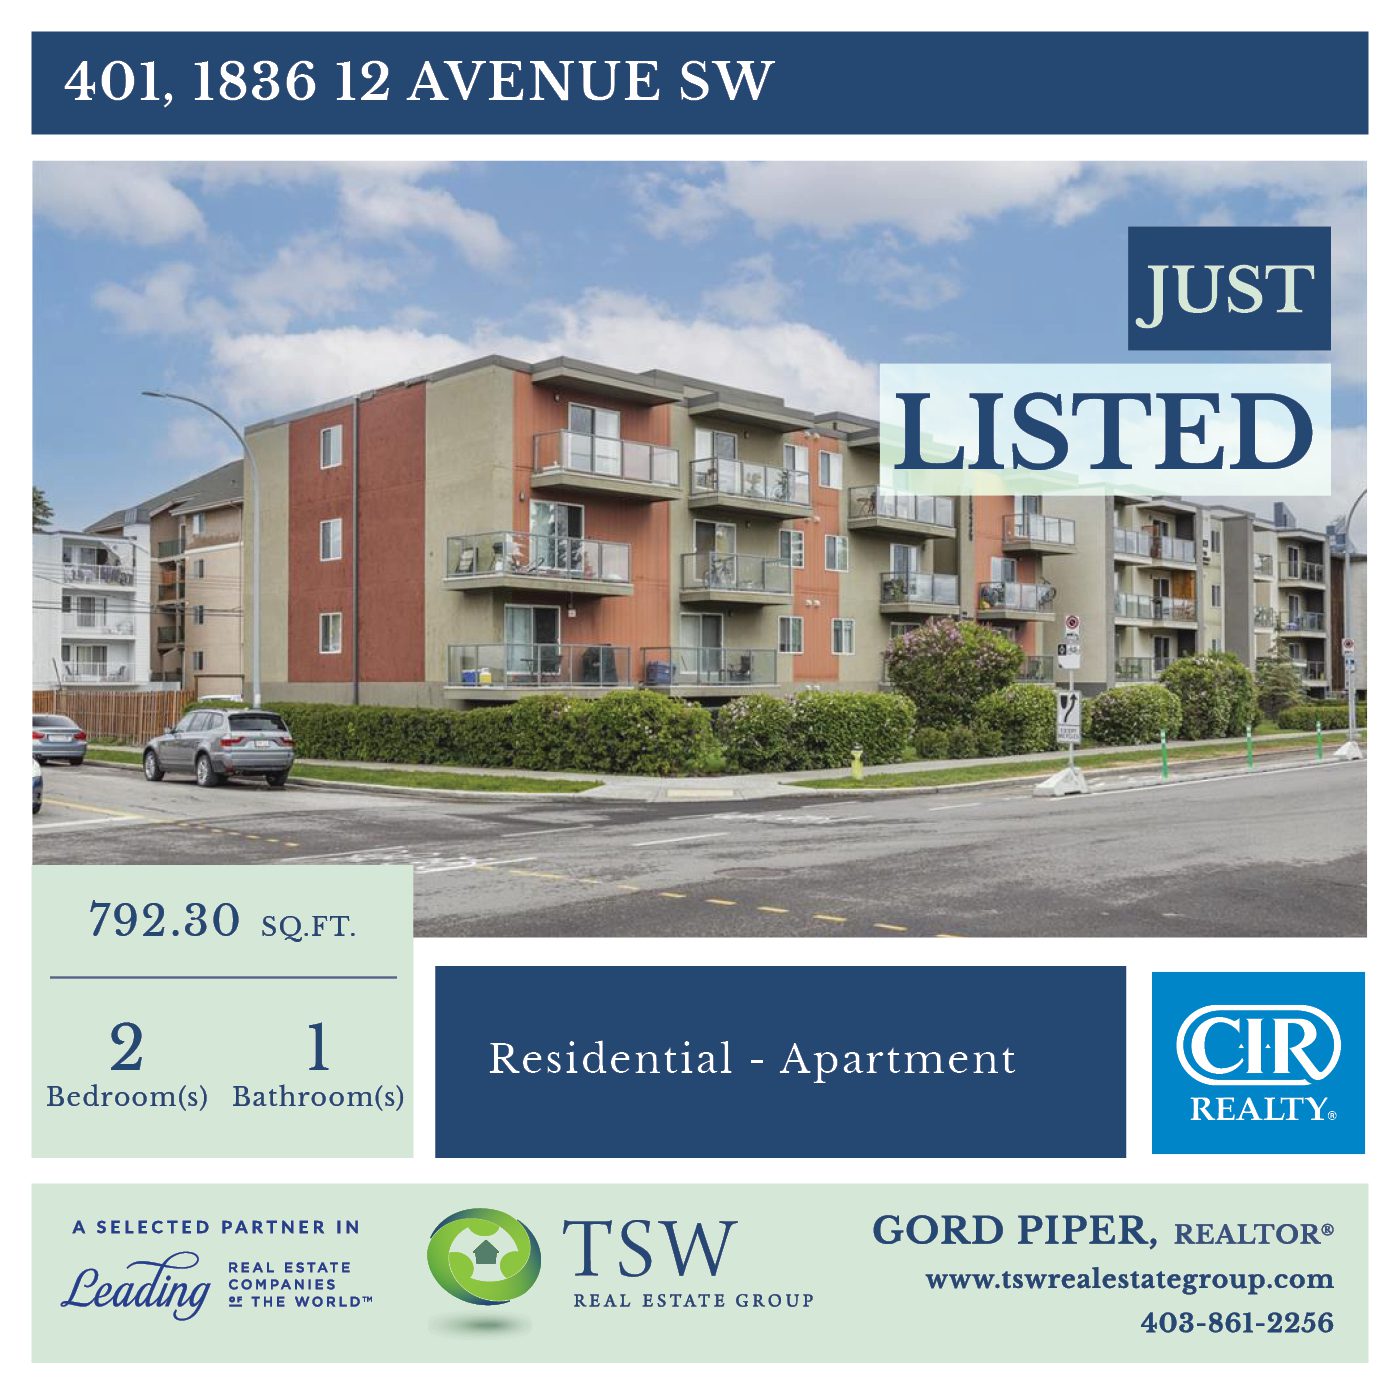
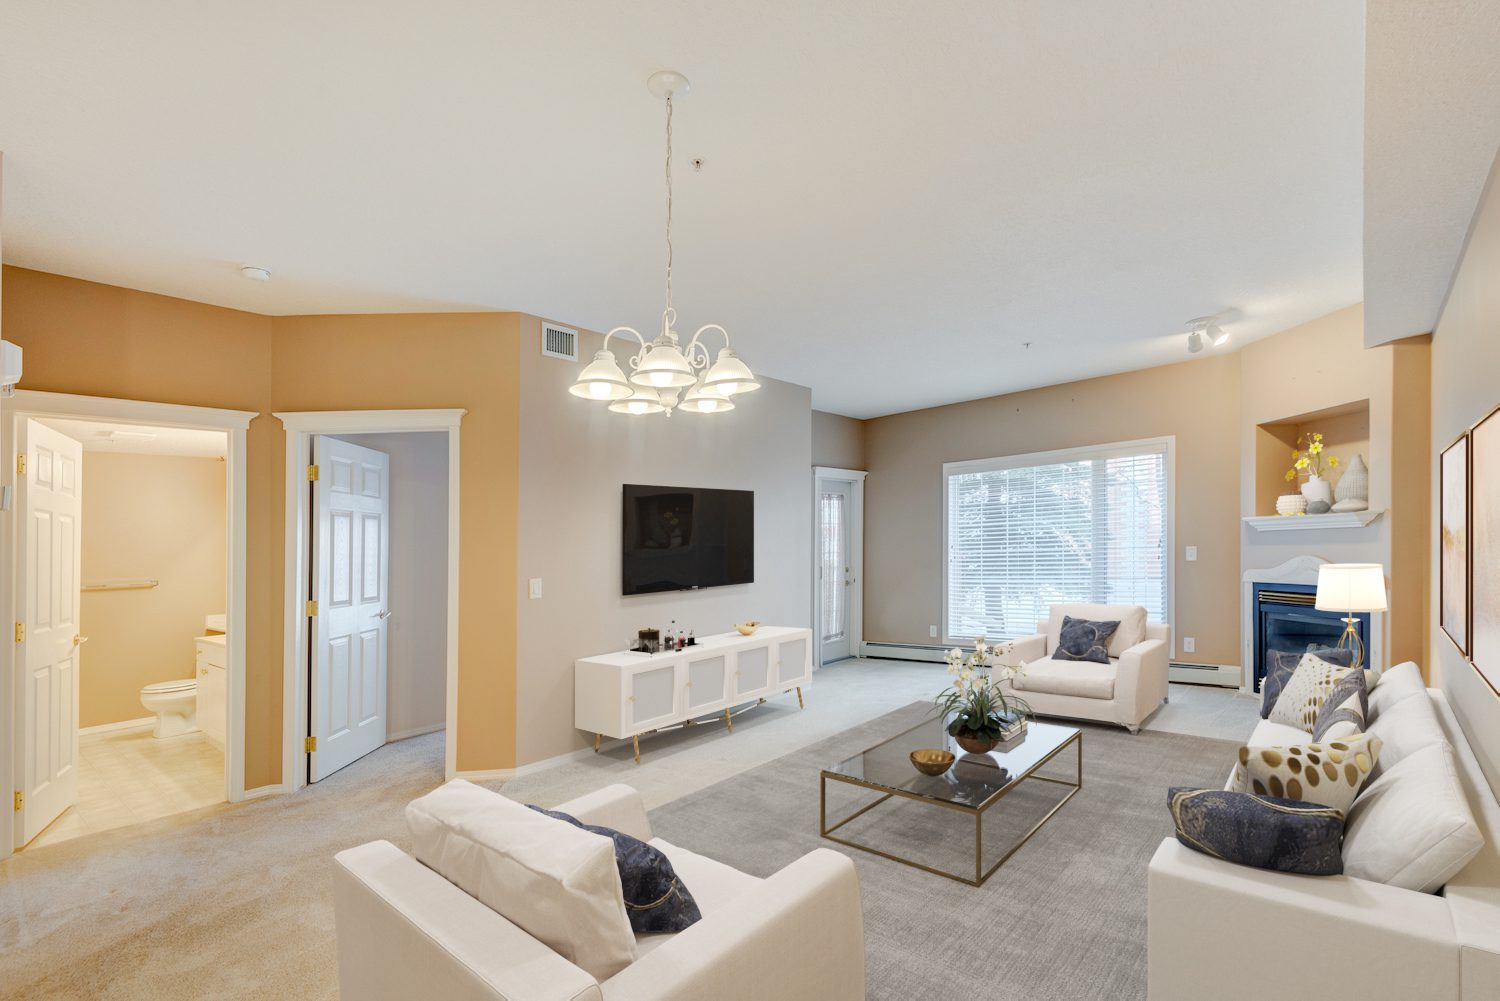
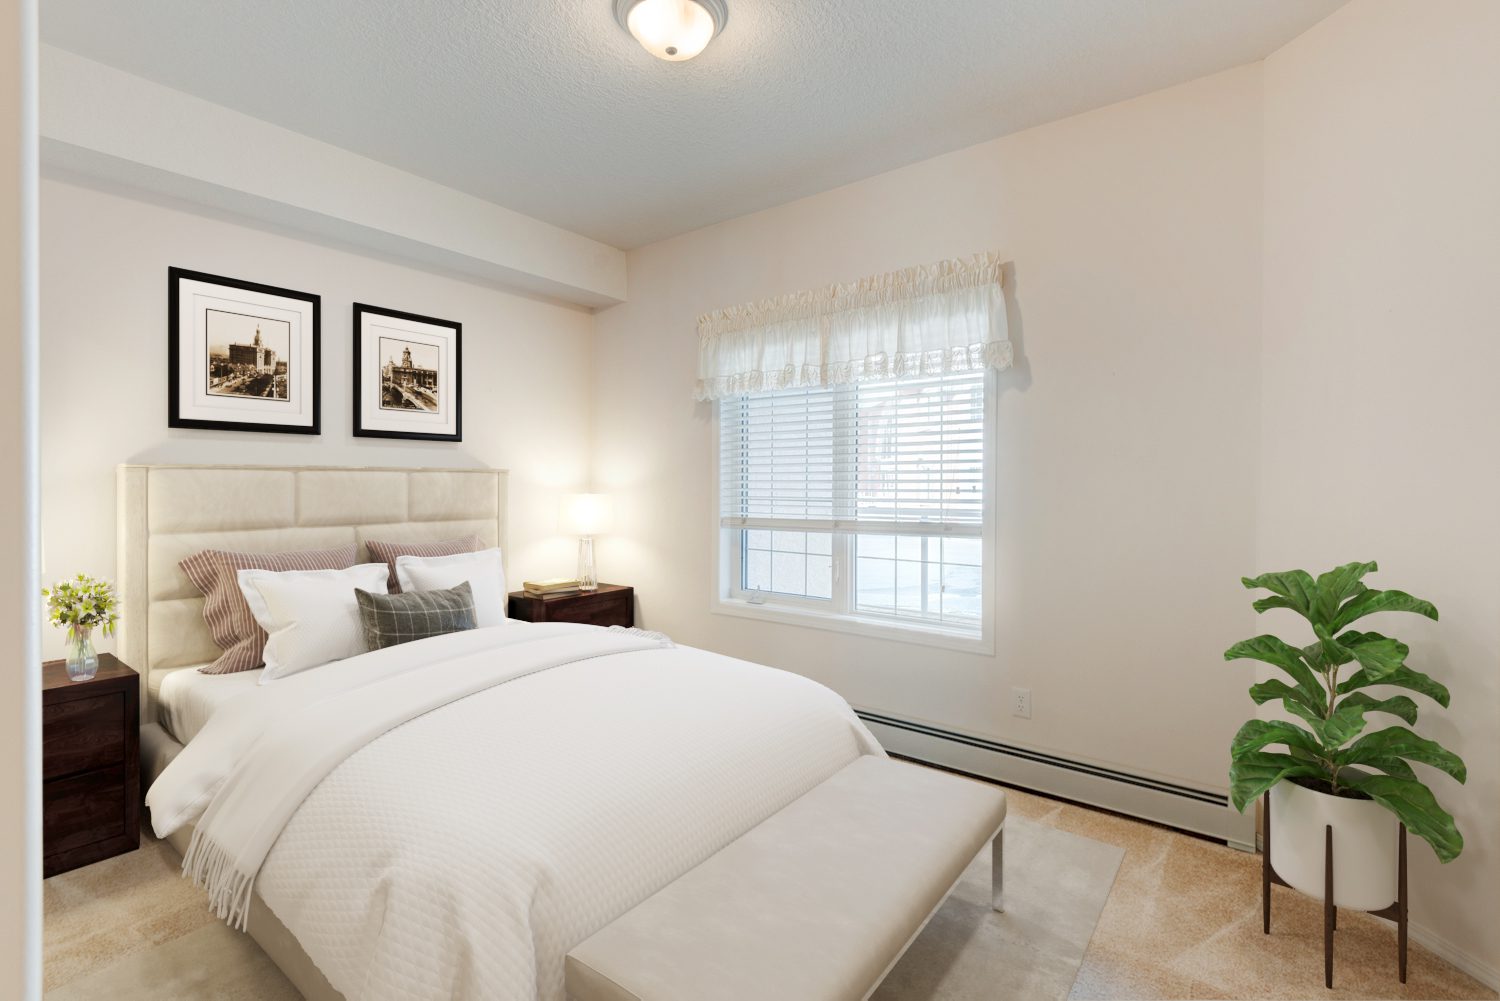
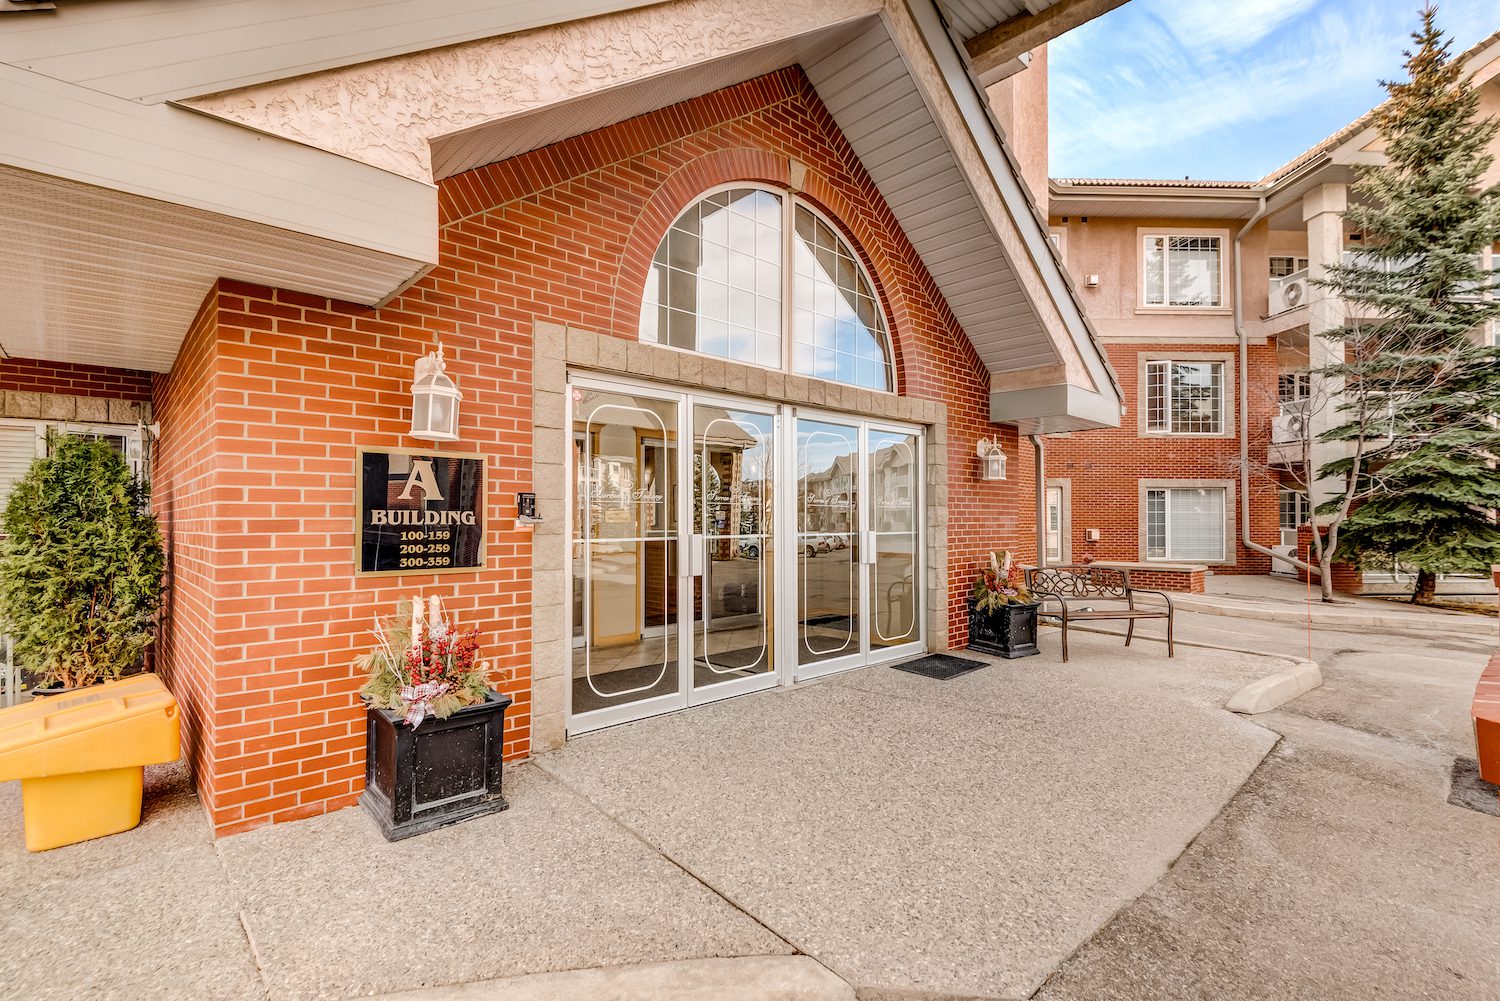
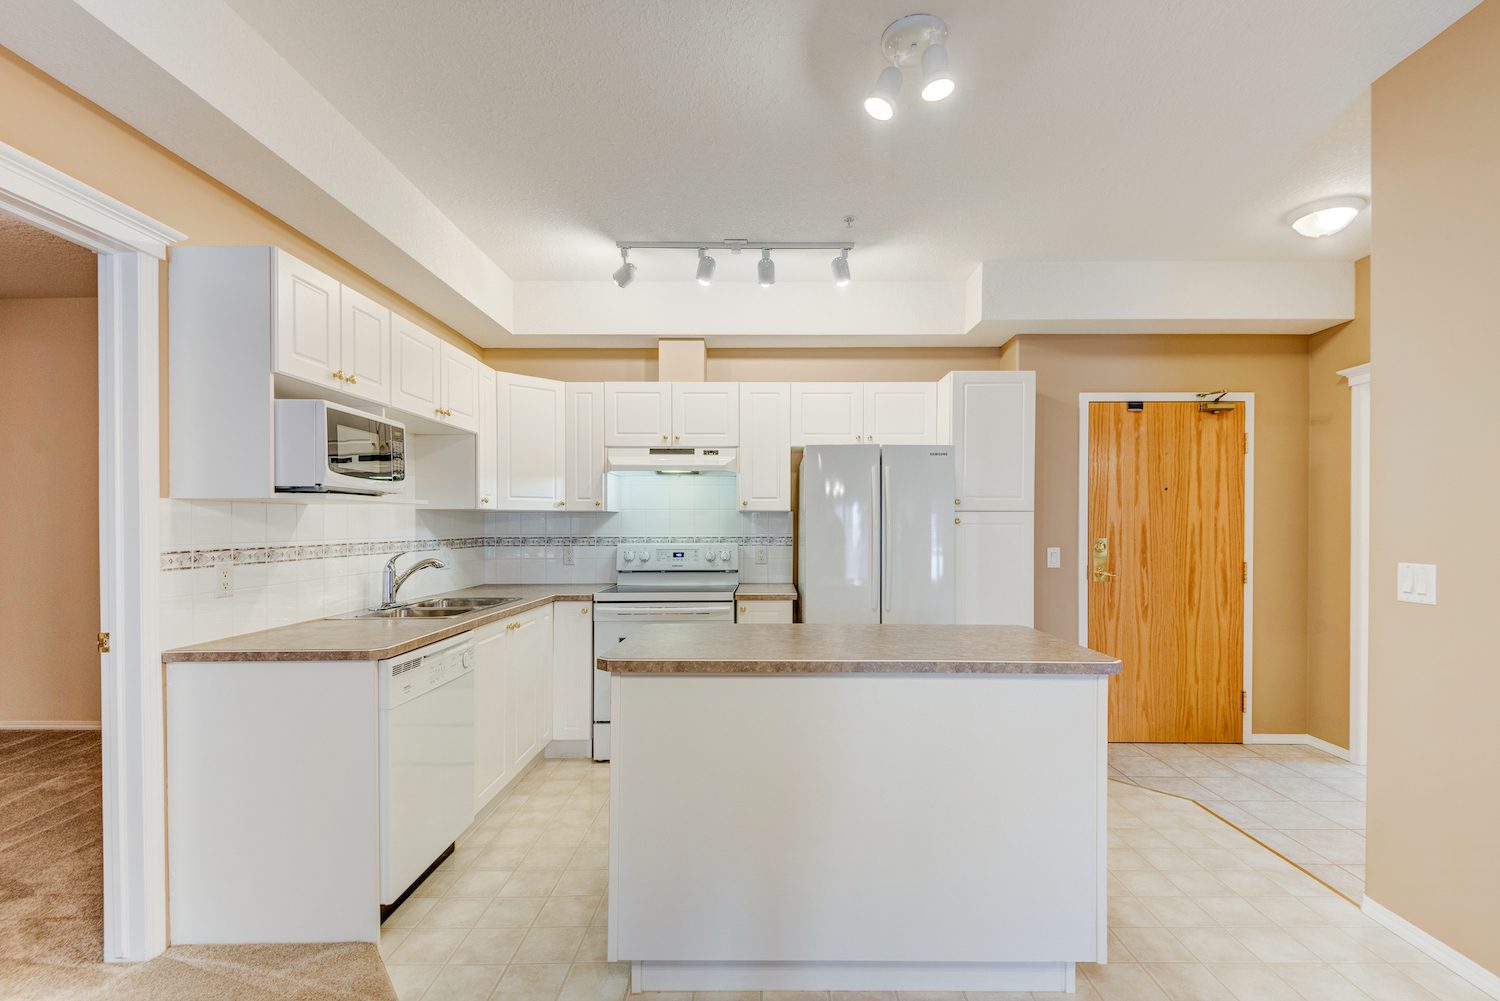
Just listed this awesome unit
Highlights: Top Floor, Open Concept Living and Per Friendly!
MLS: A1230355
Link to More Details: https://www.tswrealestategroup.com/for-sale/401-1836-12-avenue-sw–75384583
Just listed this awesome unit
Highlights: Top Floor, Open Concept Living and Per Friendly!
MLS: A1230355
Link to More Details: https://www.tswrealestategroup.com/for-sale/401-1836-12-avenue-sw–75384583
What is really happening in the Calgary Real Estate Market?
Change is happening
Following is a graph that shows the months of inventory for each housing sector. Looking at a one-year trendline gives you an indication of where things are really heading.
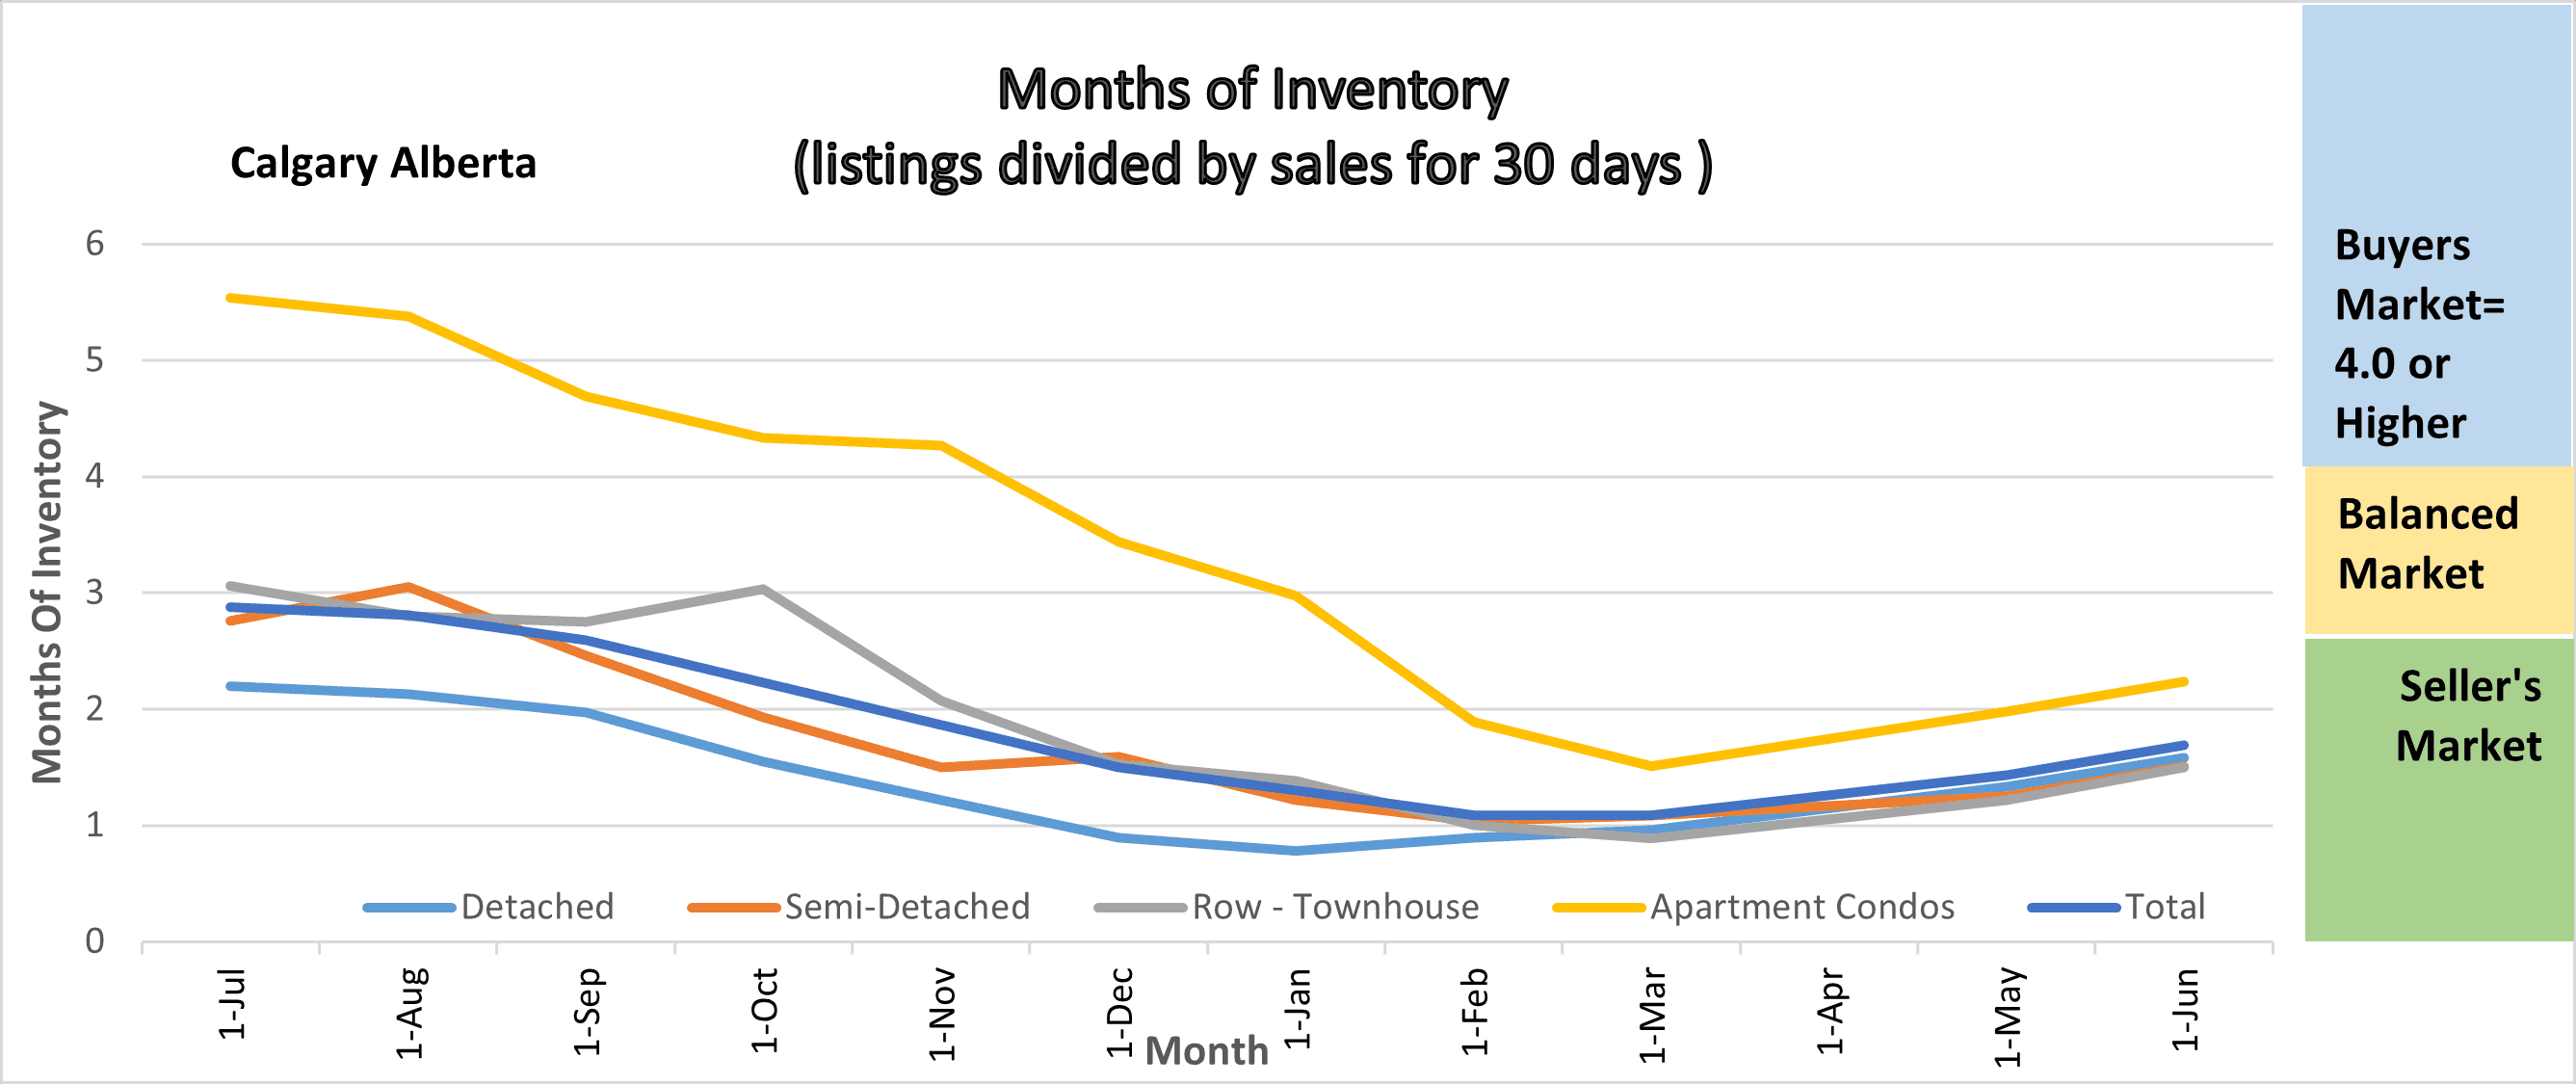
Months of Inventory
Gord’s commentary for the month (just my opinion).
May 2022 Highlights
Calgary Listing Inventory
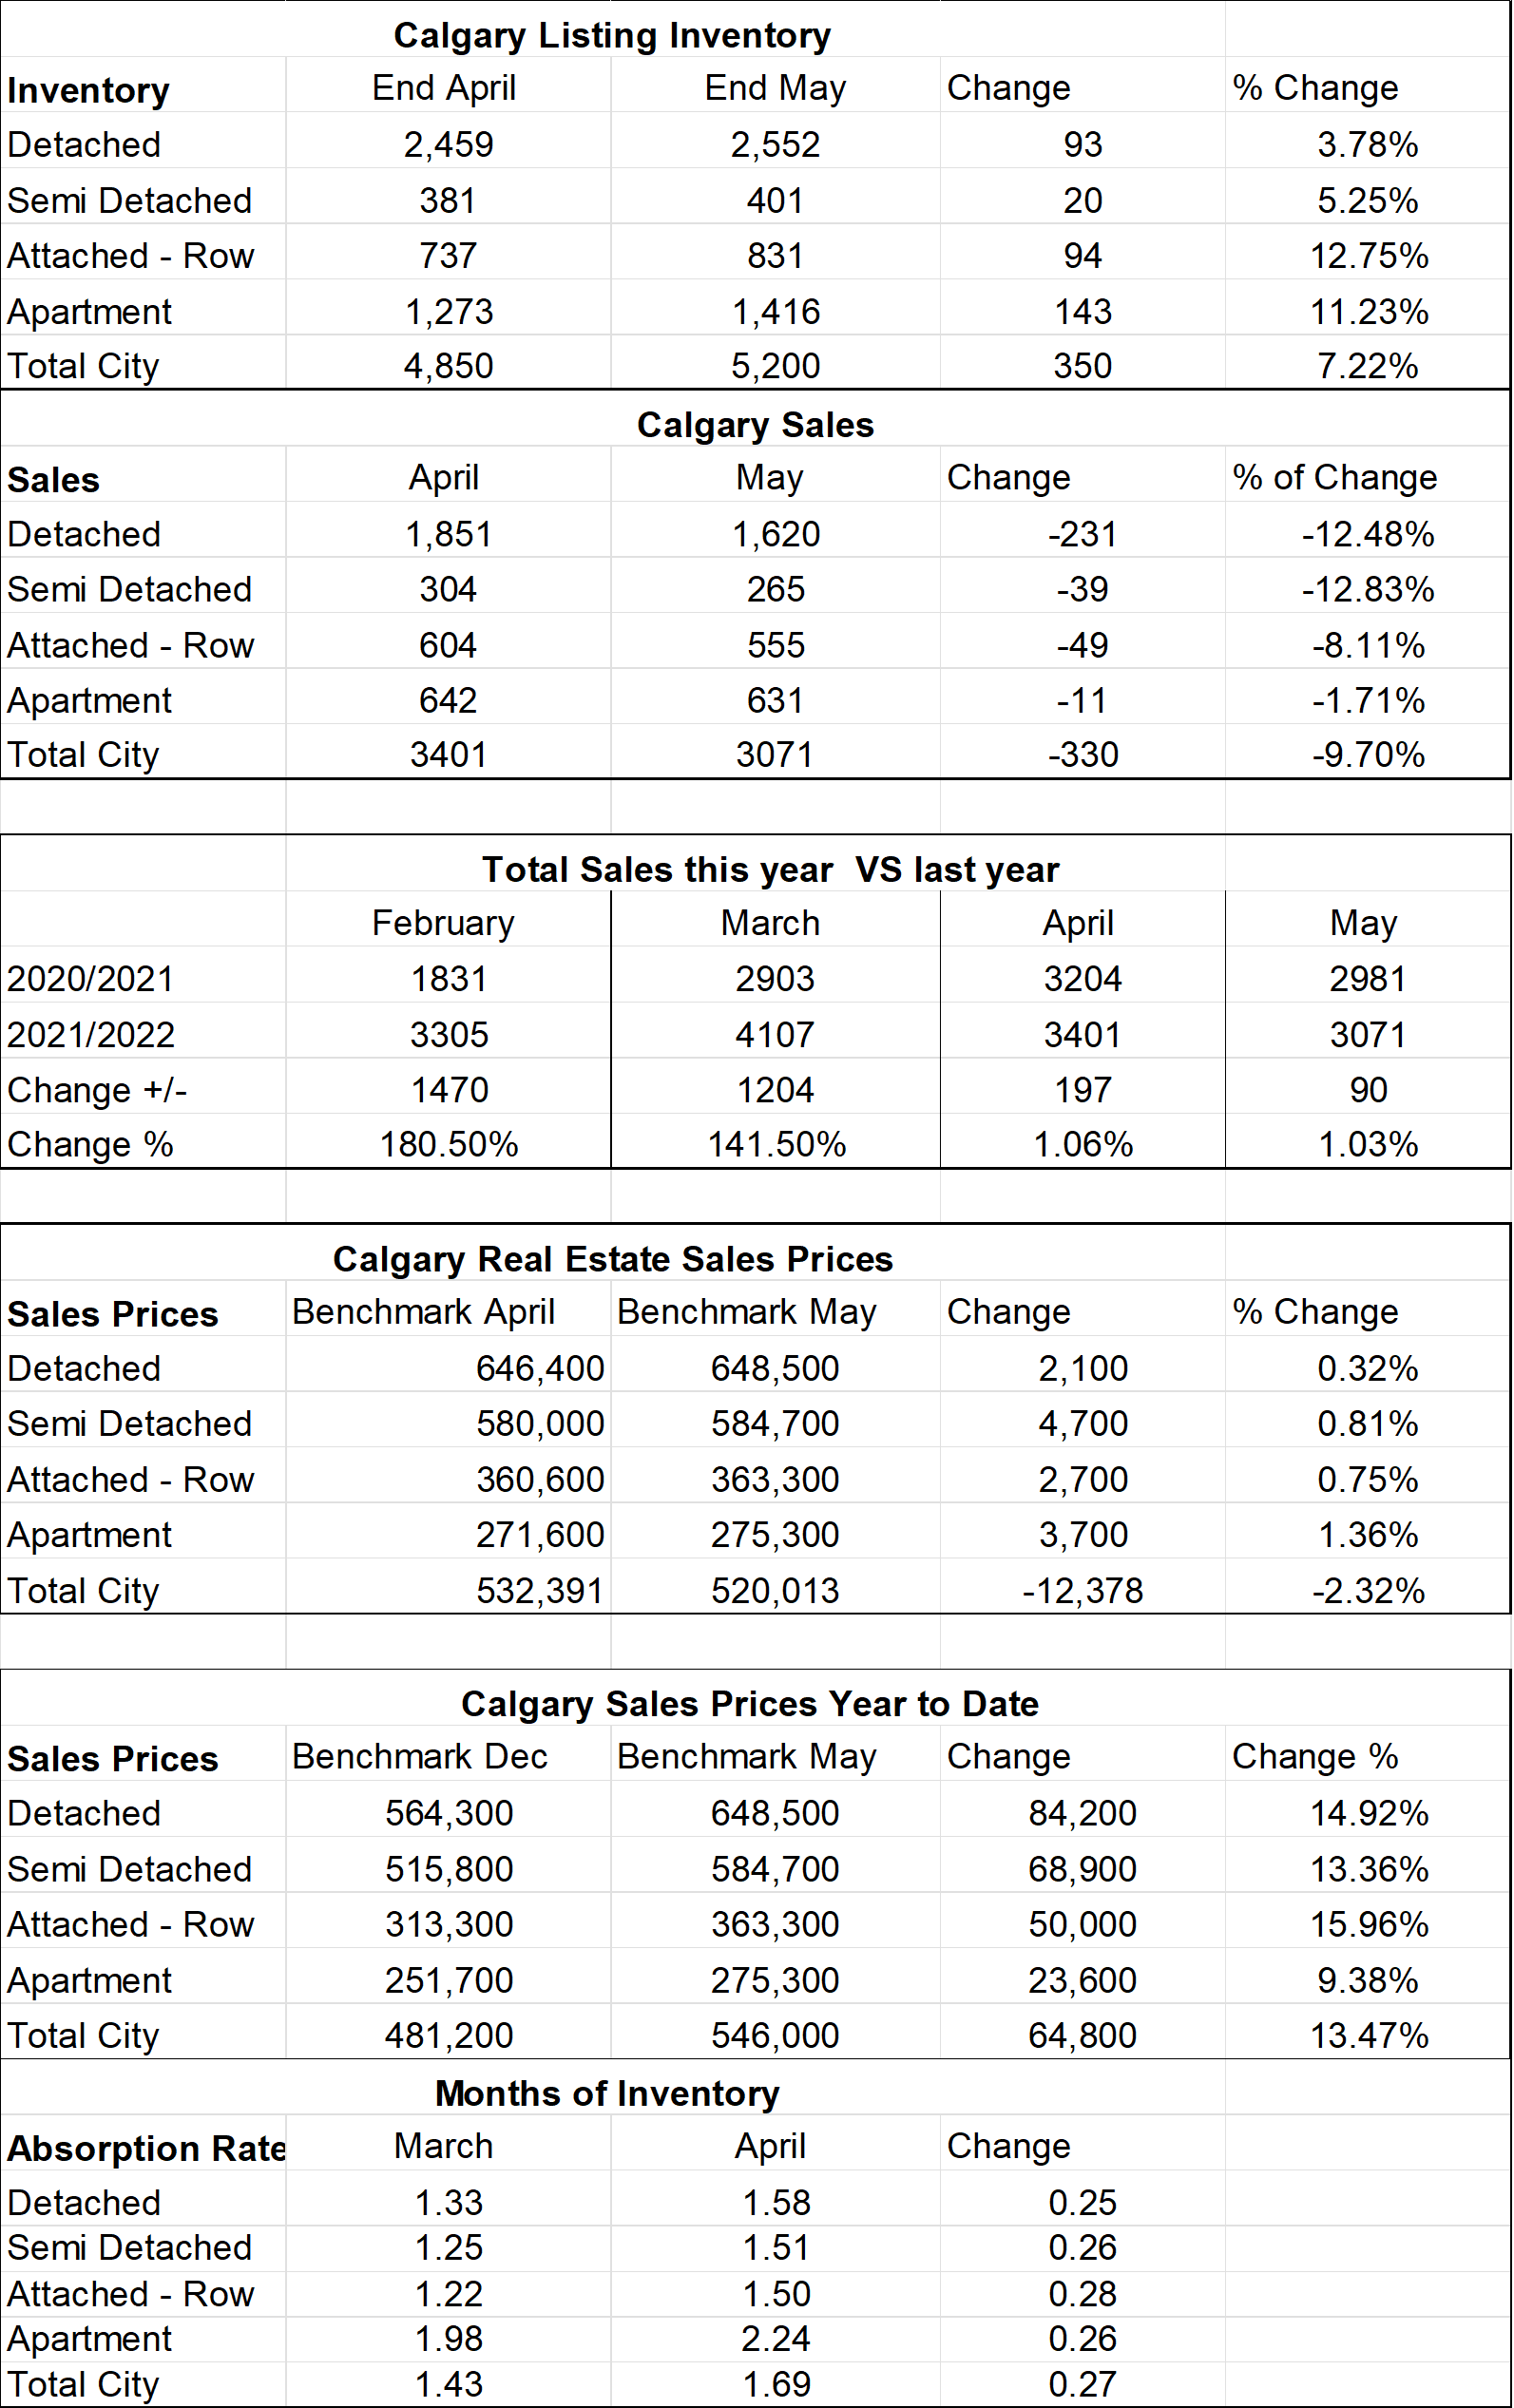
Listing inventory increased in all sectors combined by a total of 350 listings. Detached and Semi-Detached increased the least both under 6% while Apartment Condos and Row Houses increased by 11.2% and 12.75%. See chart below for details
Calgary Sales:
Sales in all categories decreased from April. The decrease for all sectors was less than 50 except detached homes where the decrease was 231 sales less. See chart below for details
Sales Compared to 2021:
Calgary home sales for May were just slightly higher than in May 2021 – by 90 Sales or 1.03%
| Jan | Feb | Mar | Apr | May | June | July | |
| 2021 | 1207 | 1831 | 2903 | 3204 | 2981 | ||
| 2022 | 2009 | 3305 | 4107 | 3401 | 3071 | ||
| Change | + 802 | 1474 | +1204 | +197 | 90 | ||
| % Change | + 66.4% | +180.5% | +141.5% | +1.06 | +1.03% |
| Aug | Sept | Oct | Nov | Dec | |
| 2020 | 1574 | 1702 | 1763 | 1438 | 1199 |
| 2021 | 2151 | 2162 | 2186 | 2110 | 1737 |
| Change | +577 | +456 | + 423 | +672 | +538 |
| % Change | 136.6% | 126.7% | 123.9% | 146.7% | 144.9% |
Calgary Real Estate Benchmark Sales Prices:
*Note: If you have been following my reports you may have noticed some changes in the Benchmark Prices compared to my last report. The Calgary Real Estate Board has changed how they calculate the Benchmark Price. It is my understanding that previously they used numbers all the way back to 2005 when the Home Price Index was introduced. The new method is to only use the last 5 years so as communities change the benchmark price will more quickly reflect the change.
The benchmark price for all sectors increased combined increased marginally (between $2,100 to $4,700. See chart below for details
Calgary Real Estate Benchmark Year to Date Sales Price: See chart below.
Year to date all sectors have seen substantial increases with the highest increases being in the detached sector. See chart below for details.
Current Months of Inventory (Absorption Rate):
The months of inventory increased in all sectors in May by between .25 and .28. We are seeing all sectors creep up weekly. All sectors currently remain in a seller’s market position however Apartment condos are just about into a balanced market again.
What might the rest of 2022 bring: (again just my opinion)
Based on what I am seeing we are on our way towards a more balanced market. At this stage it has been a gradual increase however we will see what impact today’s interest rate increase has – I think it will slow things down even more.
Below is a summary of numbers in chart form. All numbers are taken from the Calgary Real Estate Boards monthly Stats package.
Select Stats from the Calgary Real Estate Board
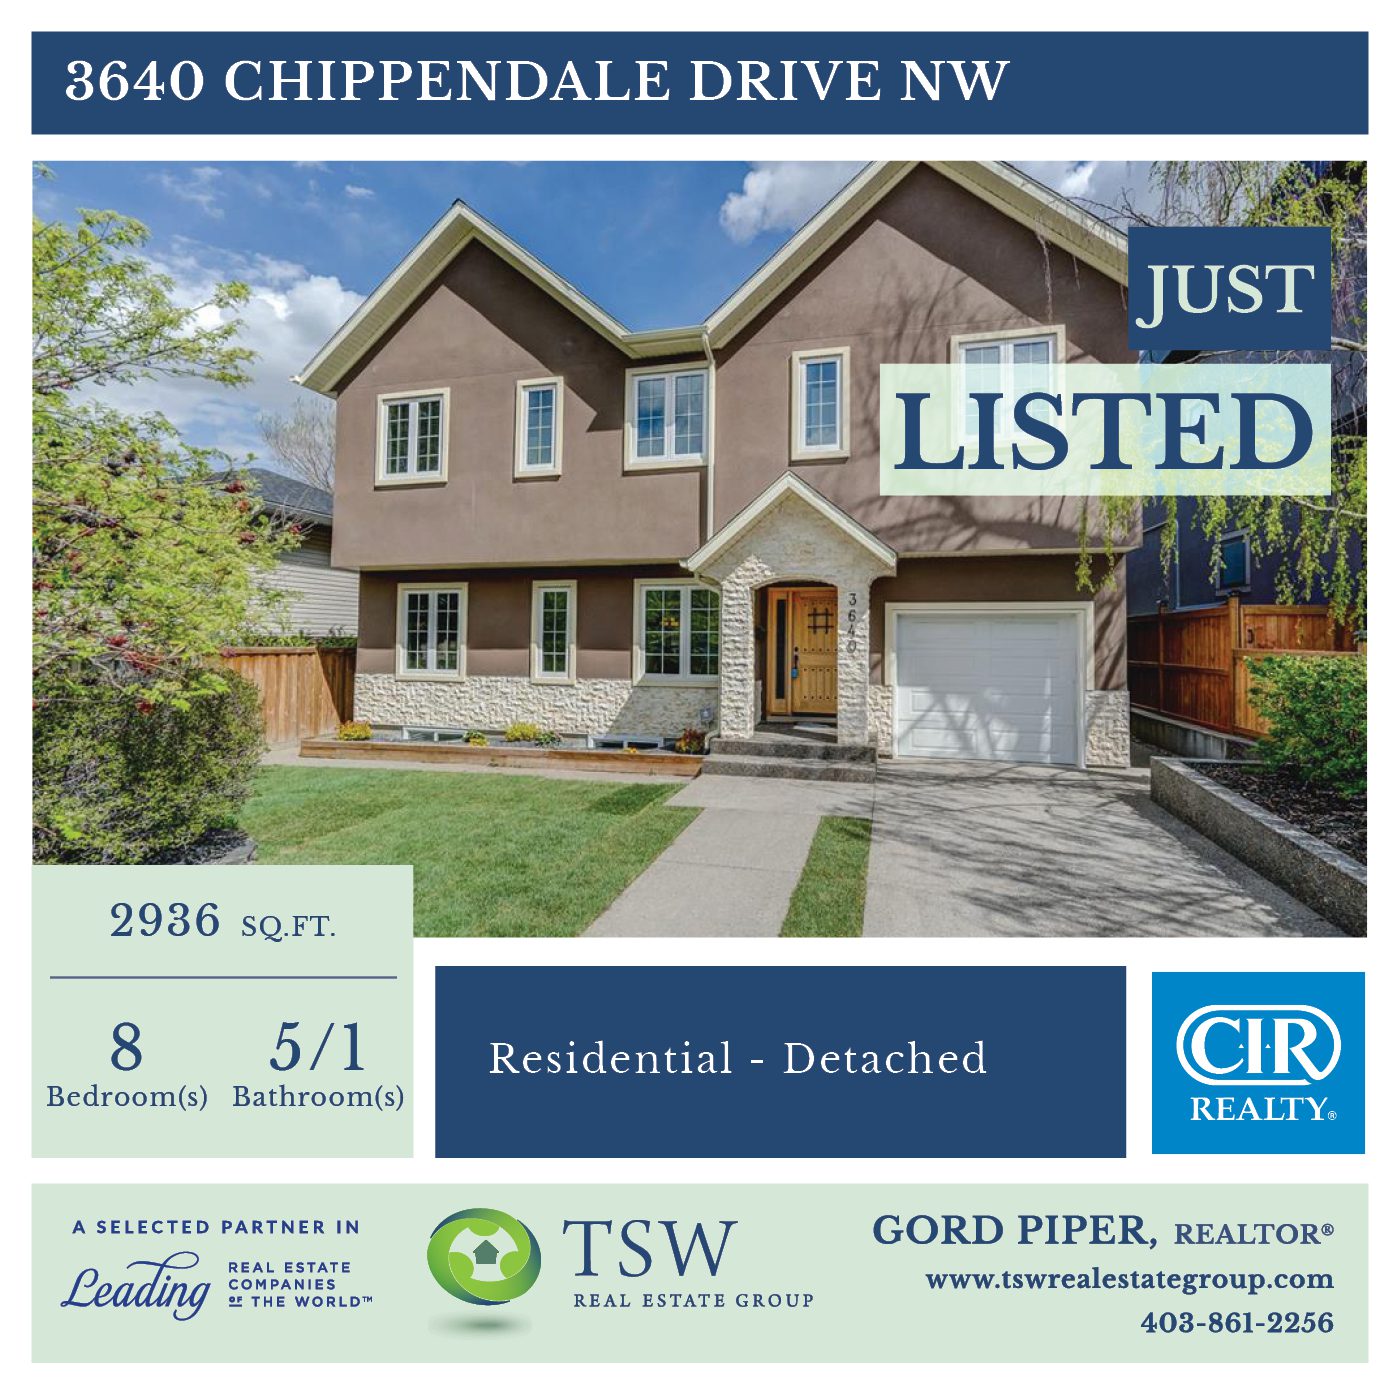
Just listed this stunning home In Charleswood, Calgary.
MLS # A1222468
List Price: $1,350,000
More Details and Photos: https://www.tswrealestategroup.com/for-sale/3640-chippendale-drive-nw–74805484
Just listed this awesome 908 square foot unit in the sought after Sierra’s of Tuscany.
MLS A1214181
To view all details: https://www.tswrealestategroup.com/for-sale/101-223-tuscany-springs-boulevard-nw–69338648
Listed at only $325,000
What is really happening in the Calgary Real Estate Market? Yes, there is change on the horizon!
Following is a graph that shows the months of inventory for each housing sector. Looking at a one-year trendline gives you an indication of where things are really heading.
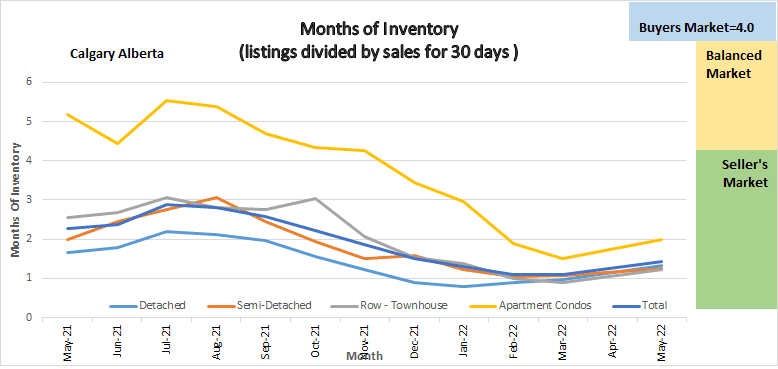
Months of Inventory
Gord’s commentary for the month (just my opinion).
March 2022 Highlights
Calgary Listing Inventory
Listing inventory increased in all sectors combined by a total of 486 listings or 11.14%. The highest increase was in Detached homes at 12.2% and the lowest was in the Semi – Detached sector of 1.87%
Calgary Sales:
This is where the largest change has happened. Total Sales for the month dropped from last month by a total of 706 sales or 17.19%. The decrease was fairly consistent across all sectors.
Sales Compared to 2021:
Calgary home sales for April were just slightly higher than in April 2021 – by 197 Sales or 1.06%
| Jan | Feb | Mar | Apr | May | June | July | |
| 2021 | 1207 | 1831 | 2903 | 3204 | |||
| 2022 | 2009 | 3305 | 4107 | 3401 | |||
| Change | + 802 | 1474 | +1204 | +197 | |||
| % Change | + 66.4% | +180.5% | +141.5% | +1.06 |
| Aug | Sept | Oct | Nov | Dec | |
| 2020 | 1574 | 1702 | 1763 | 1438 | 1199 |
| 2021 | 2151 | 2162 | 2186 | 2110 | 1737 |
| Change | +577 | +456 | + 423 | +672 | +538 |
| % Change | 136.6% | 126.7% | 123.9% | 146.7% | 144.9% |
Calgary Real Estate Benchmark Sales Prices:
The benchmark price for all sectors increased combined increased by 1.56% or $8,100. The increase was consistent across all sectors.
Calgary Real Estate Benchmark Year to Date Sales Price: See chart below.
Year to date all sectors combined have increased by $62,800 or 13.54%. The highest increase (14.91%) was in the Detached home sector while the lowest increase was in the Apartment Condo sector (8.35%).
Current Months of Inventory (Absorption Rate):
The months of inventory increased in all sectors in April by an average of .36
All sectors were equal with the lowest increase (.18) being in the Semi-Detached sector.
What might 2022 bring: (again just my opinion)
Based on what I am seeing we are on our way towards a more balanced market although if the increase in months of inventory rises at the same rate that it has been it will take us between 2 to 3 months to hit balanced. Apartment condos may reach balanced within 1-2 months. With all sectors still in a Sellers Market position we will continue to see price increases – just not to the level it has been the last 3 months.
Another month of record sales and sharp price increases!
Following is a graph that shows the months of inventory for each housing sector. Looking at a one-year trendline gives you an indication of where things are really heading.
Graph shows the months of Inventory, for each sector in the Calgary Real Estate market for the last year so we can all see the trends.
Gord’s commentary for the month (just my opinion).
2022 Highlights
Calgary Listing Inventory
Listing inventory increased in all sectors combined by a total of 764. Apartment condominiums saw the lowest inventory increase at 9.1% while all other sectors were between 18.5% to 29.8%.
Calgary Sales:
Overall sales were 24.3% higher than in February. For the second month in a row, sales activity not only reached a monthly high but also hit new record highs for any given month. Gains occurred across every property sector, and they all hit new record highs.
Sales Compared to 2021: This puts things into Perspective
Calgary home sales for March were 41.5% higher than total sales in March of 2021.
| Jan | Feb | Mar | Apr | May | June | July | |
| 2021 | 1207 | 1831 | 2903 | ||||
| 2022 | 2009 | 3305 | 4107 | ||||
| Change | + 802 | 1474 | +1204 | ||||
| % Change | + 66.4% | +180.5% | +141.5% |
| Aug | Sept | Oct | Nov | Dec | Year to Date | |
| 2020 | 1574 | 1702 | 1763 | 1438 | 1199 | 16,149 |
| 2021 | 2151 | 2162 | 2186 | 2110 | 1737 | 27,686 |
| Change | +577 | +456 | + 423 | +672 | +538 | 11,537 |
| % Change | 136.6% | 126.7% | 123.9% | 146.7% | 144.9% | 171.4% |
Calgary Real Estate Benchmark Sales Prices:
The benchmark price for all sectors increased in February.
Detached home sector increased by $24,100 or 4.04%
Semi-detached increased by $17,000 or 3.68%
Attached Row increased by $14,300 or 4.45%
Apartment Condos increased by $8,400 or 3.26%%
Calgary Real Estate Benchmark Year to Date Sales Price: See chart below.
Year to date all sectors combined have increased by $54,700 or 11.79%
Current Months of Inventory (Absorption Rate):
The months of inventory in the detached sector increased marginally by .07 while the Semi-Detached sector increased by .04
The months of inventory decreased in the Attached -Row sector by .38 and in the Apartment sector by .03
The overall months of inventory decreased by .03 so this leaves the entire market in a Seller’s Market position.
What might 2022 bring: (again just my opinion) – The same as last month.
We are now very deep into a seller’s market. As inventory increases (which typically happens in Mar to may) I believe the market will soften but, in the meantime, I believe we will see more substantial price increases. Many people are asking me why this is all happening, and I have some thoughts:
It is also important to note that these numbers vary by community, and by price range. If you would like numbers for your community, or more specific numbers for your home please contact us.
Below is a summary of numbers in chart form. All numbers are taken from the Calgary Real Estate Boards monthly Stats package.
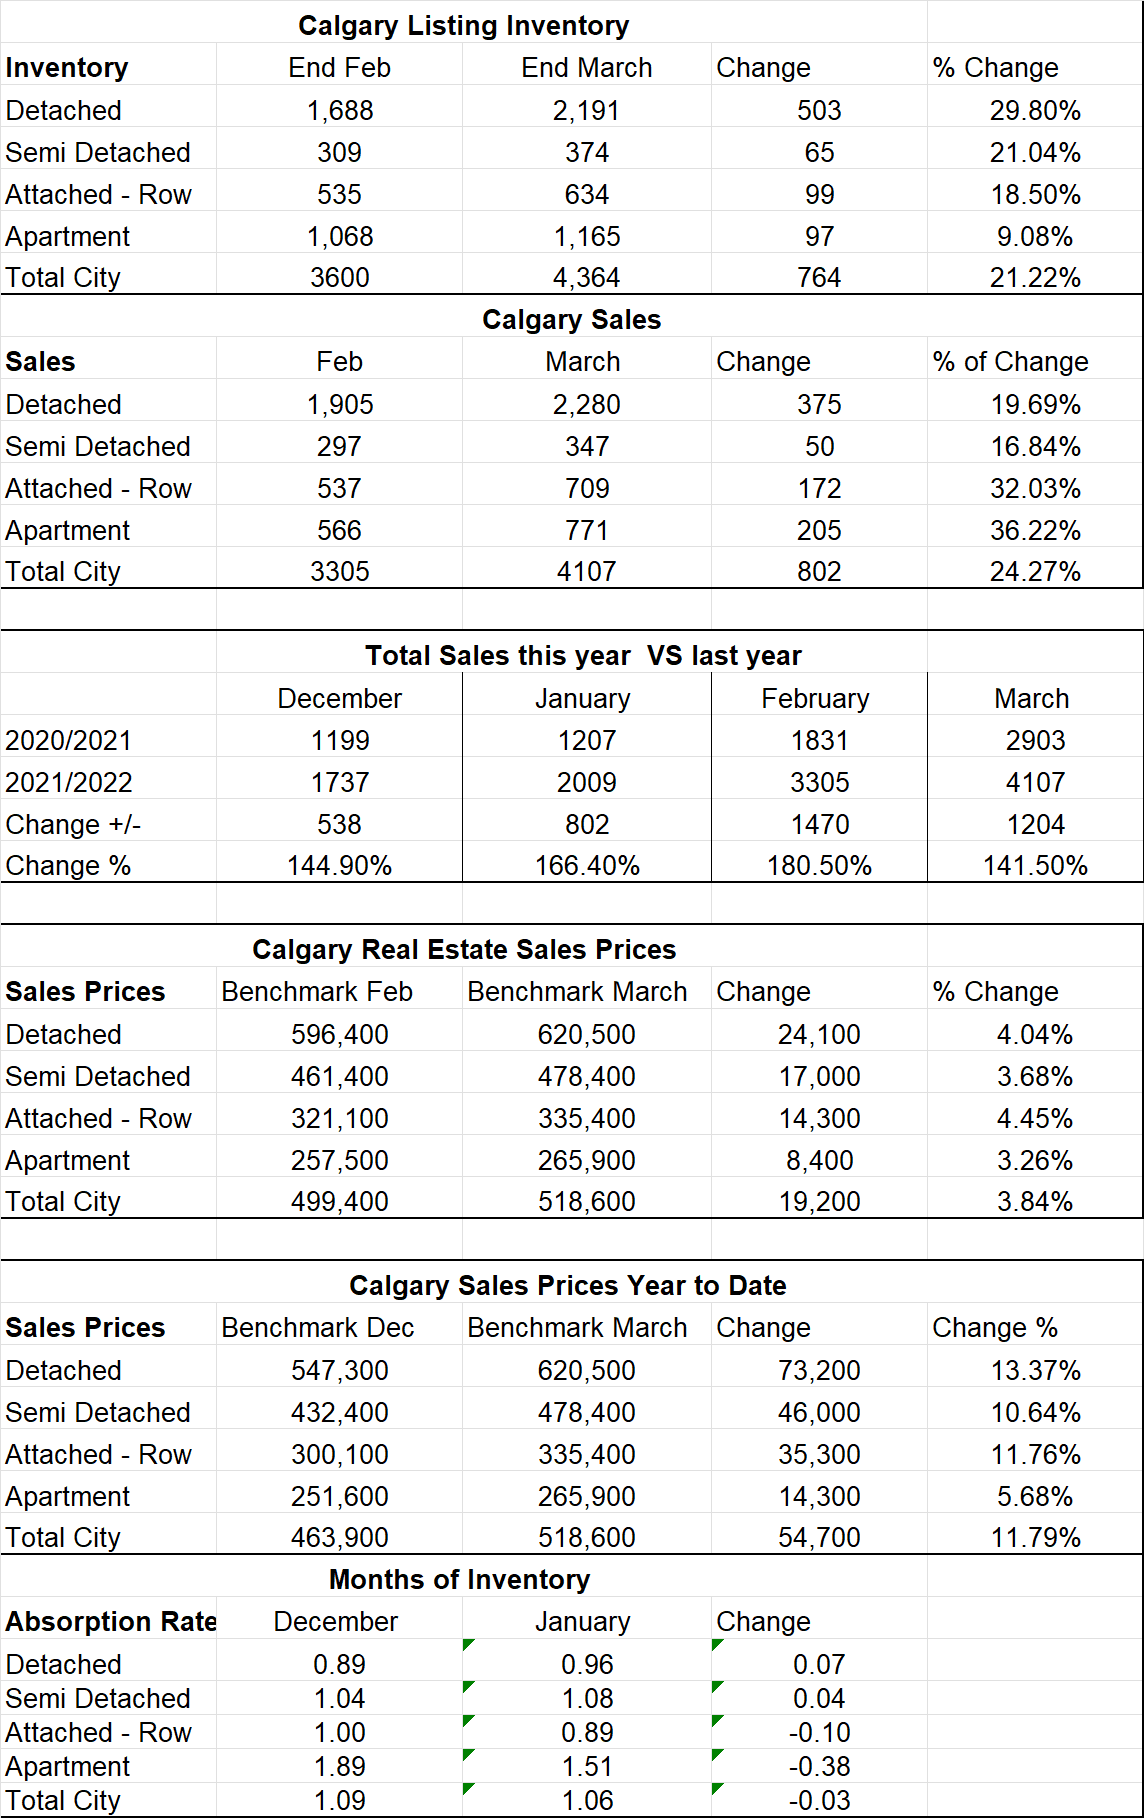
This chart contains key numbers from the Calgary Real Estate Boards Stats package for Agents. Numbers include inventory, sales, months of inventory and prices for all sectors of the Calgary Real Estate market.
Just listed this Stunning Hand Crafted 5055 Sq Ft log home. Comes with a 3807 Sq Ft Shop
MLS Listing A1255606
Check out our video: https://youtu.be/BYTJ8WxsMTA
Full Details here:
Web Link: https://www.tswrealestategroup.com/for-sale/52005-township-road-283-a–77911244
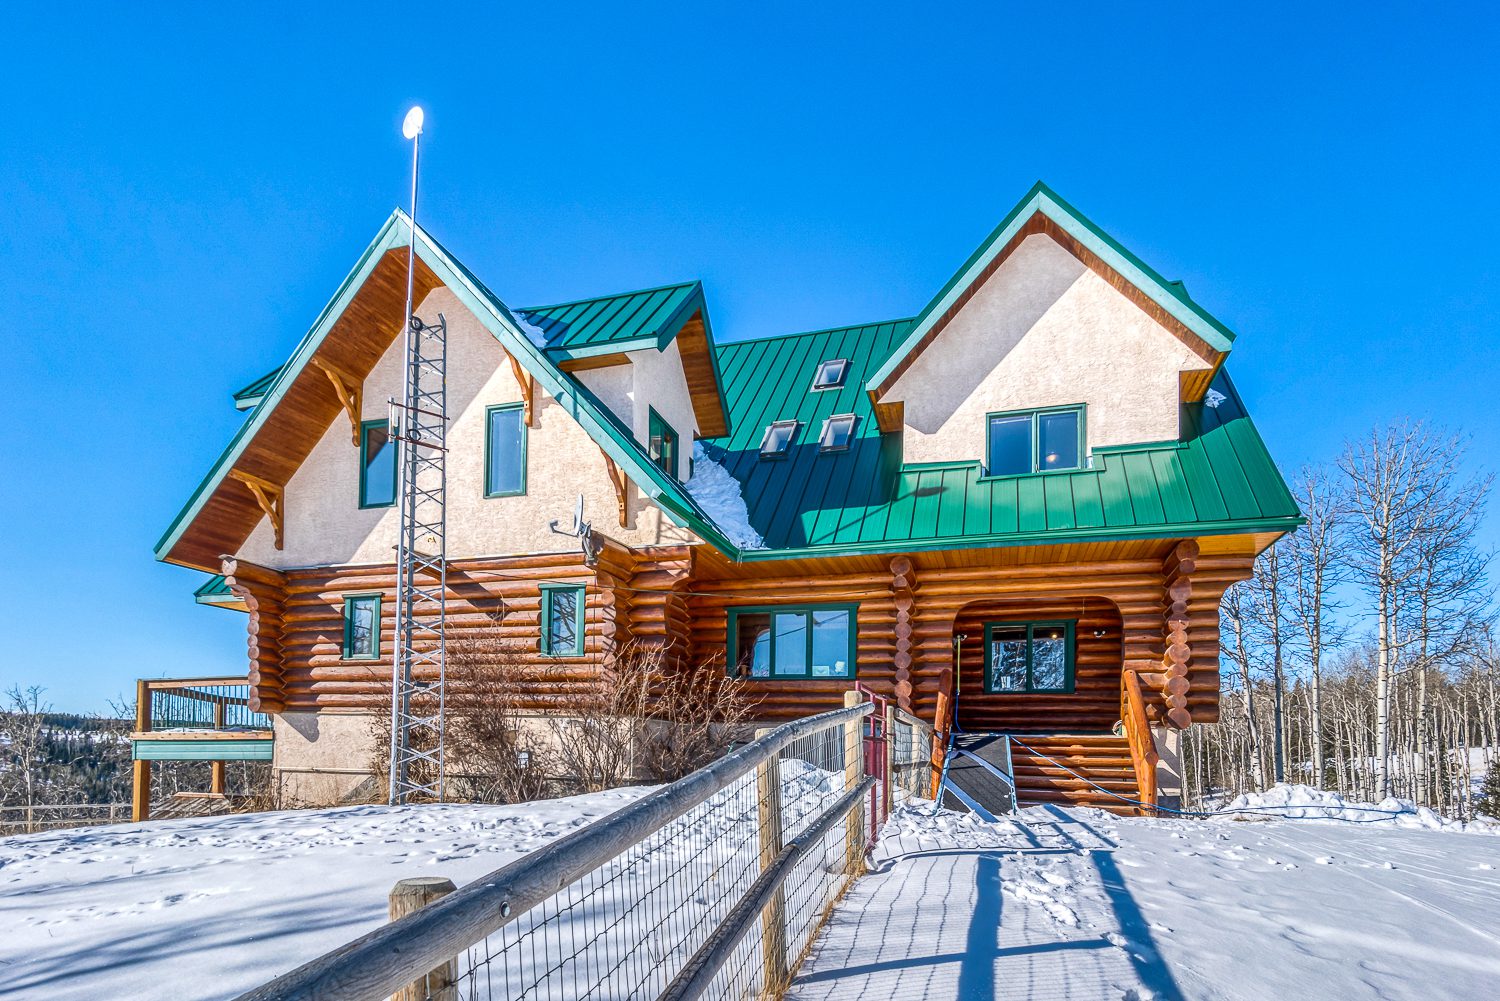
Stunning Hand Crafted Log Home
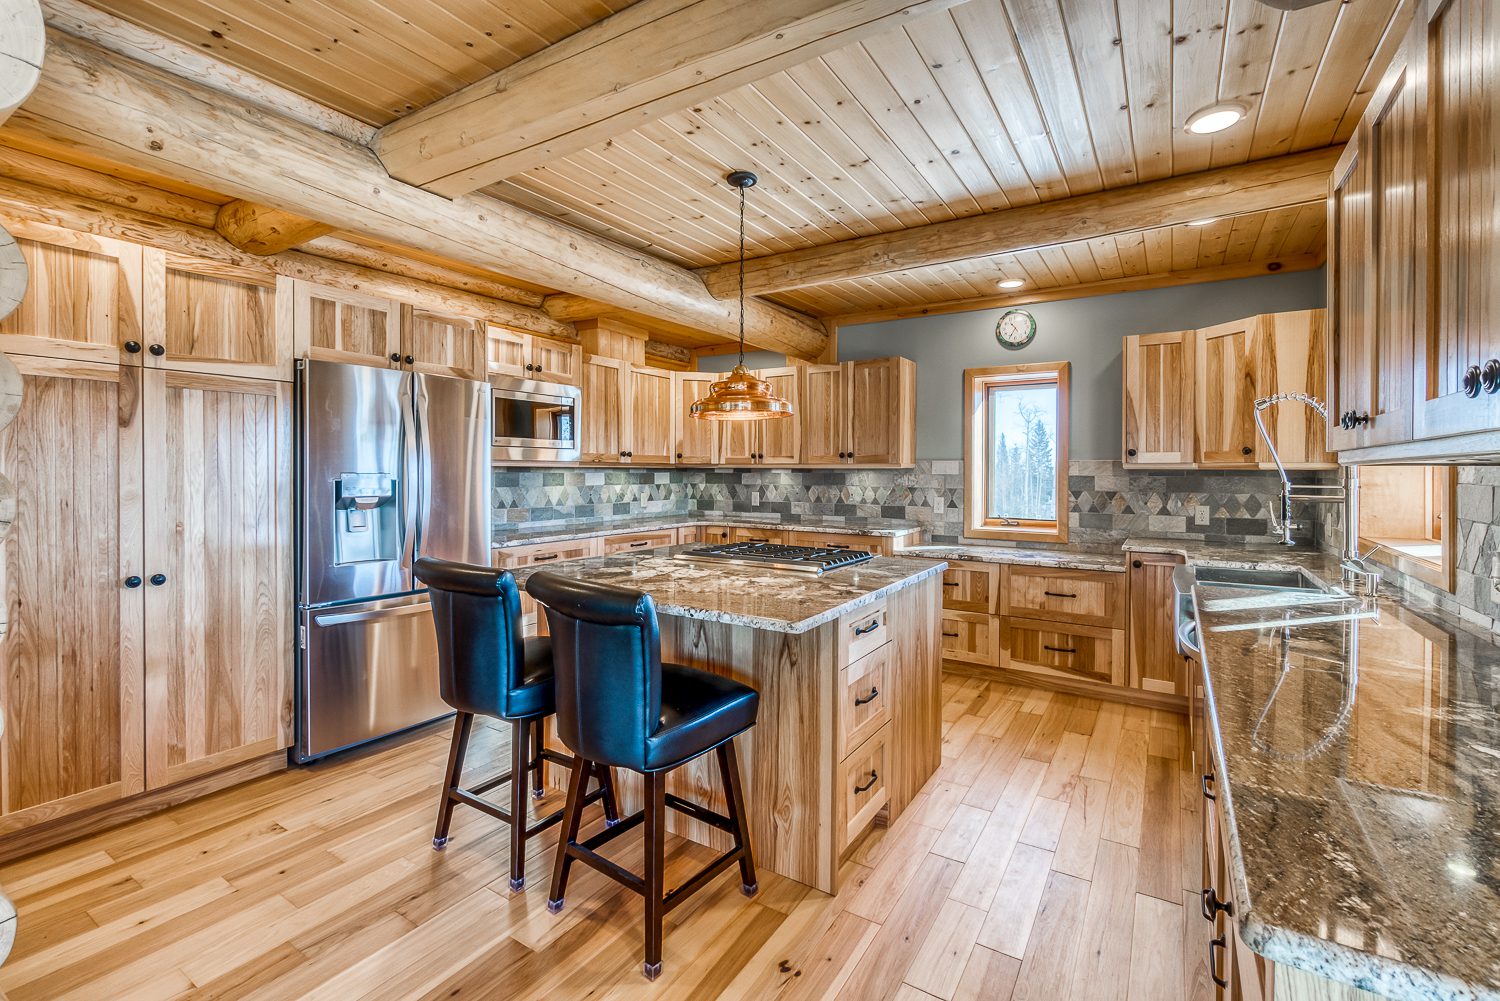
Beautiful new kitchen
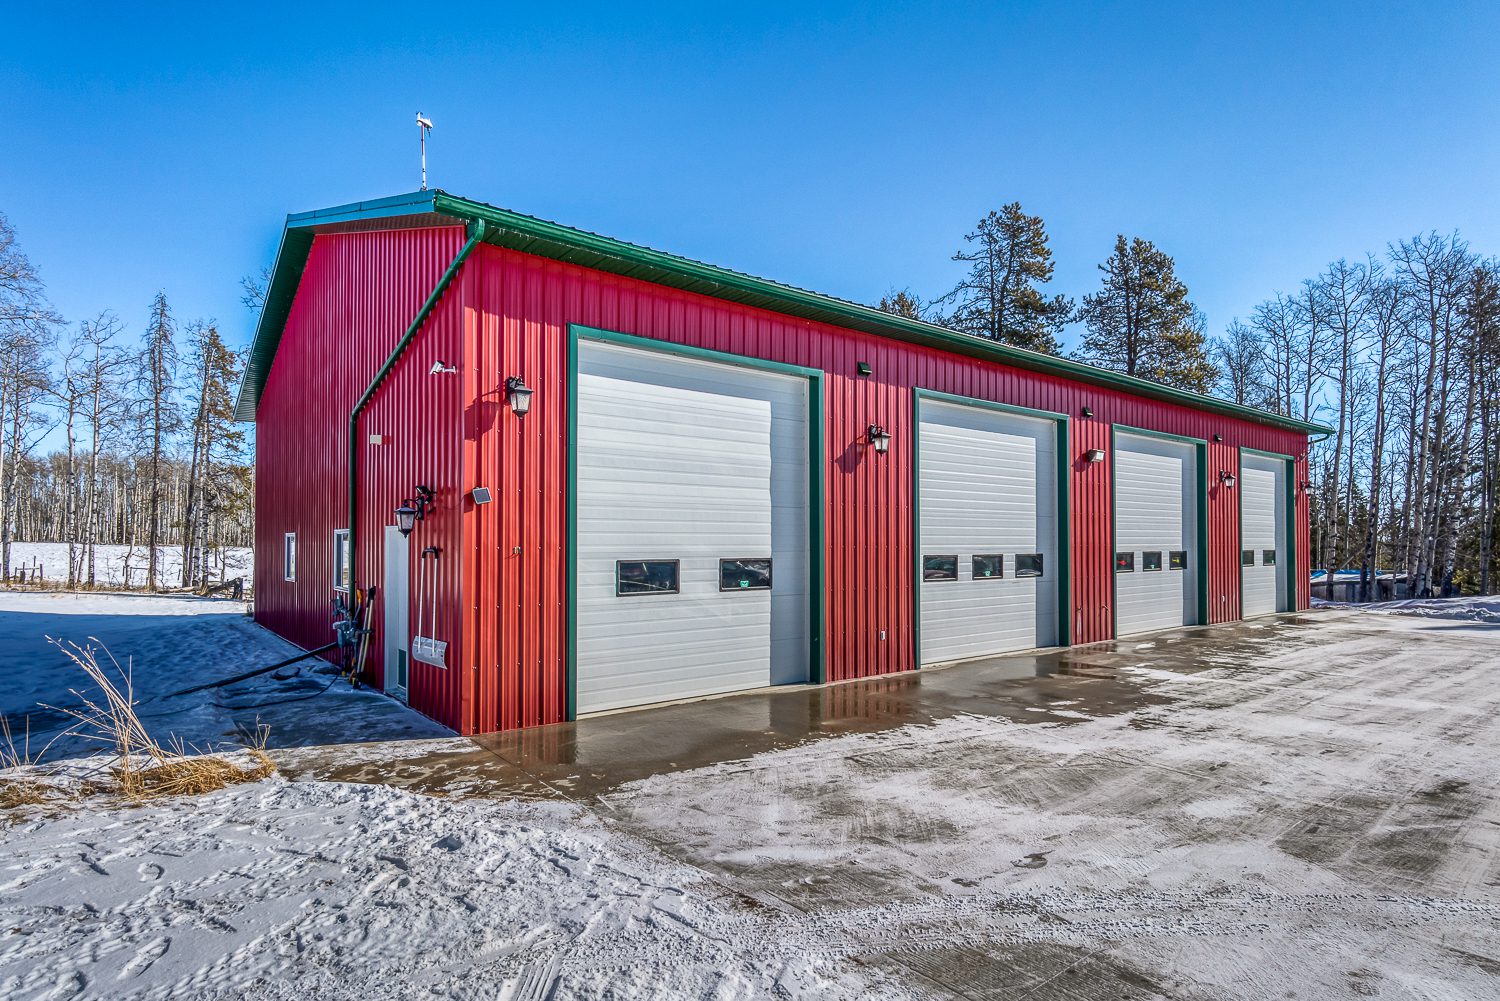
3807 Square Ft Shop
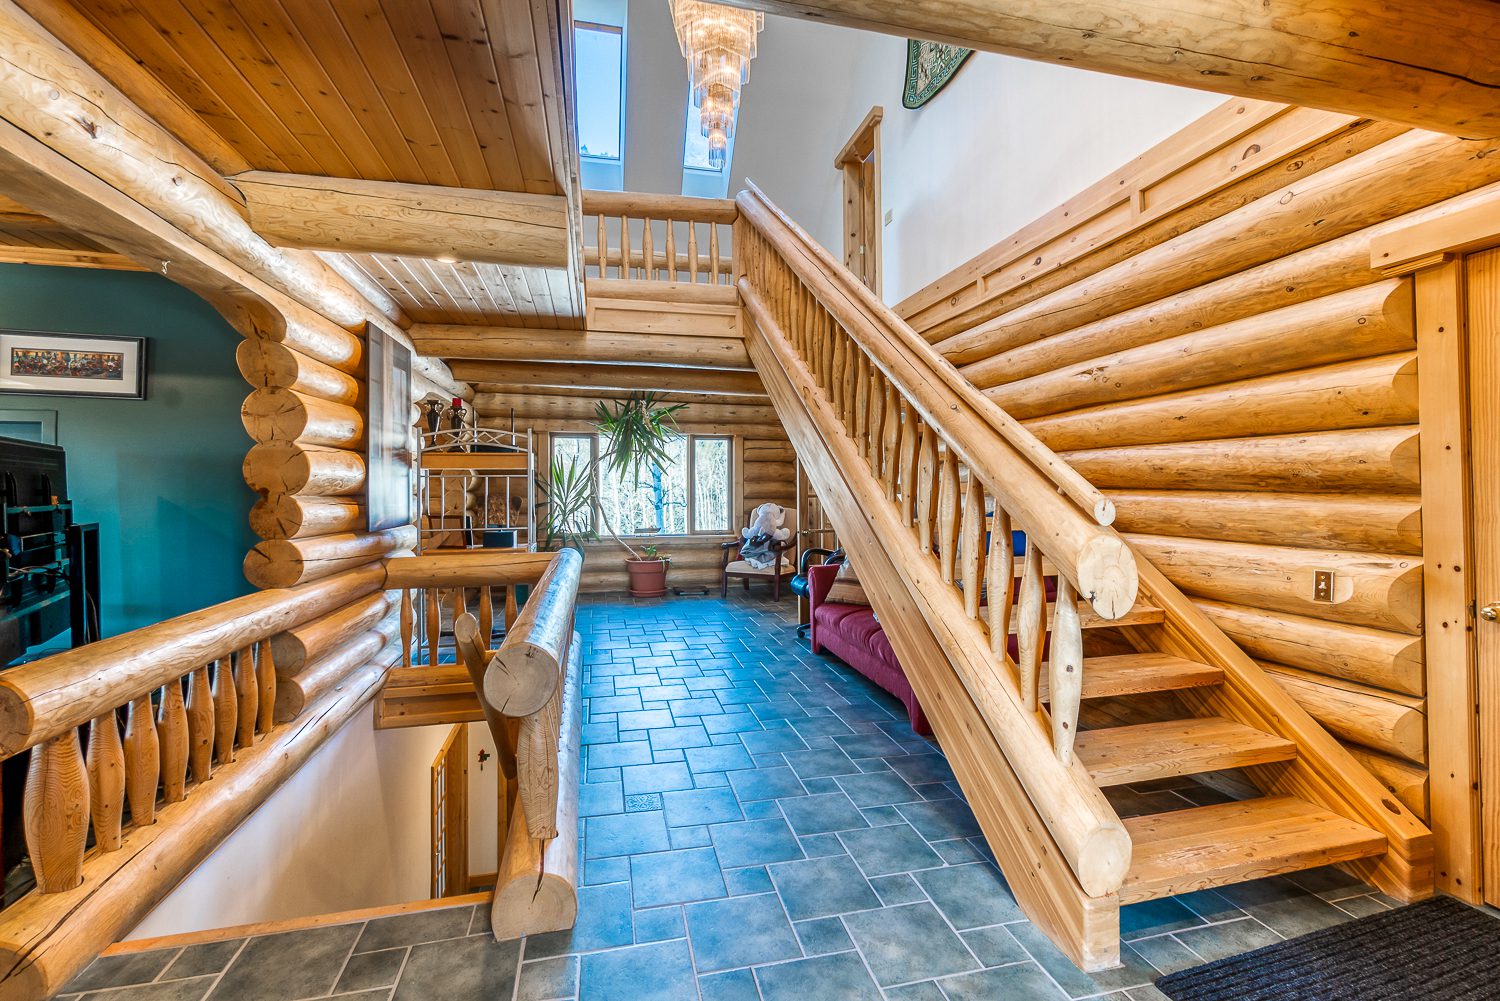
Stunning large, handcrafted log home, triple garage for your vehicles and a 50 X 80 luxury shop for all your trucks, toys, and other needs. Situated on a private twenty-nine acres this property is partially treed and provides spectacular mountain views. Property is located just 28 minutes northwest of Cochrane. This amazing home boasts 5055 square feet of luscious space while the shop provides an addition 3807 square feet. This beautiful home is majestically placed on the hillcrest overlooking the valley with gorgeous mountain views from all angles. As you step into your home the large foyer will wow you with a view of the staircase with a wide-open ceiling. Stepping further in, the kitchen is fully renovated with custom built cabinets, hardwood and features a Jenn Air gas stove, stainless steel appliances and granite counter tops. With easy access to your dining room, it offers space for a large table for fabulous family gatherings all while gazing out windows on three sides to take in the breathtaking Alberta views. With large windows in both the living room and family room they are the perfect places to cozy up with a book and enjoy the rock surround fireplaces. The main floor also offers an office space/bedroom as well as a bath. Saunter up those stunning stairs to the second level that features maple hardwood, vaulted ceiling and six skylights providing tons of natural light. The primary bedroom is its own oasis with vaulted ceilings, a fireplace, walk in closet, six-piece ensuite with an updated custom-built vanity. This level also offers two additional bedrooms for your growing family, a sitting area for lounging and playing, a library, a spacious laundry room and a three-piece bath featuring a clawfoot tub. Above this level is a loft making a perfect space for an exercise room or office. Downstairs offers a unique setup with a partially finished walkout basement complete with an antique wood cooking stove, an airtight wood burning stove and a bath. This home offers several recent updates with a newer furnace, a new metal roof and an automatic backup natural gas generator to run the house and shop. Another recent addition is the high-end heated shop with four high doors, an extended concrete apron, with ample room for trucks, toys and all the accessories. This magnificent piece of land is partially treed and would be great for your horses. There is a fenced area and luscious green spaces for gardening and taking in all mother nature has to offer. Large Dog run. Once you turn the key to this regal home, you know you are stepping into your dream come true. Must be seen to be appreciated.
What is really happening in the Calgary Real Estate Market?
Another month of record sales and sharp price increases!

Real Estate Prices Rising
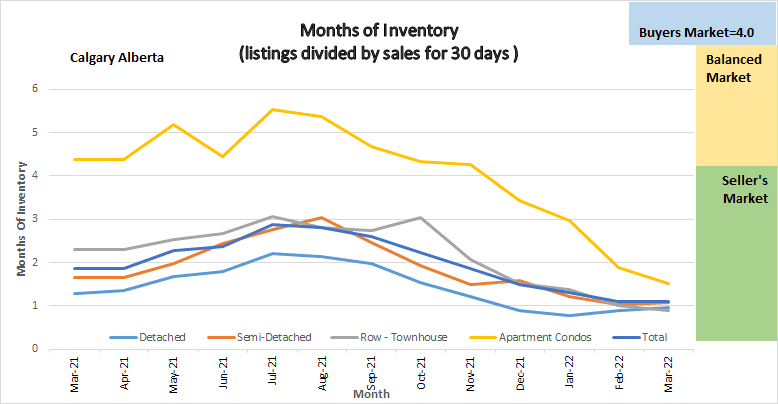
Following is a graph that shows the months of inventory for each housing sector. Looking at a one-year trendline gives you an indication of where things are really heading.
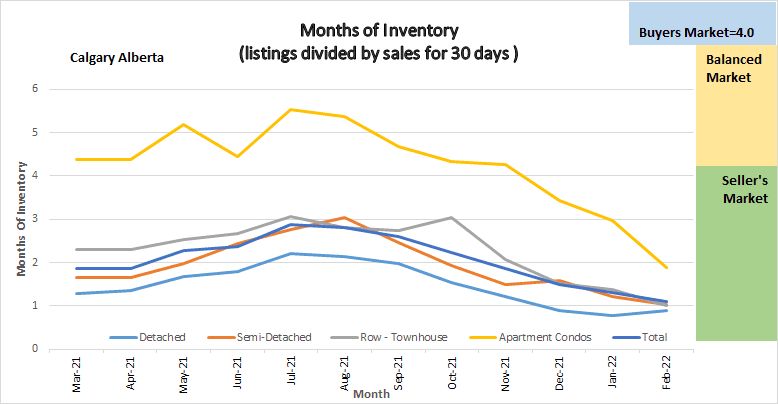
This graph shows the one year trend of months of Inventory in all sectors of the Calgary Real Estate Market
Gord’s commentary for the month (just my opinion).
2022 Highlights
Calgary Listing Inventory
Listing inventory Increased in all sectors by a total of 980 more listings at the end of February compared to the end of January.
Calgary Sales:
February sales are the highest on record for a February. Sales increased in all sectors anywhere from 49.25% to 65.94% increase over January sales.
Sales Compared to 2021: This puts things into Perspective
Calgary home sales for February were 1474 higher than last February, an increase of 180.5%
| Jan | Feb | Mar | Apr | May | June | July | |
| 2021 | 1207 | 1831 | |||||
| 2022 | 2009 | 3305 | |||||
| Change | + 802 | 1474 | |||||
| % Change | + 66.4% | +180.5% |
Last years numbers
| Aug | Sept | Oct | Nov | Dec | Year to Date | |
| 2020 | 1574 | 1702 | 1763 | 1438 | 1199 | 16,149 |
| 2021 | 2151 | 2162 | 2186 | 2110 | 1737 | 27,686 |
| Change | +577 | +456 | + 423 | +672 | +538 | 11,537 |
| % Change | 136.6% | 126.7% | 123.9% | 146.7% | 144.9% | 171.4% |
Calgary Real Estate Benchmark Sales Prices:
The benchmark price for all sectors increased in February.
Detached home sector increased by $36,600 or 6.54%
Semi-detached increased by $21,500 or 4.89%
Attached Row increased by $15,500 or7.0%
Apartment Condos decreased by $5,900 or 7.65%
It is a long time since I have seen price changes so high in a month.
Calgary Real Estate Benchmark Year to Date Sales Price: See chart below.
Same Stats below
Current Months of Inventory (Absorption Rate):
The Months of inventory decreased in all sectors except Detached homes this month which increased by only .11. As you can see in my chart above our months of inventory keeps decreasing in all sectors putting us into a deep seller’s market position.
What might 2022 bring: (again just my opinion)
We are now very deep into a seller’s market. As inventory increases (which typically happens in Mar to may) I believe the market will softer but, in the meantime, I believe we will see more substantial price increases. Many people are asking me why this is all happening, and I have some thoughts:
It is also important to note that these numbers vary by community, and by price range. If you would like numbers for your community, or more specific numbers for your home please contact us.
Below is a summary of numbers in chart form. All numbers are taken from the Calgary Real Estate Boards monthly Stats package.
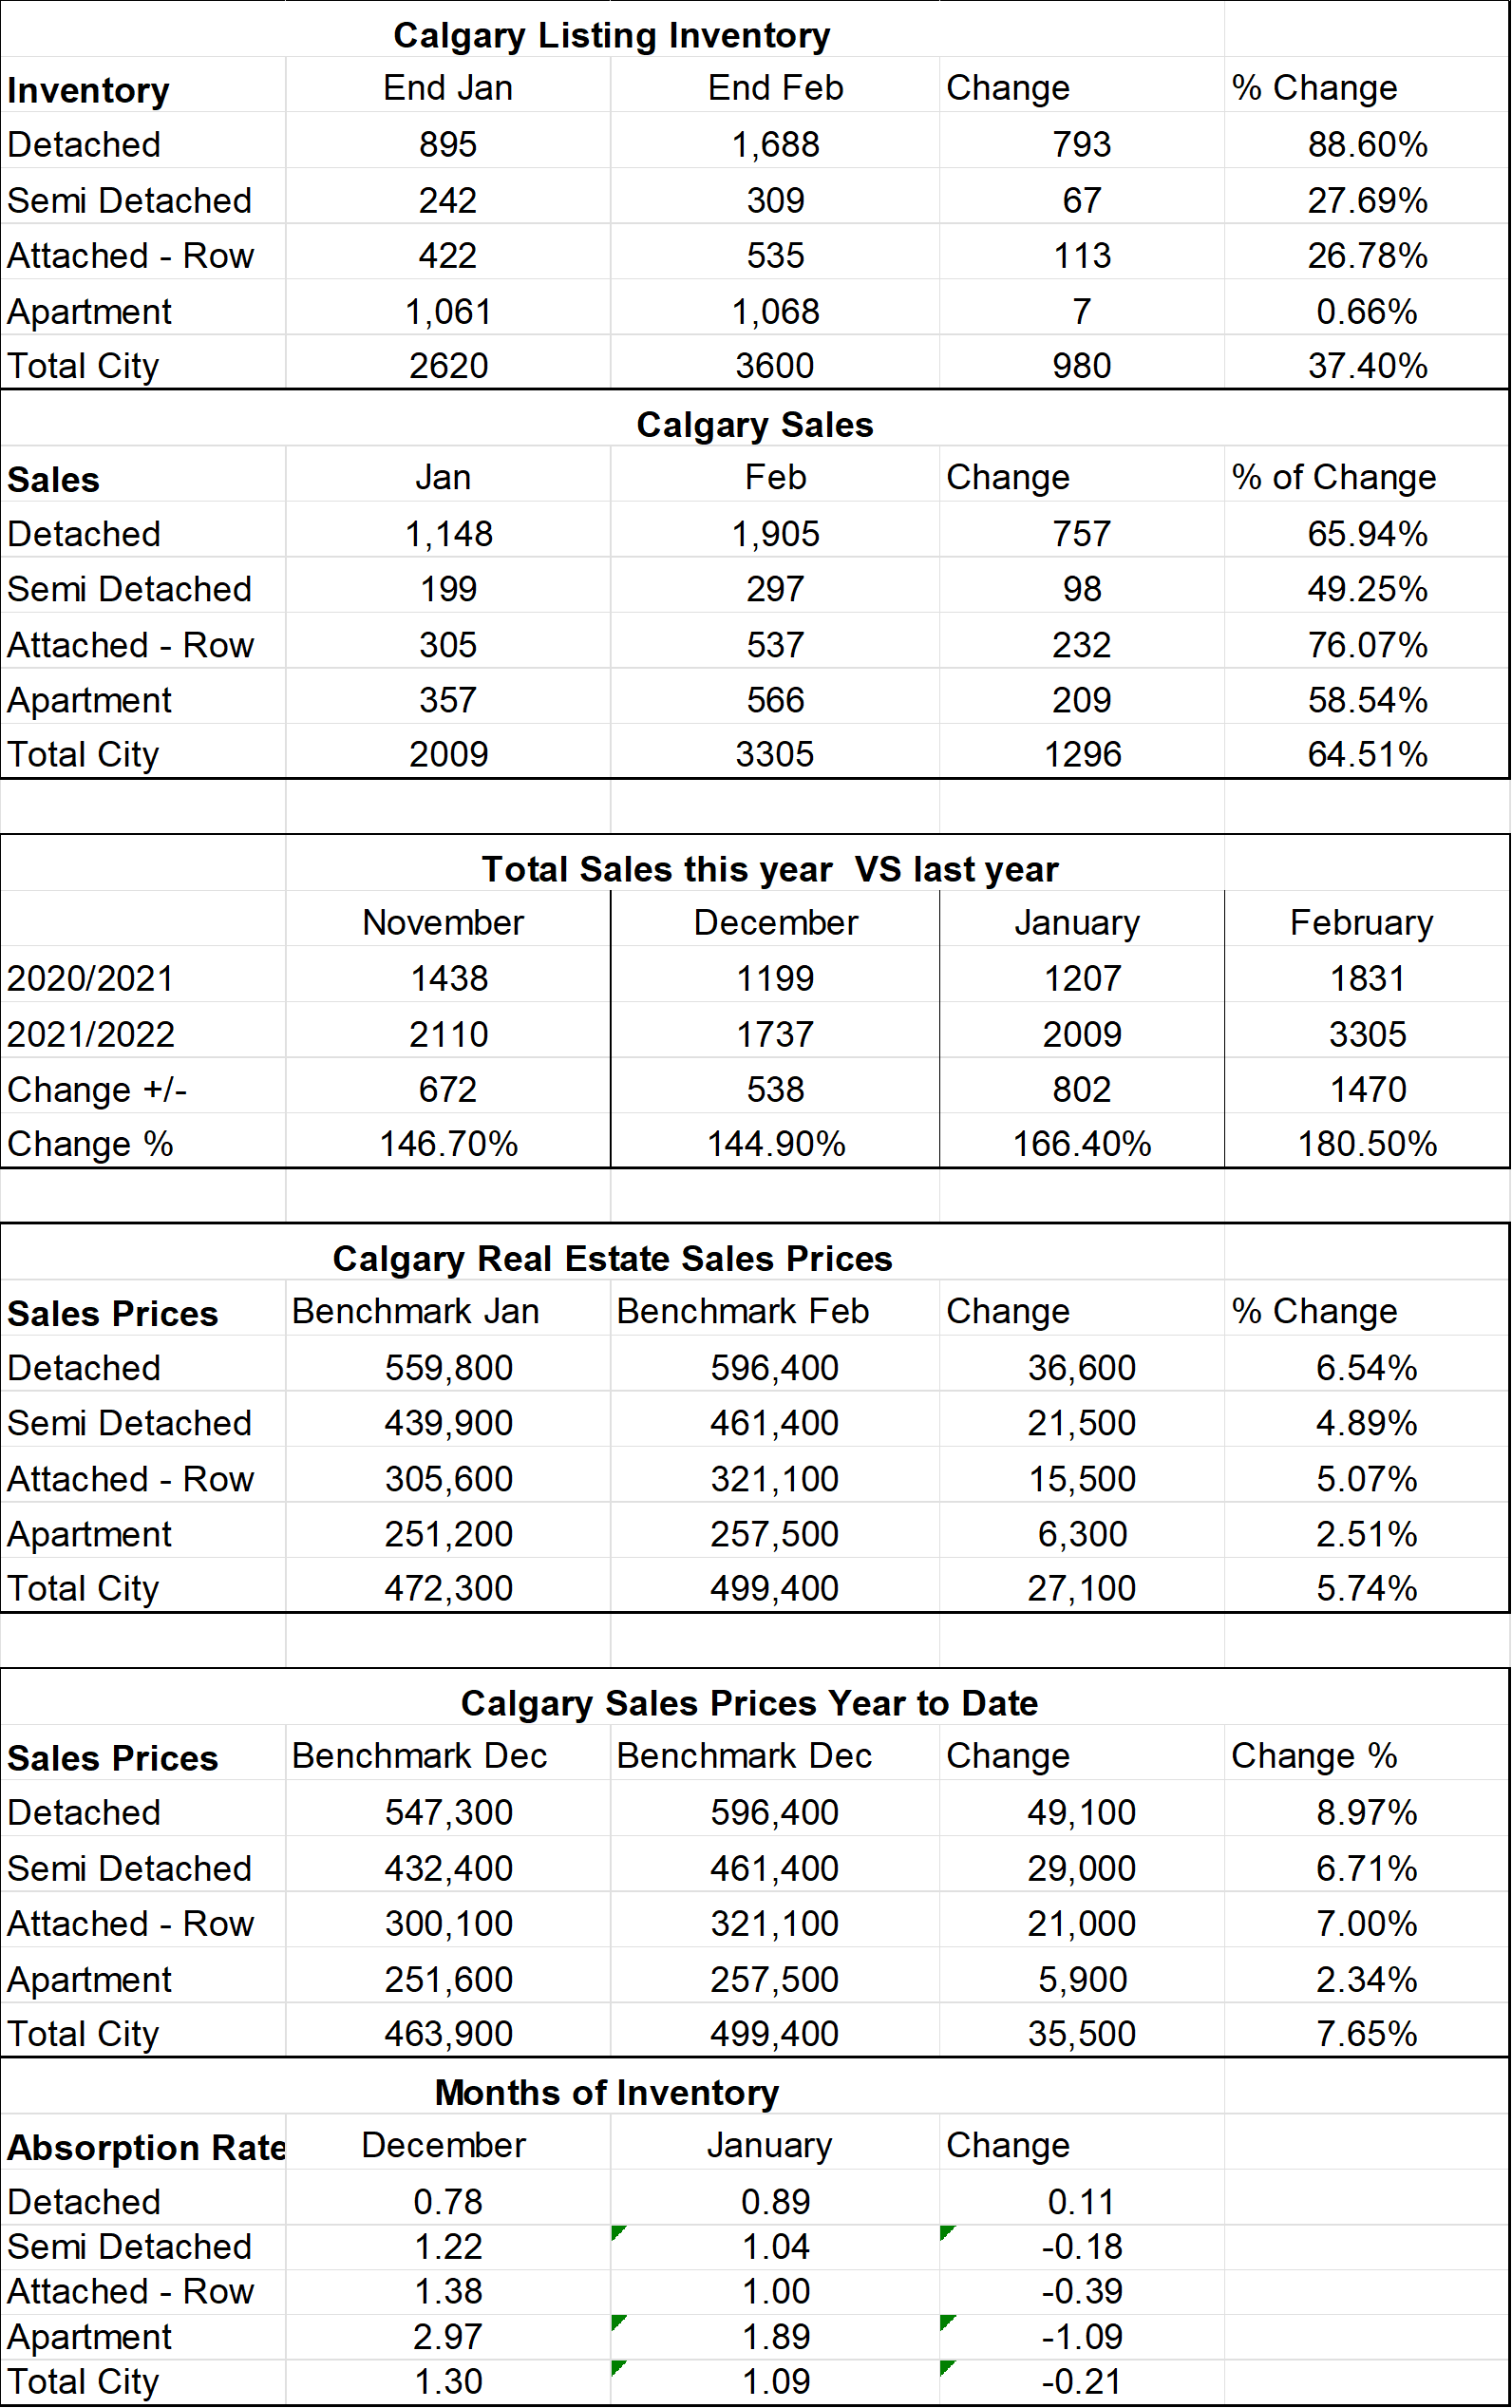
These stats are taken from the Calgary Real Estate Boards Stats Package for March 1, 2022. You will see only the critical numbers of Inventory, Sales, Prices and months of Inventory.
What is really happening in the Calgary Real Estate Market?
Following is a graph that shows the months of inventory for each housing sector. Looking at a one-year trendline gives you an indication of where things are really heading. Yes, we are moving into a deep Seller’s market.
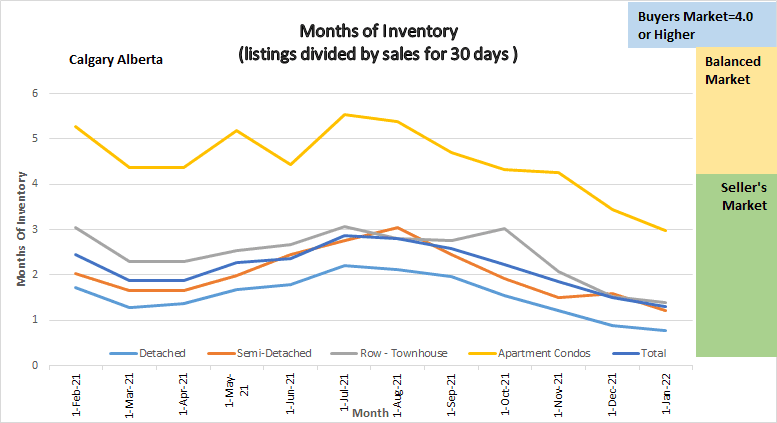
Months of Inventory
The graph above shows the one year trend of Months of Inventory for all housing categories in the Calgary Real Estate Market
Gord’s commentary for the month (just my opinion).
2022 Highlights
Calgary Listing Inventory
Listing inventory stayed the same as at the end of December. We listed 2,250 homes in January and basically sold them all.
Calgary Sales:
Sales in all sectors increased over December sales. Sales are normally at their lowest level in December and typically increase until June. What has changed is the level of sales, we took an extremely busy December and increased sales by 15.66%
Sales Compared to 2020: This puts things into Perspective
Calgary home sales were for January were 2009 while January of 2021 Sales were only 1207. We are therefore 66.4% higher than January 2021.
| Jan | Feb | Mar | Apr | May | June | July | |
| 2021 | 1207 | ||||||
| 2022 | 2009 | ||||||
| Change | + 802 | ||||||
| % Change | + 66.4% |
| Aug | Sept | Oct | Nov | Dec | Year to Date | |
| 2020 | 1574 | 1702 | 1763 | 1438 | 1199 | 16,149 |
| 2021 | 2151 | 2162 | 2186 | 2110 | 1737 | 27,686 |
| Change | +577 | +456 | + 423 | +672 | +538 | 11,537 |
| % Change | 136.6% | 126.7% | 123.9% | 146.7% | 144.9% | 171.4% |
Calgary Real Estate Benchmark Sales Prices:
Yes, Prices are going up. The benchmark price for all Sectors except Apartment Condos increased.
The highest increase is the sector with the lowest months of inventory being the Detached home sector. The benchmark price of detached homes increased by $12,500 or 2.28% this month.
Semi-detached increased by $7500.
Attached Row increased by $5,500
Apartment Condos decreased by $400
*It is important to note that Apartment Condos only went into a seller’s market in the last week so I anticipate when I report at the end of February prices will have started to increase.
Calgary Real Estate Benchmark Year to Date Sales Price: See chart below.
Same as above for this month
Current Months of Inventory (Absorption Rate):
The Months of inventory decreased in all sectors this month. As you can see in my chart above our months of inventory keeps decreasing in all sectors putting us into a deep seller’s market position.
What might 2022 bring: (again just my opinion)
My prediction last month has come true, only it is happening much quicker than I imagined. The sales increases with inventory decreases have really pushed up prices of Detached homes, this increase is pushing people into buying Semi- Detached homes and on down the line so that even apartment condominiums are now in a seller’s market position.
It is also important to note that these numbers vary by community, and by price range. If you would like numbers for your community, or more specific numbers for your home please contact us.
Below is a summary of numbers in chart form. All numbers are taken from the Calgary Real Estate Boards monthly Stats package.
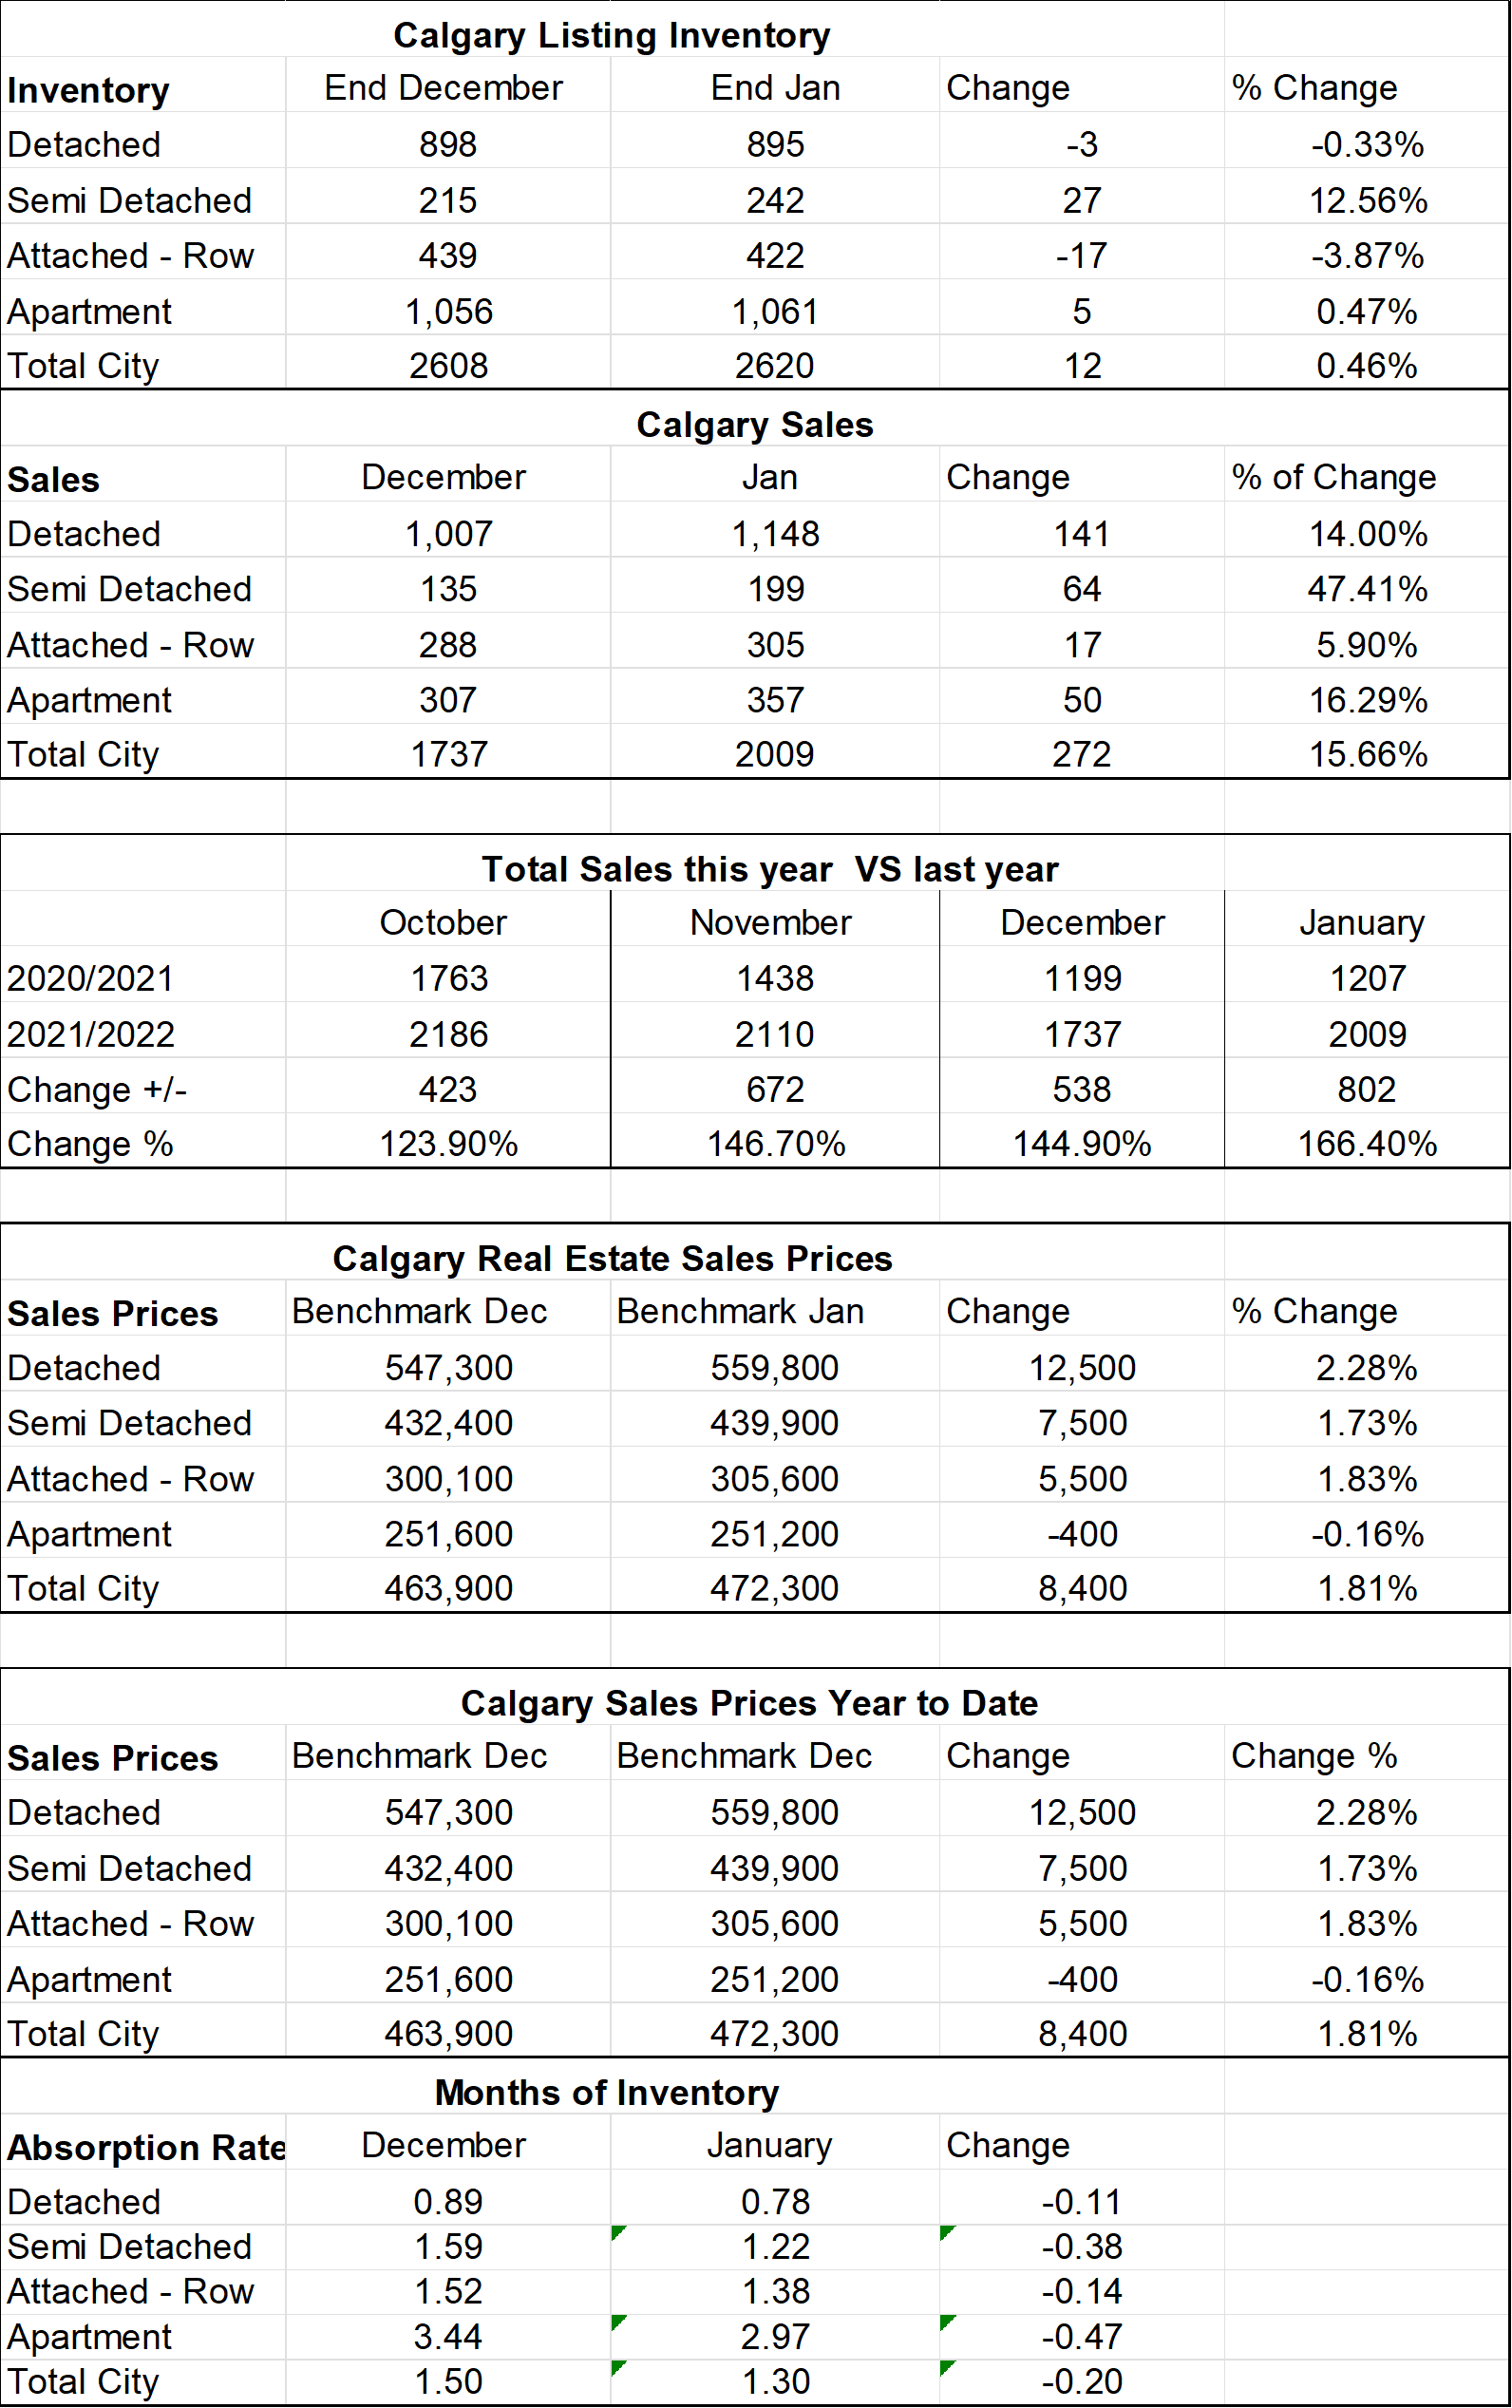
Stats from the Calgary Real Estate Board
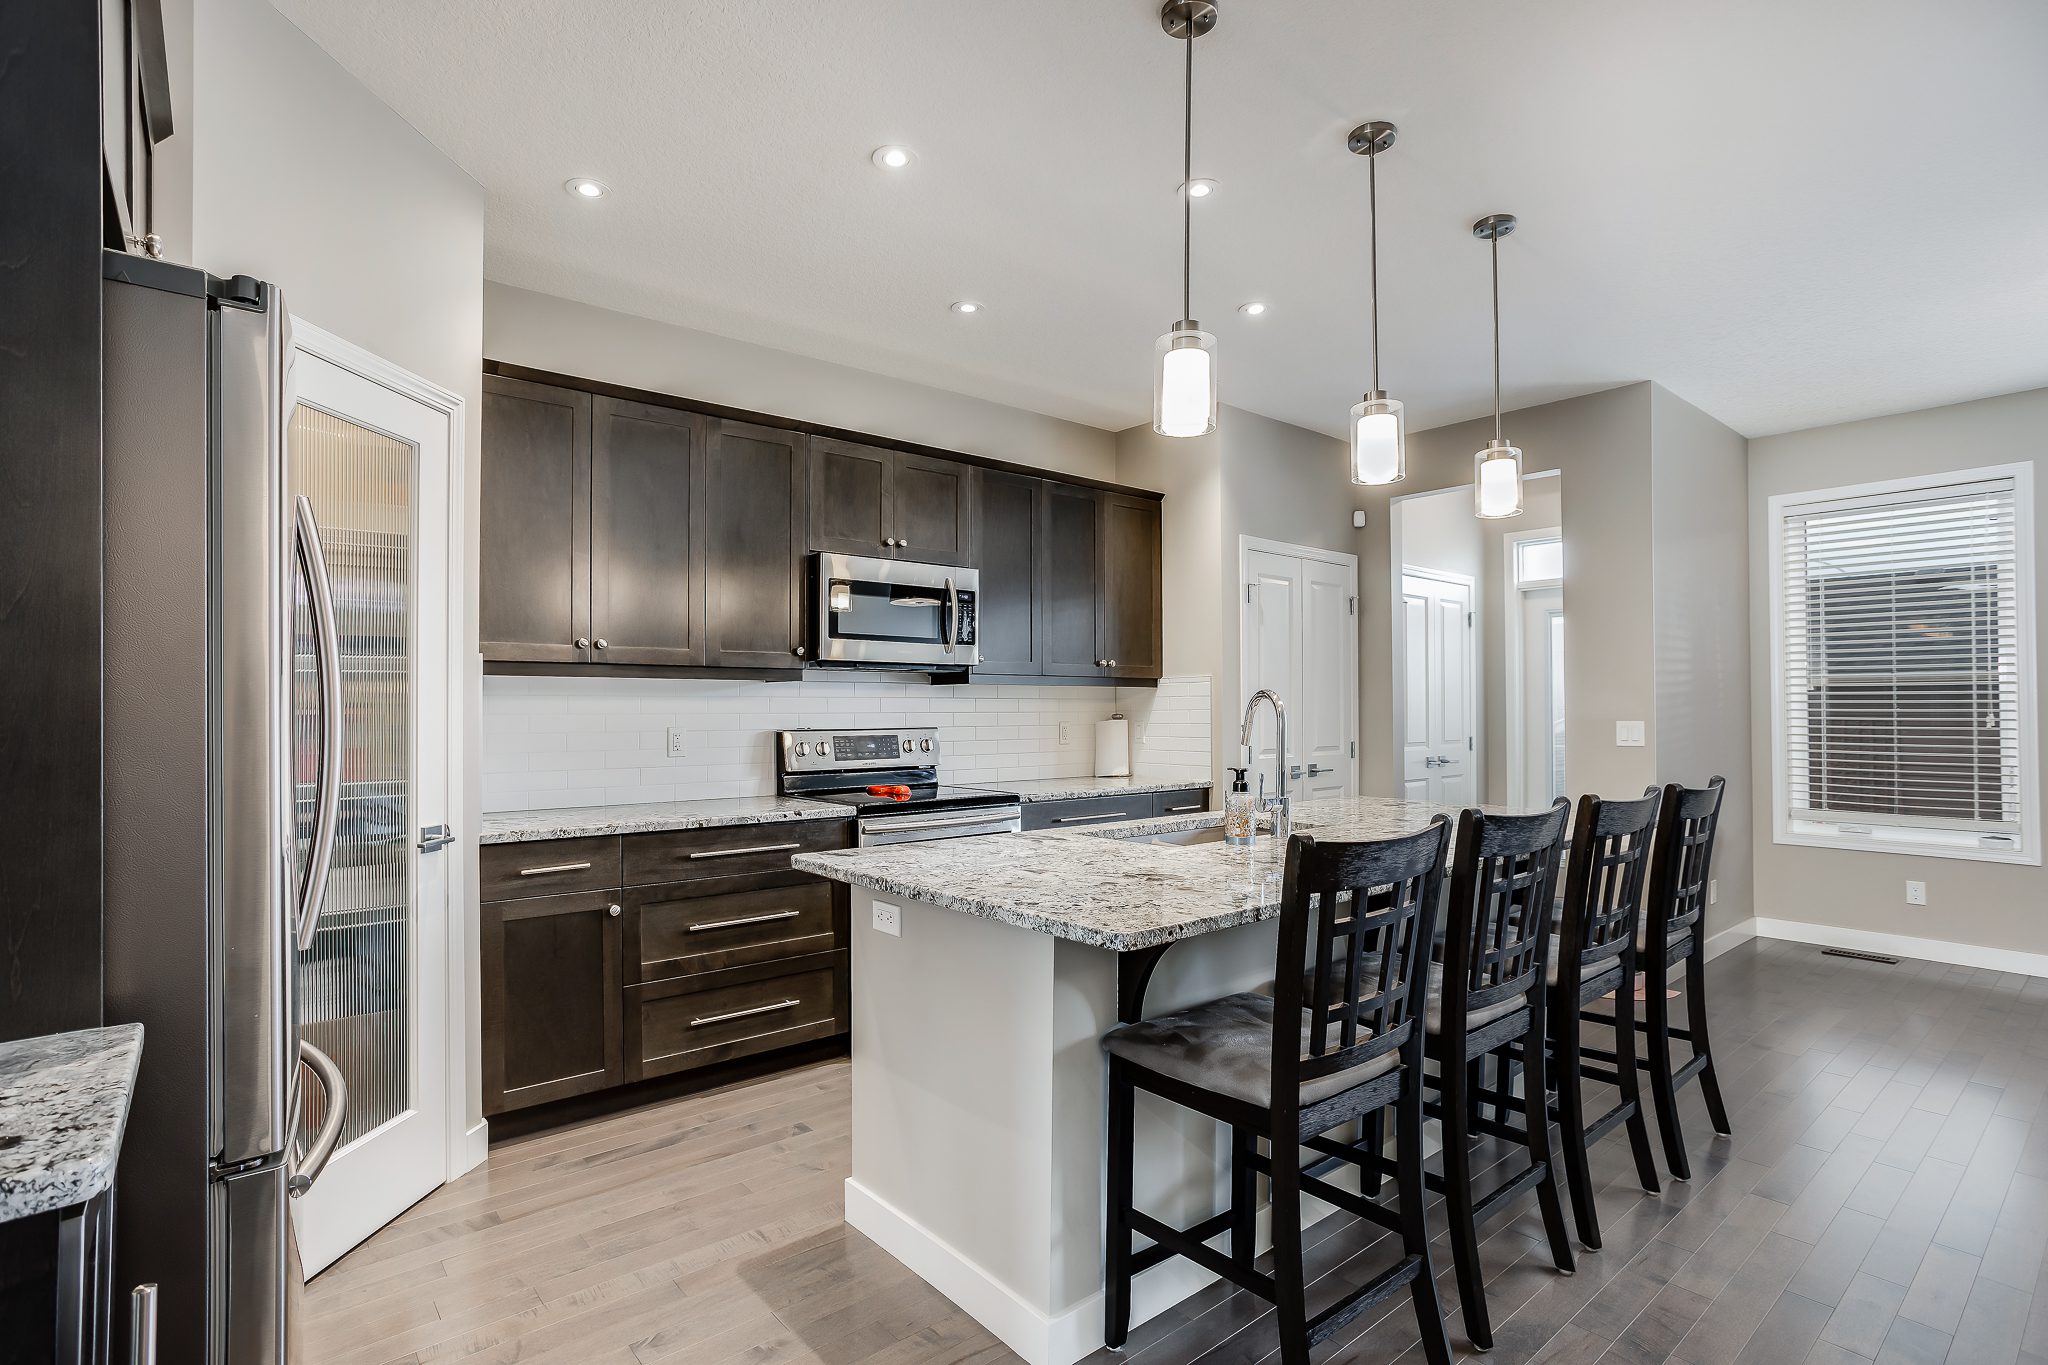
Just listed this beautiful starter home in Midtown Airdrie
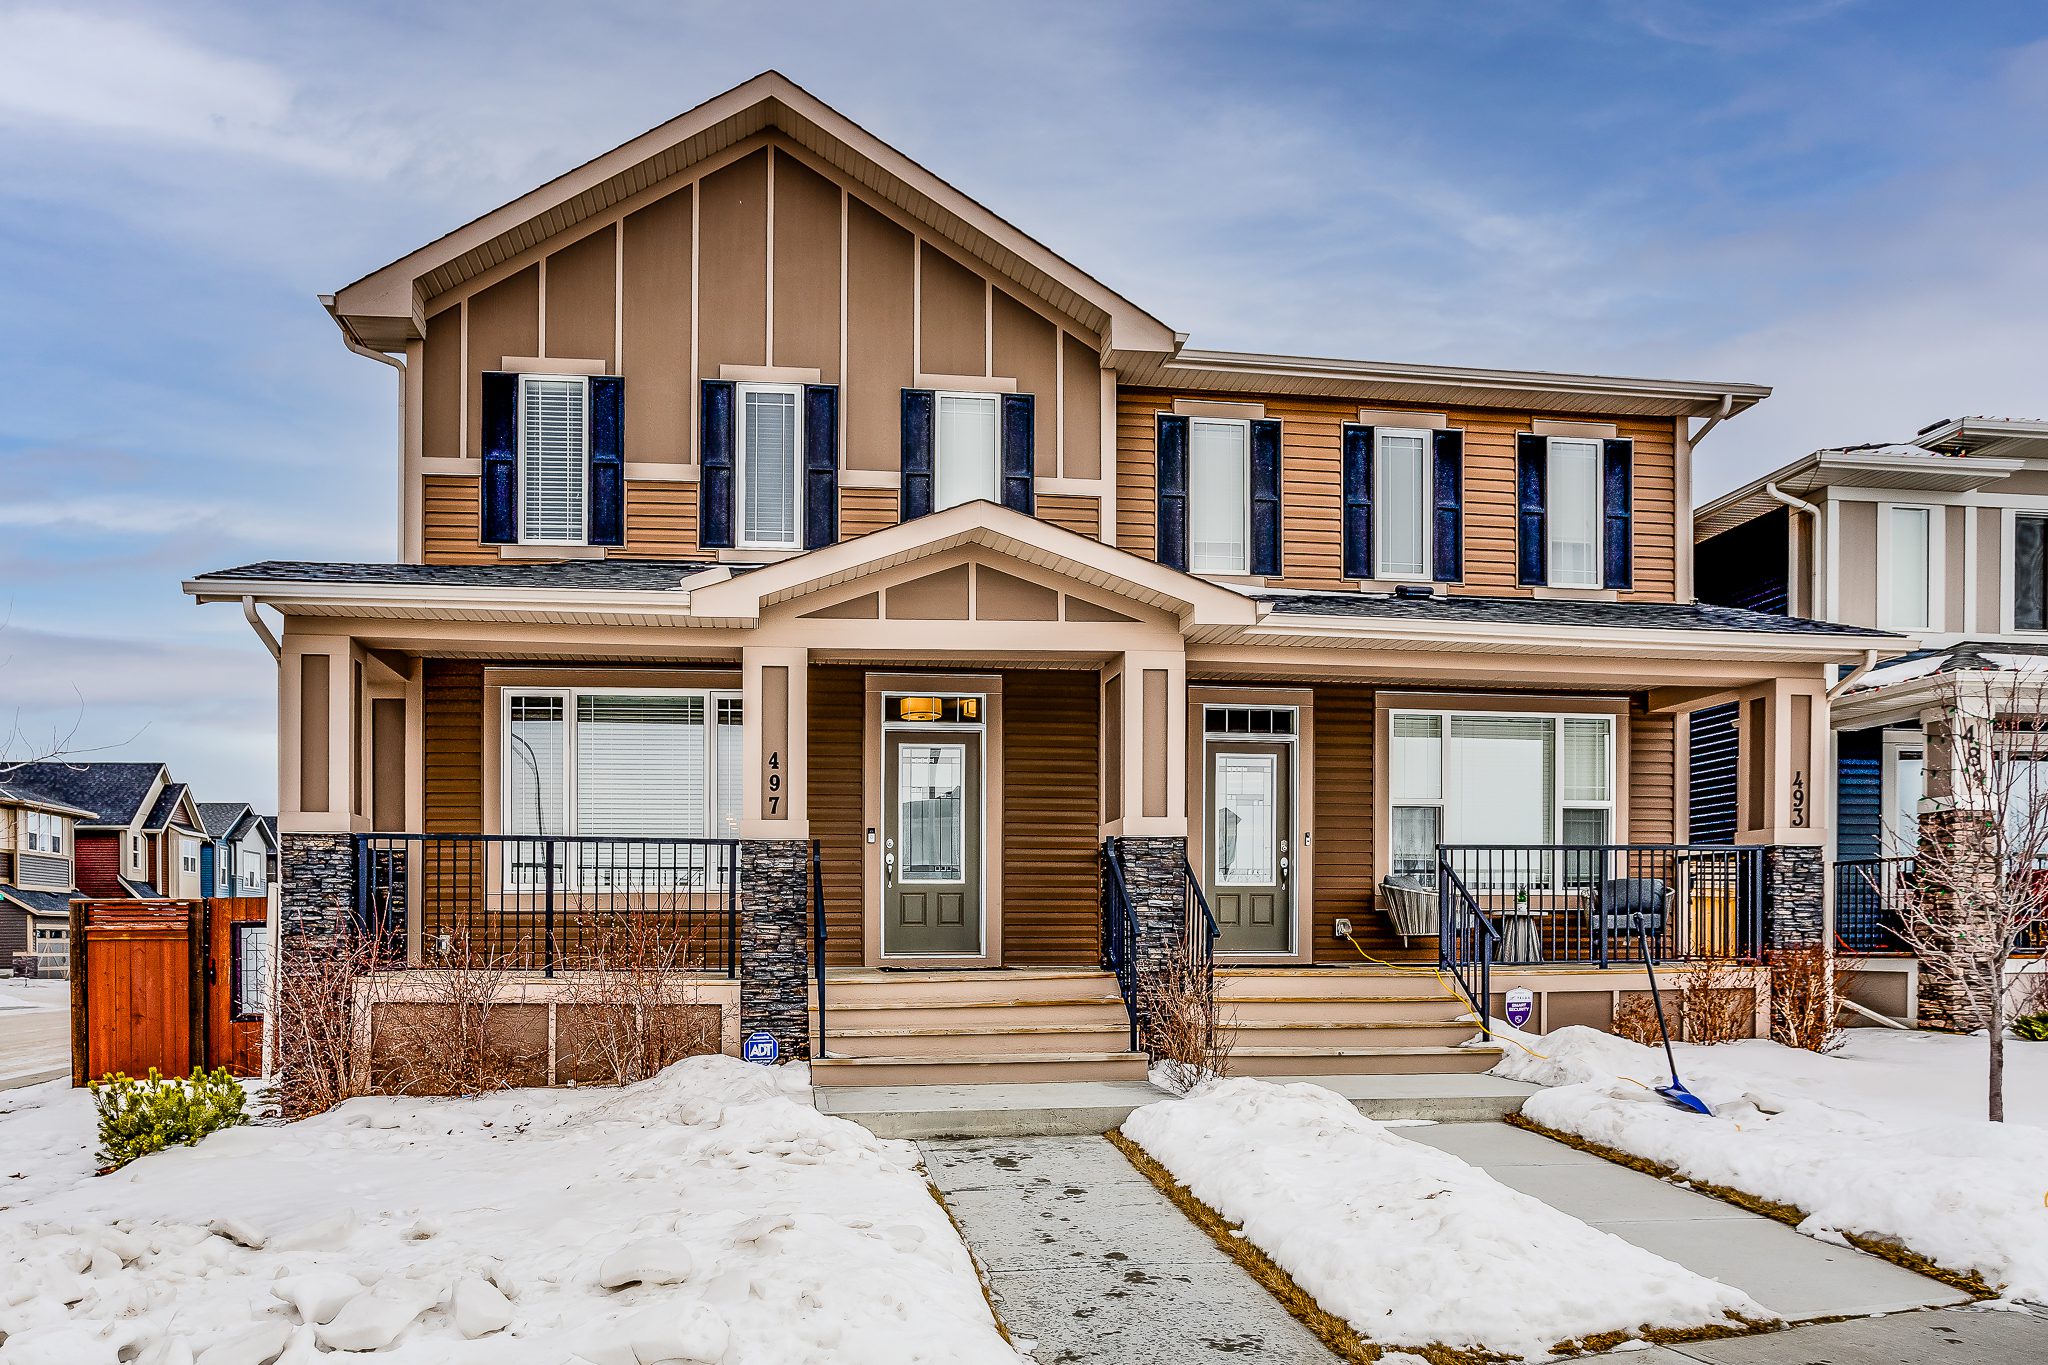
Front
MLS # A1171645
List Price: $449,900
See full listing with photos at https://www.tswrealestategroup.com/for-sale/497-midtown-parkway-sw–66904179
Beautiful 1546 square foot 2 Storey in Midtown with double detached garage. Located kitty-corner to the pond providing great views. This home was built by Trico and features a customized “Fairview” floor plan with extensive builder upgrades. Situated on a larger than normal corner lot provides for extra windows providing an abundance of natural light. Main floor features 9-foot ceilings and real hardwood. Upon entry the living room is spacious and bright. The kitchen features upgraded granite, a large island, an extra closet for storage, extra drawers, a large pantry, and a wine fridge. Complete the main floor with a spacious dining room and a guest bathroom. Upstairs you will find the primary bedroom that boasts four windows for plenty of natural light, an ensuite with double sinks and a walk-in closet with built in shelving. Complete the upstairs with two additional bedrooms with walk in closets, main bath, and laundry. The builder built the lower level that offers 9-foot ceilings and the typical staircase wall was partially removed giving a unique view to the rec room as you descend the stairs resulting in an open feeling rec room. The yard is perfect for entertaining and provides a large patio with gas fireplace, gas for your BBQ and extensive landscaping. Additionally, you will find you heated and insulated double detached garage and a storage shed with a door to alley making it perfect for toy storage. On those hot summer day enjoy your central air.