January 2022 Market Snapshot
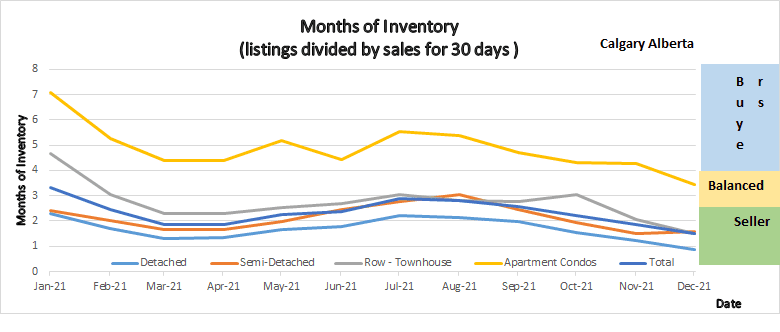
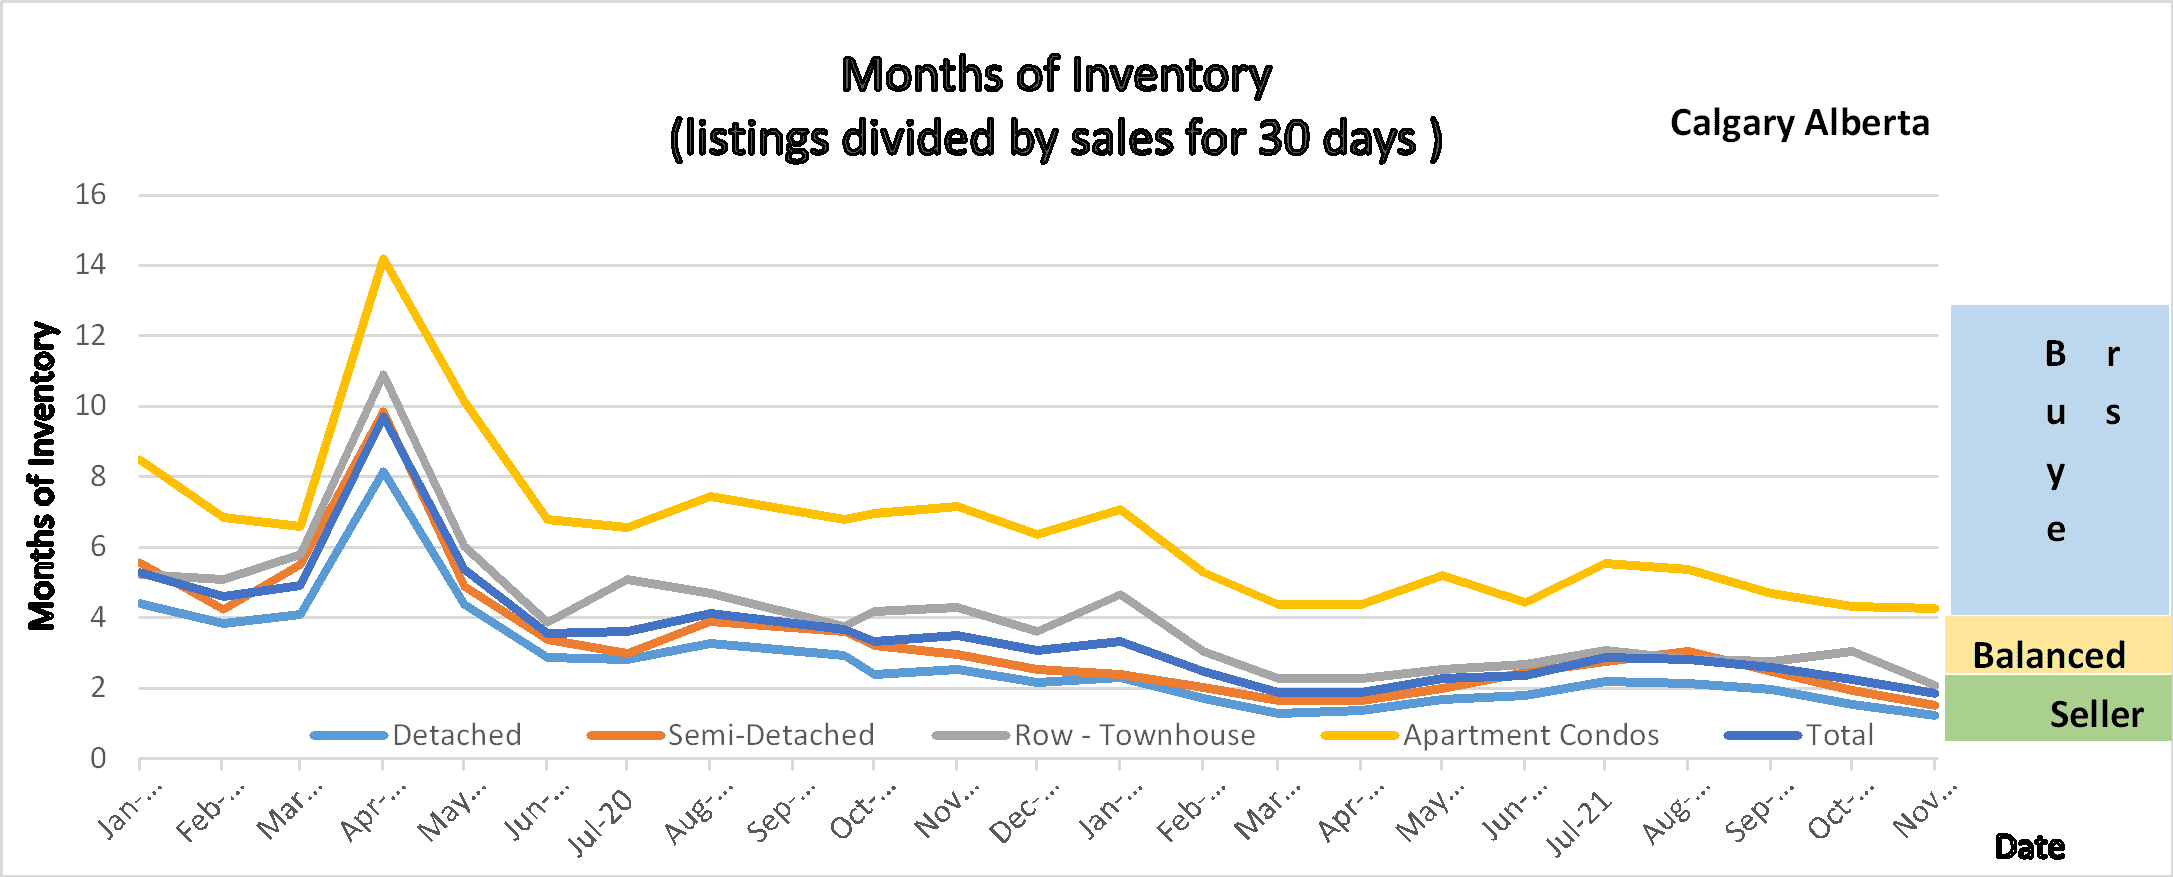
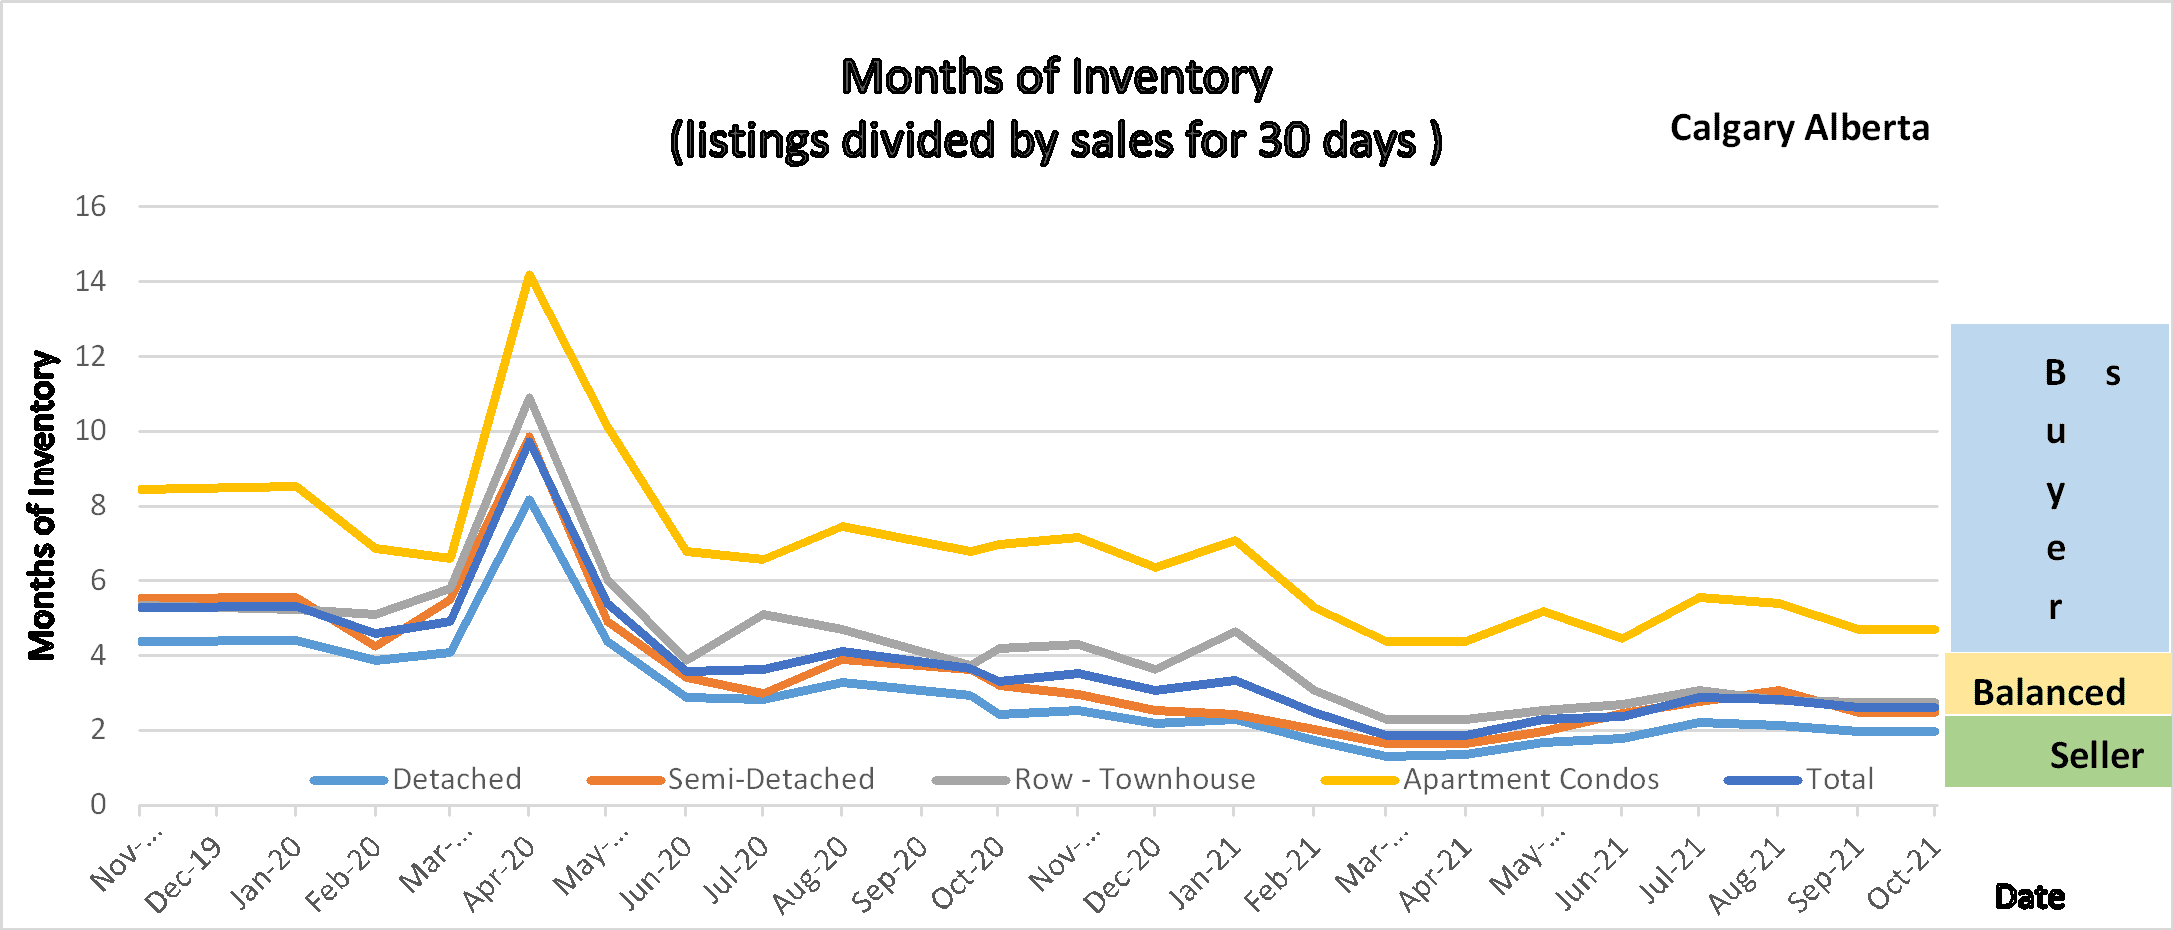
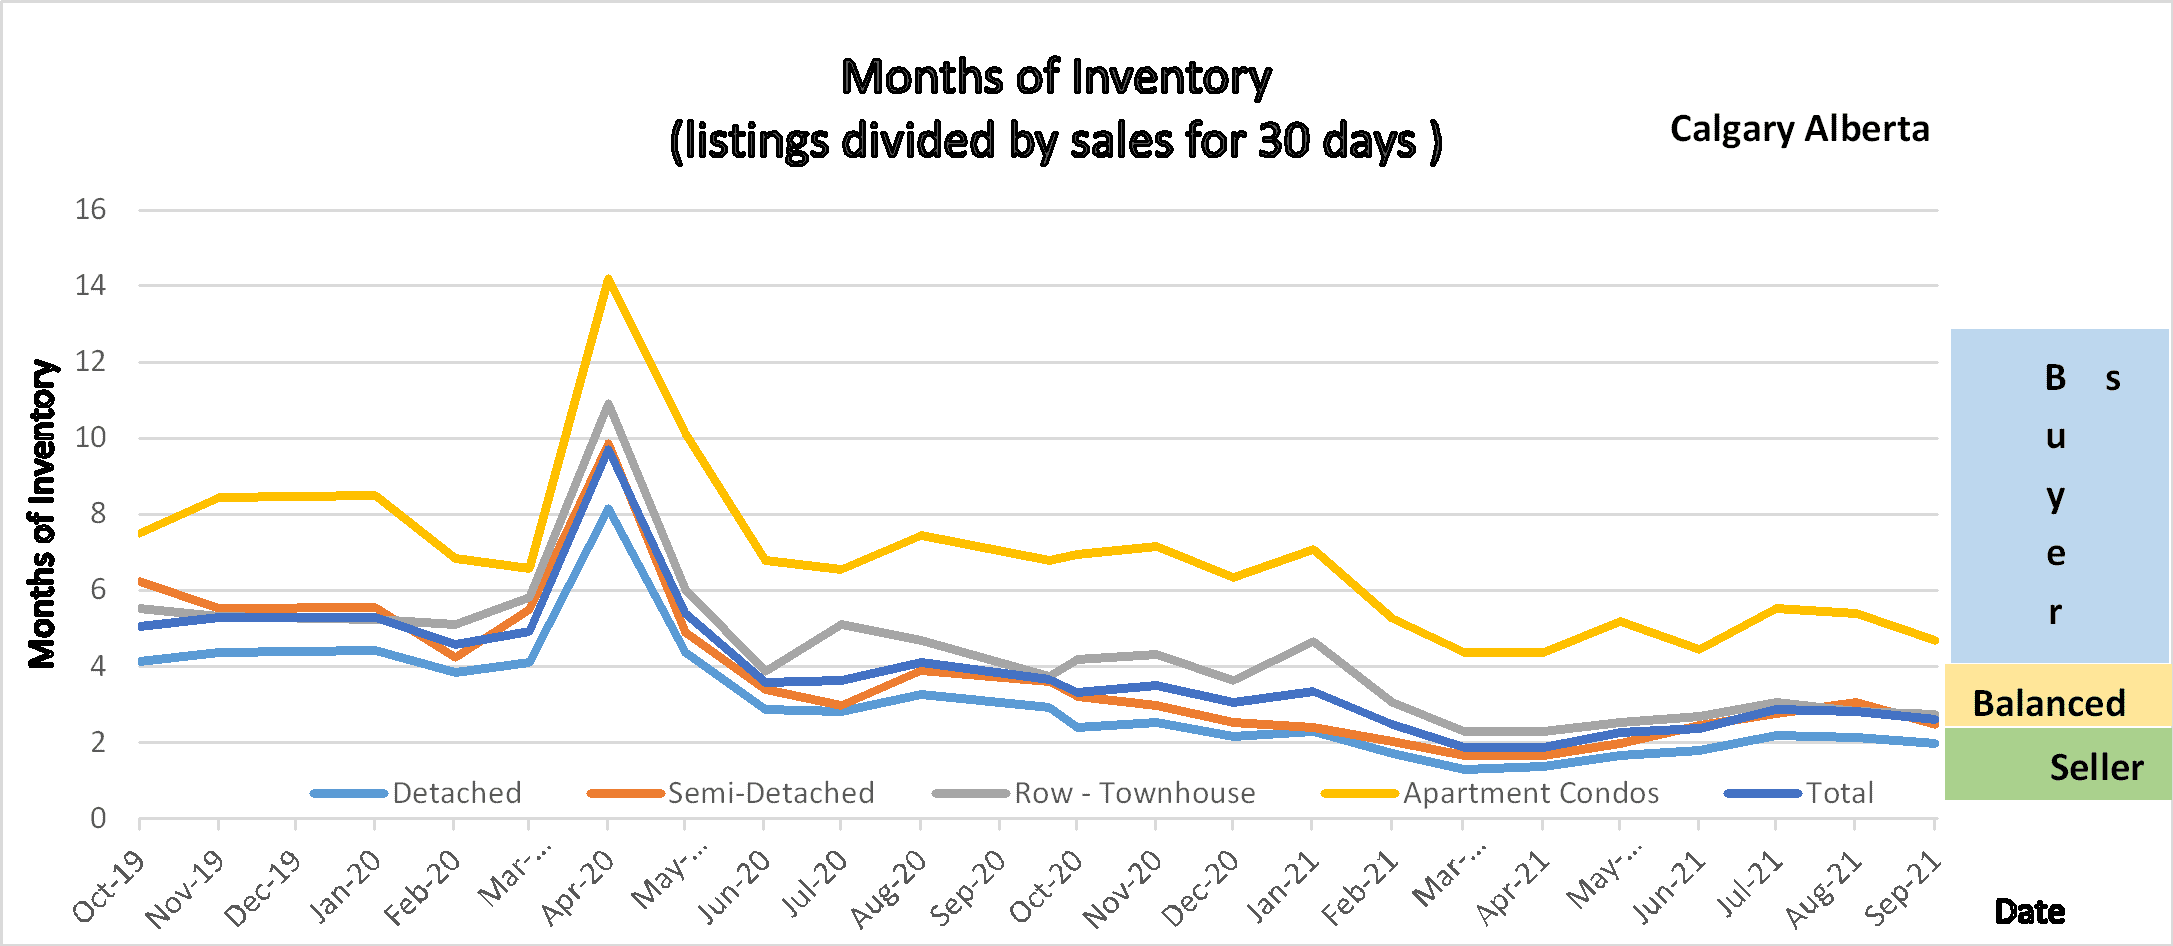
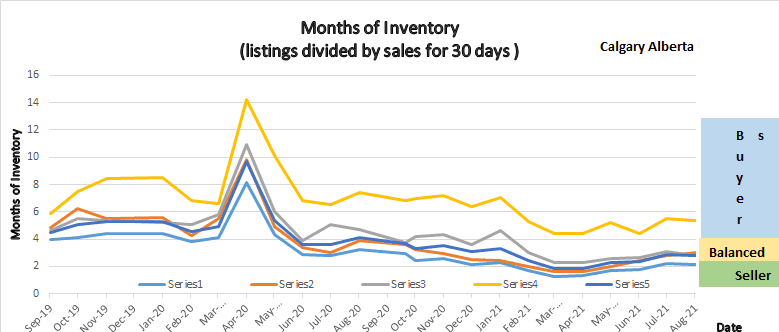
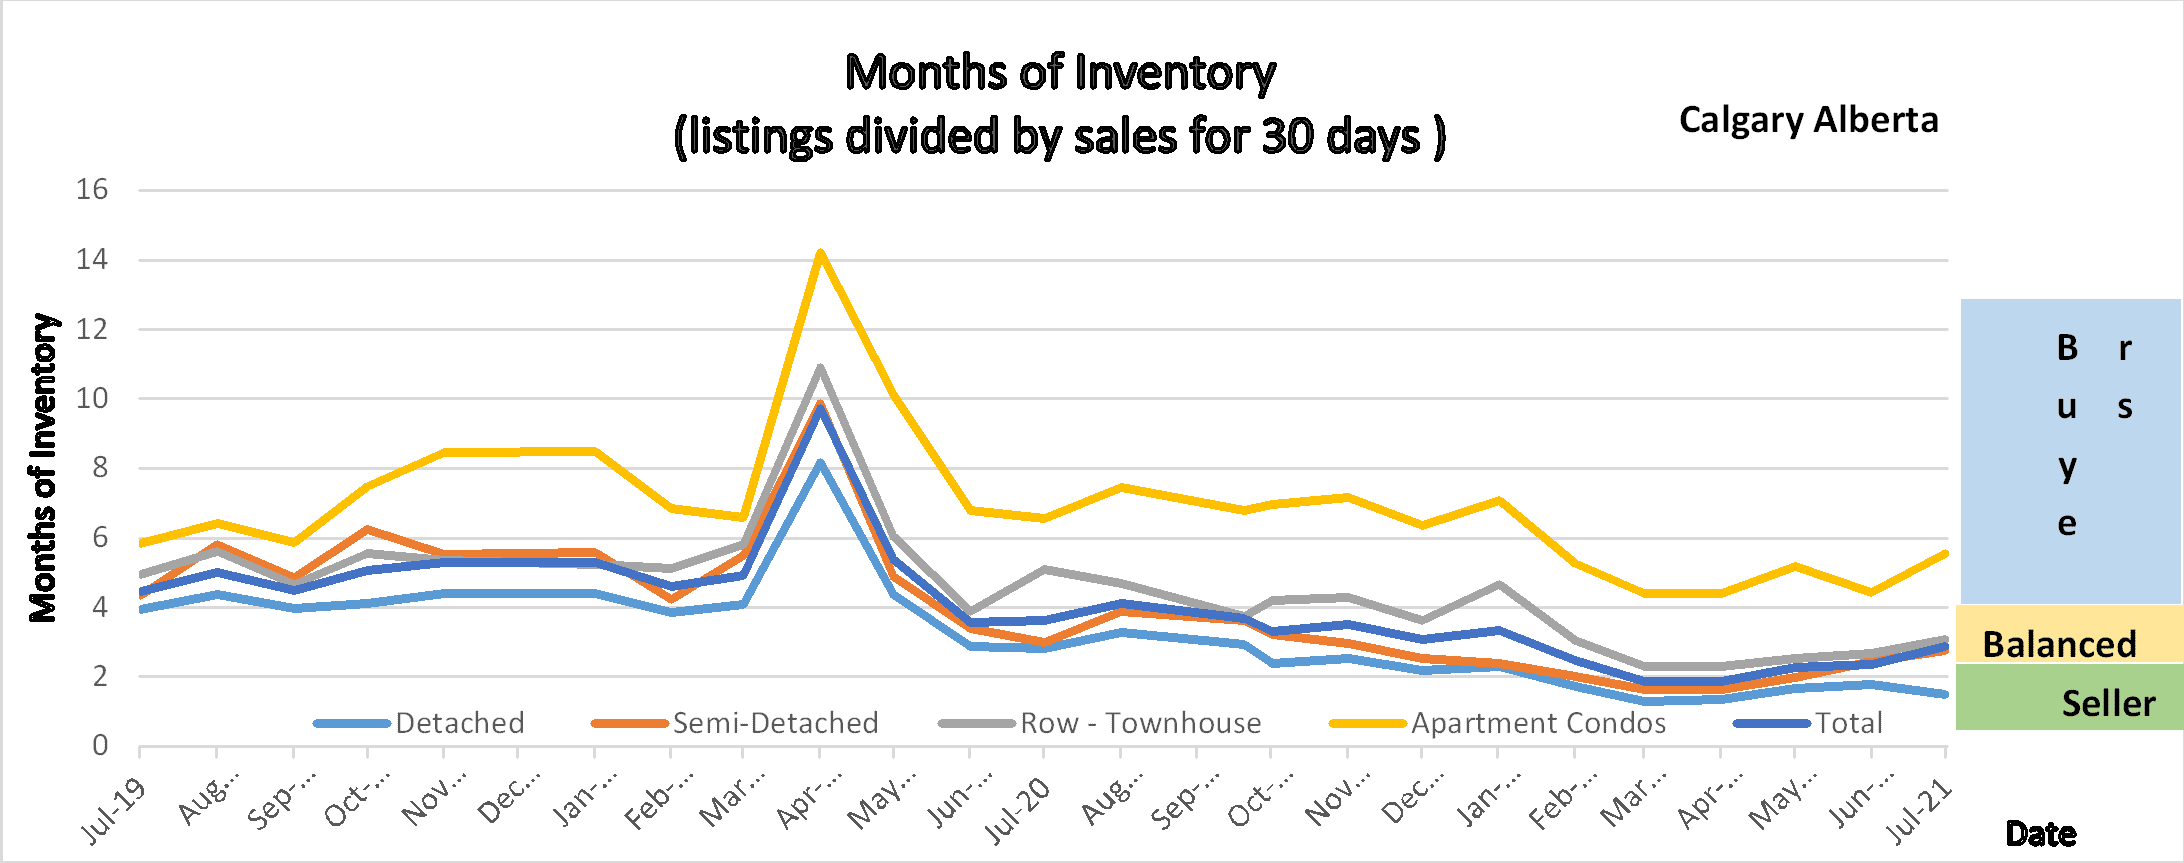
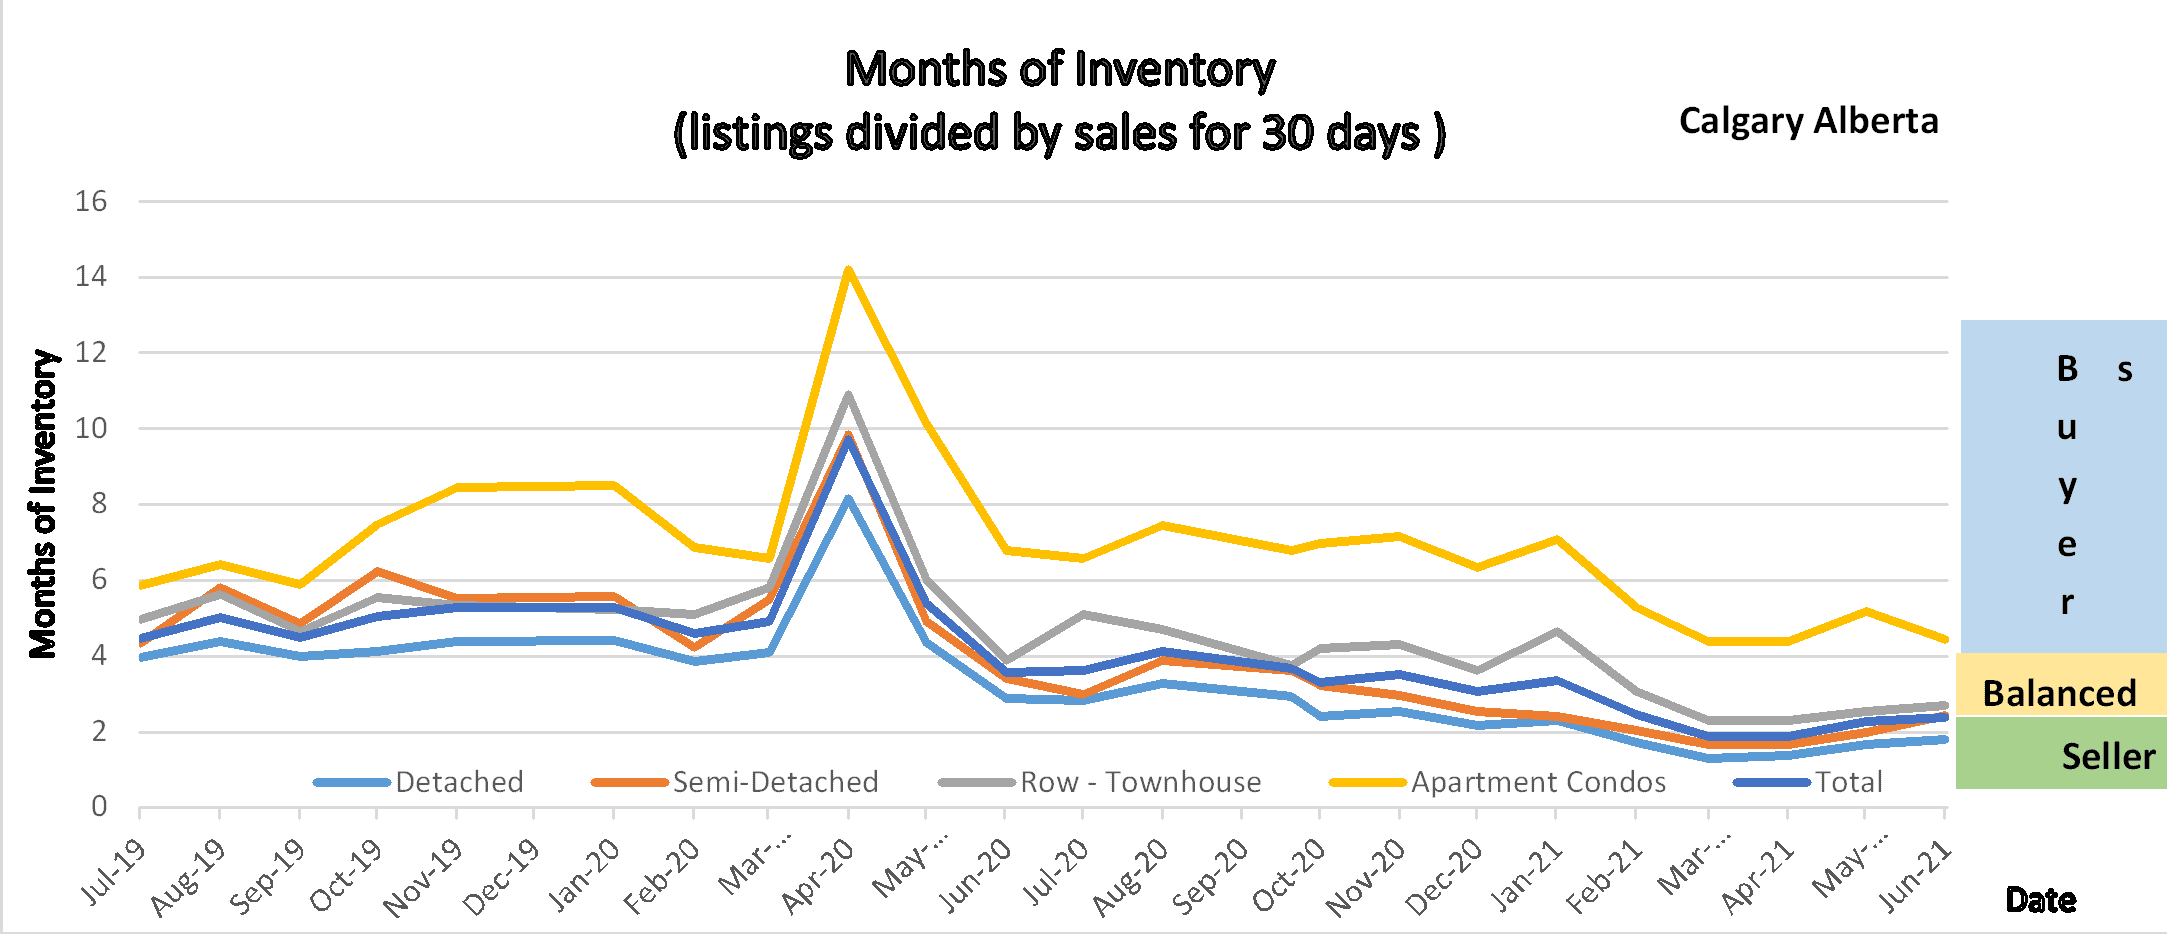
The one-year trend of Months of Inventory
What is really happening in the Calgary Real Estate Market?
Gord’s commentary for the month (just my opinion).
Some 2022 Highlights
*Calgary Continues to break sales records
* We are entering 2022 with some of the tightest conditions seen in over a decade (CREB)
* We are starting 2022 off very much like 2006 which saw a booming market with prices increasing.
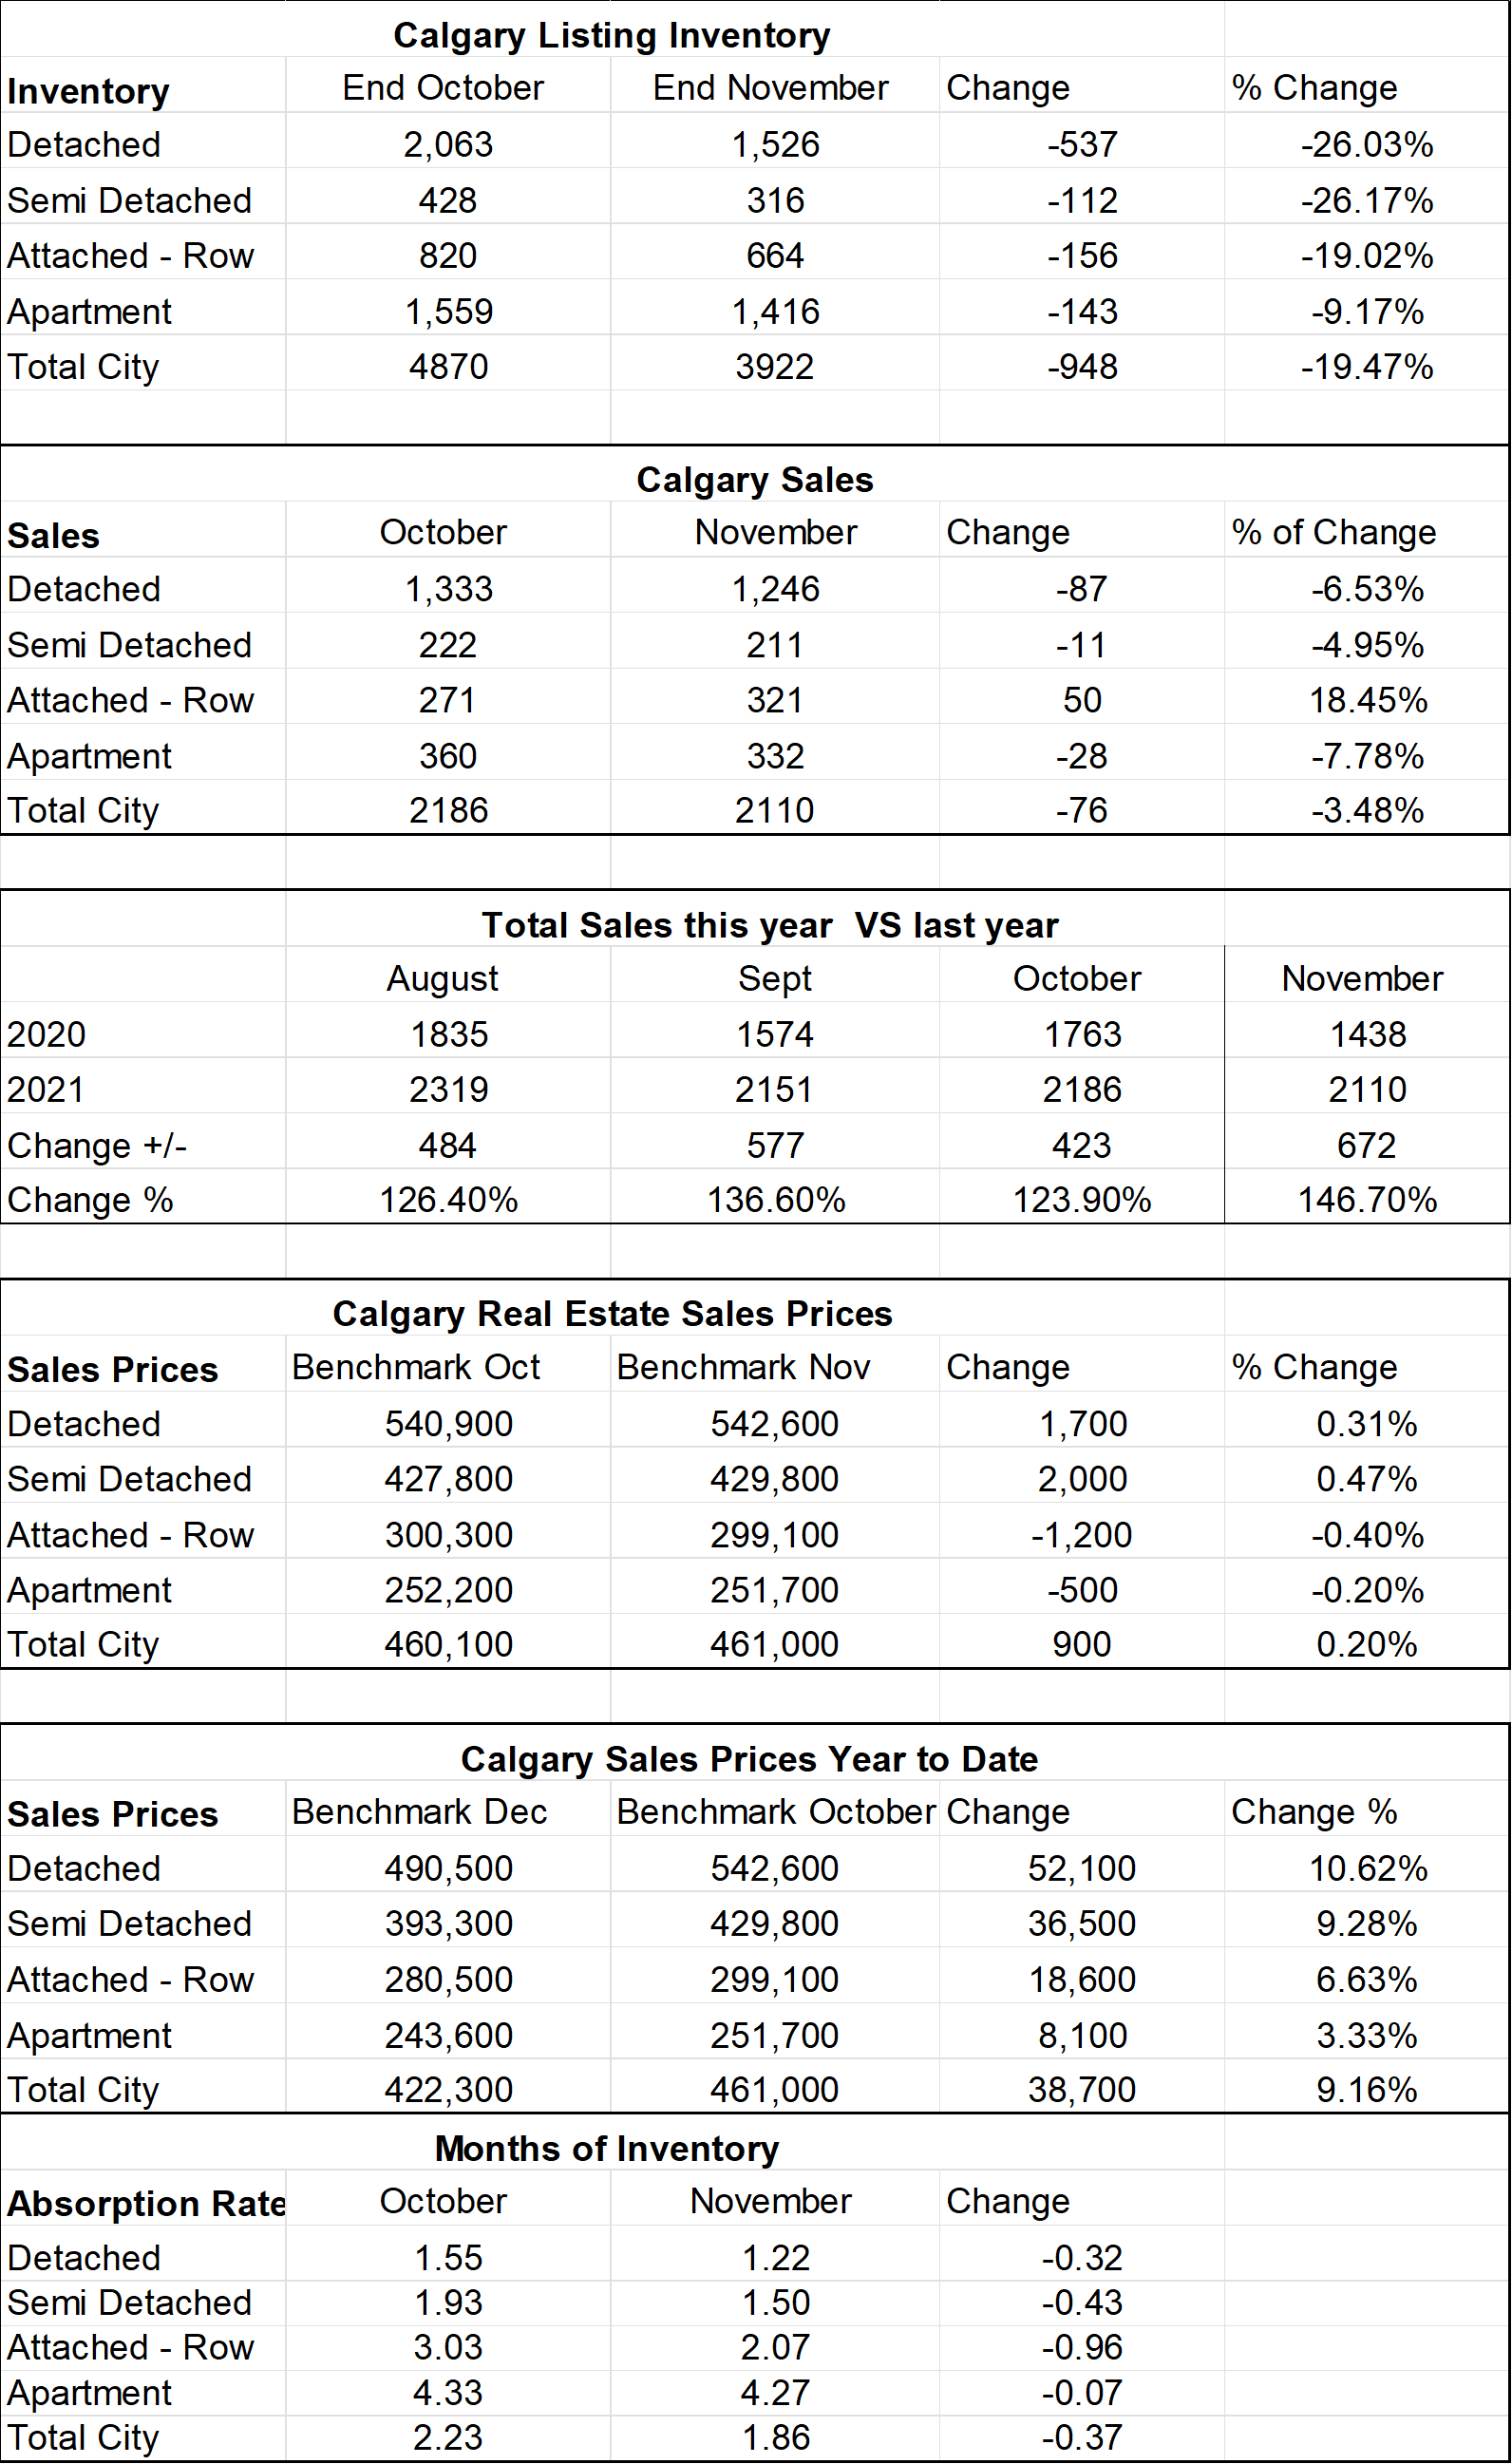
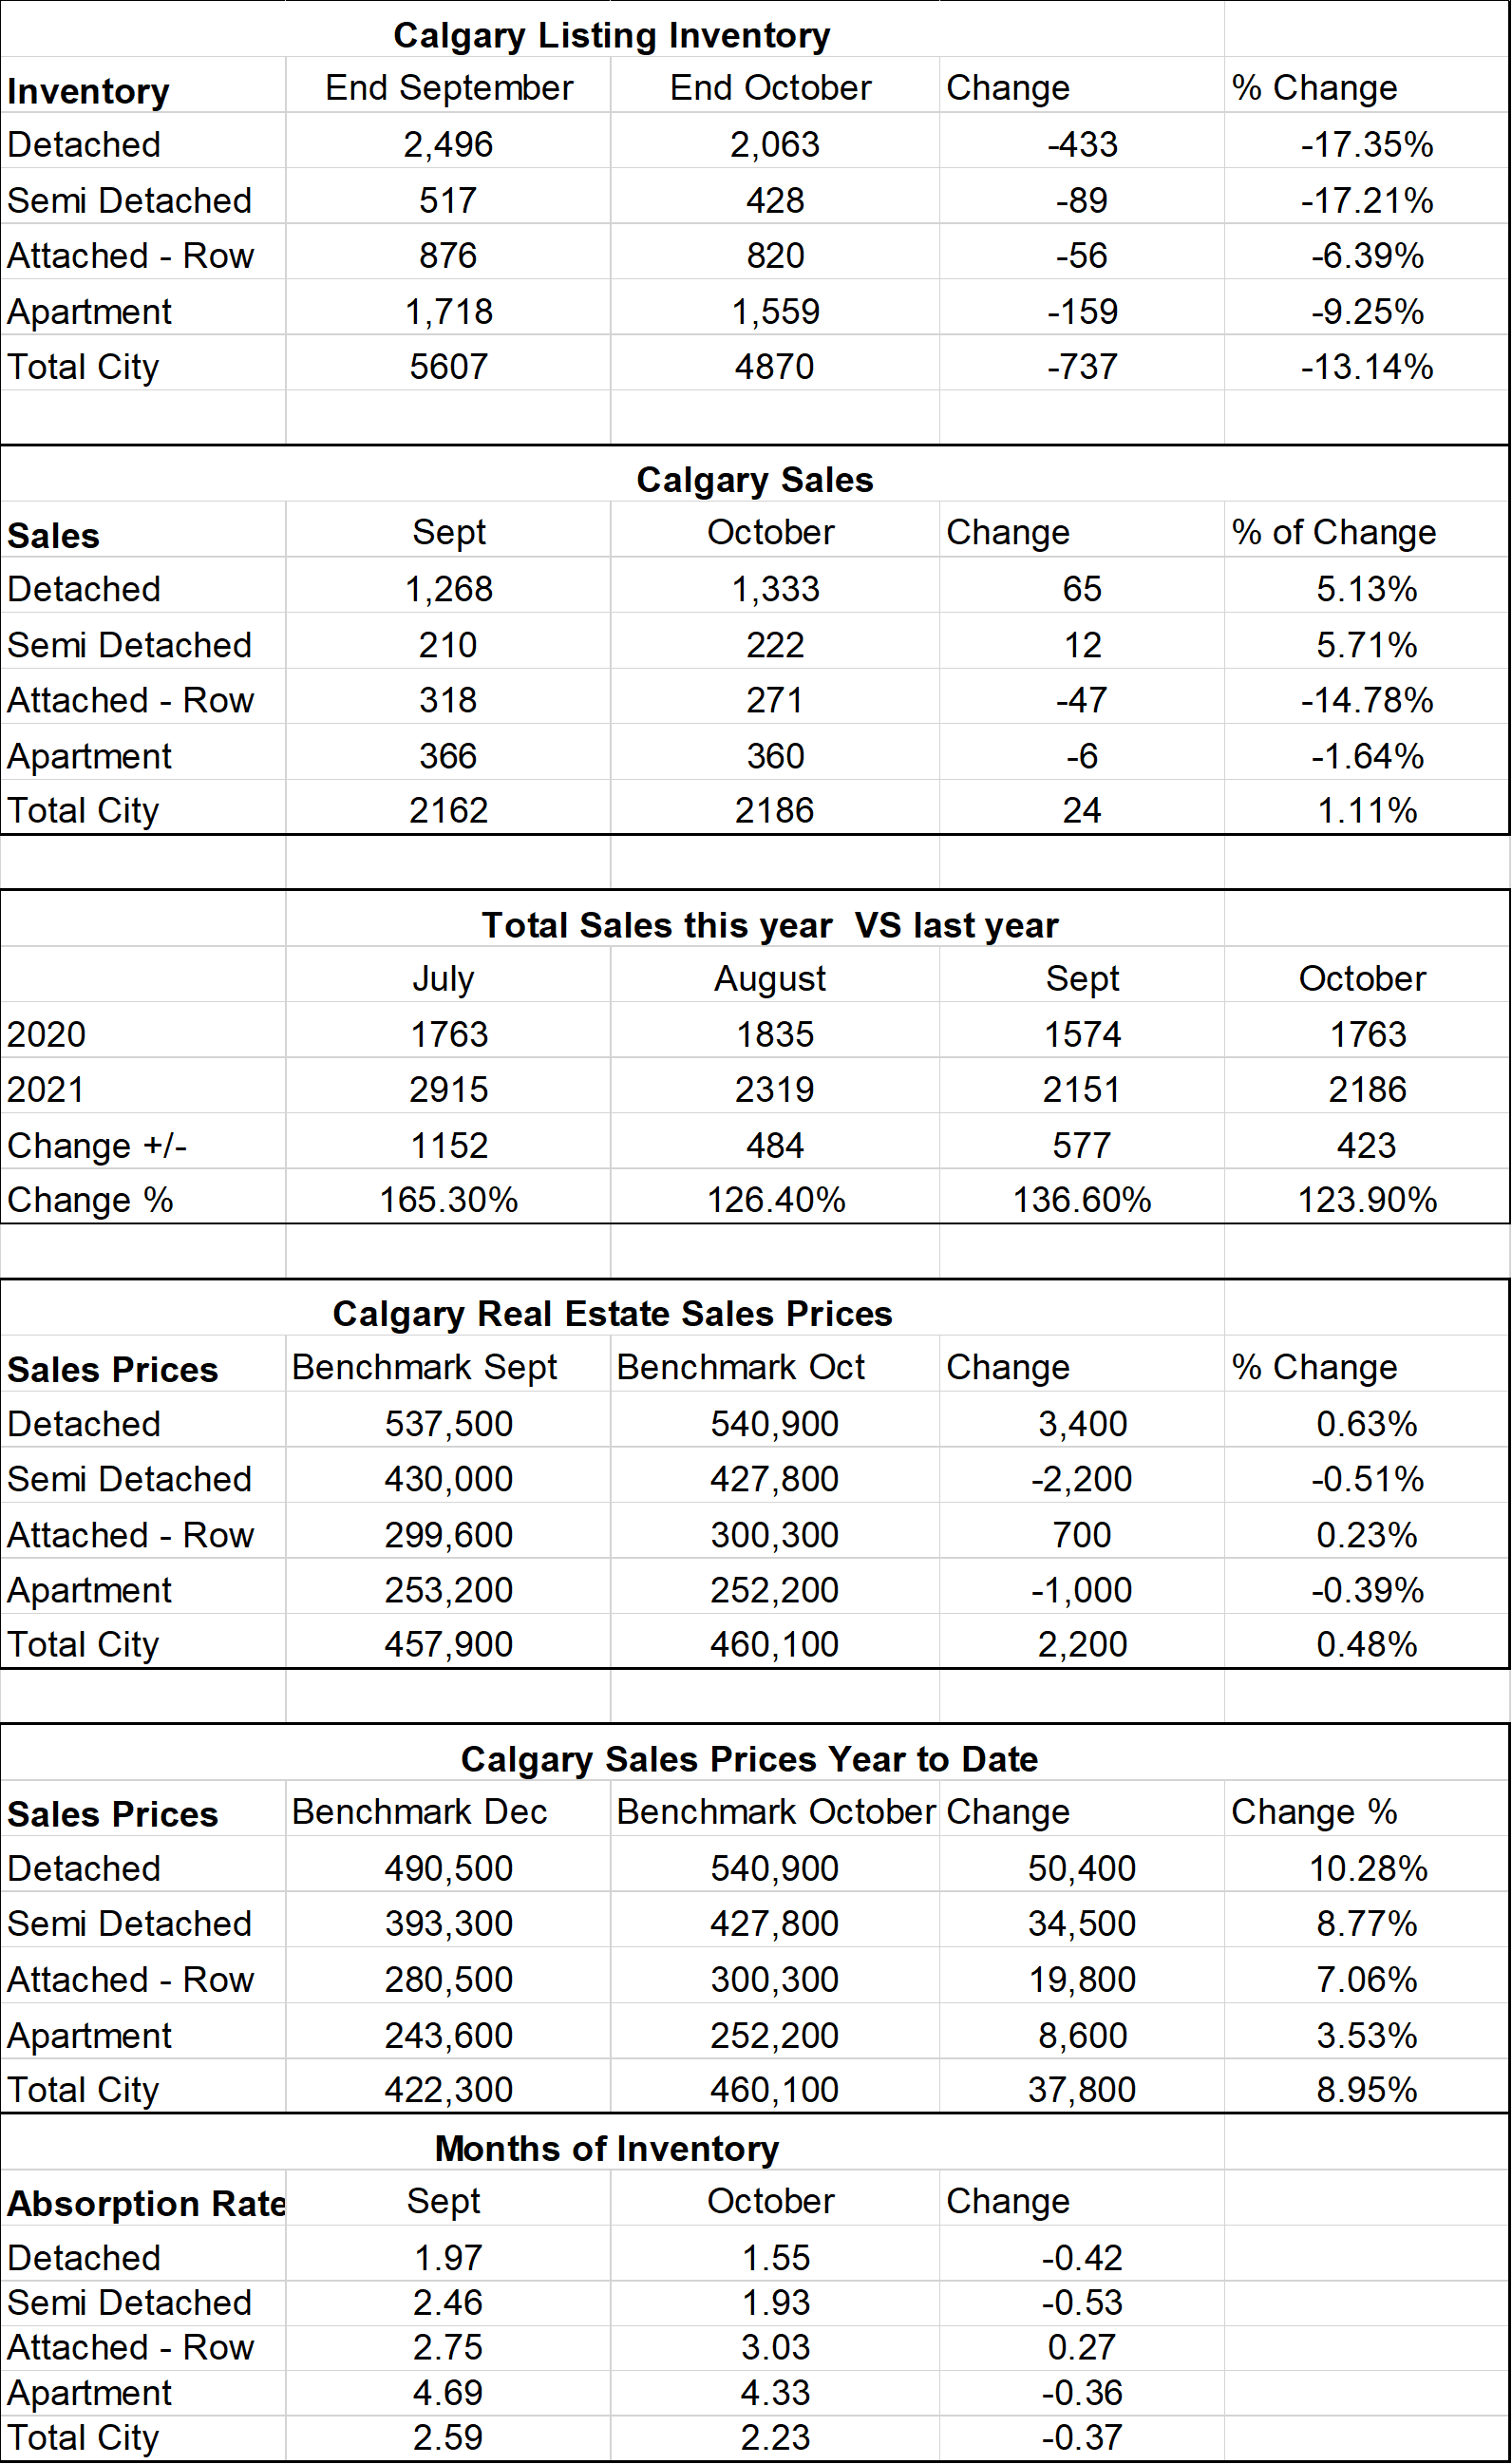
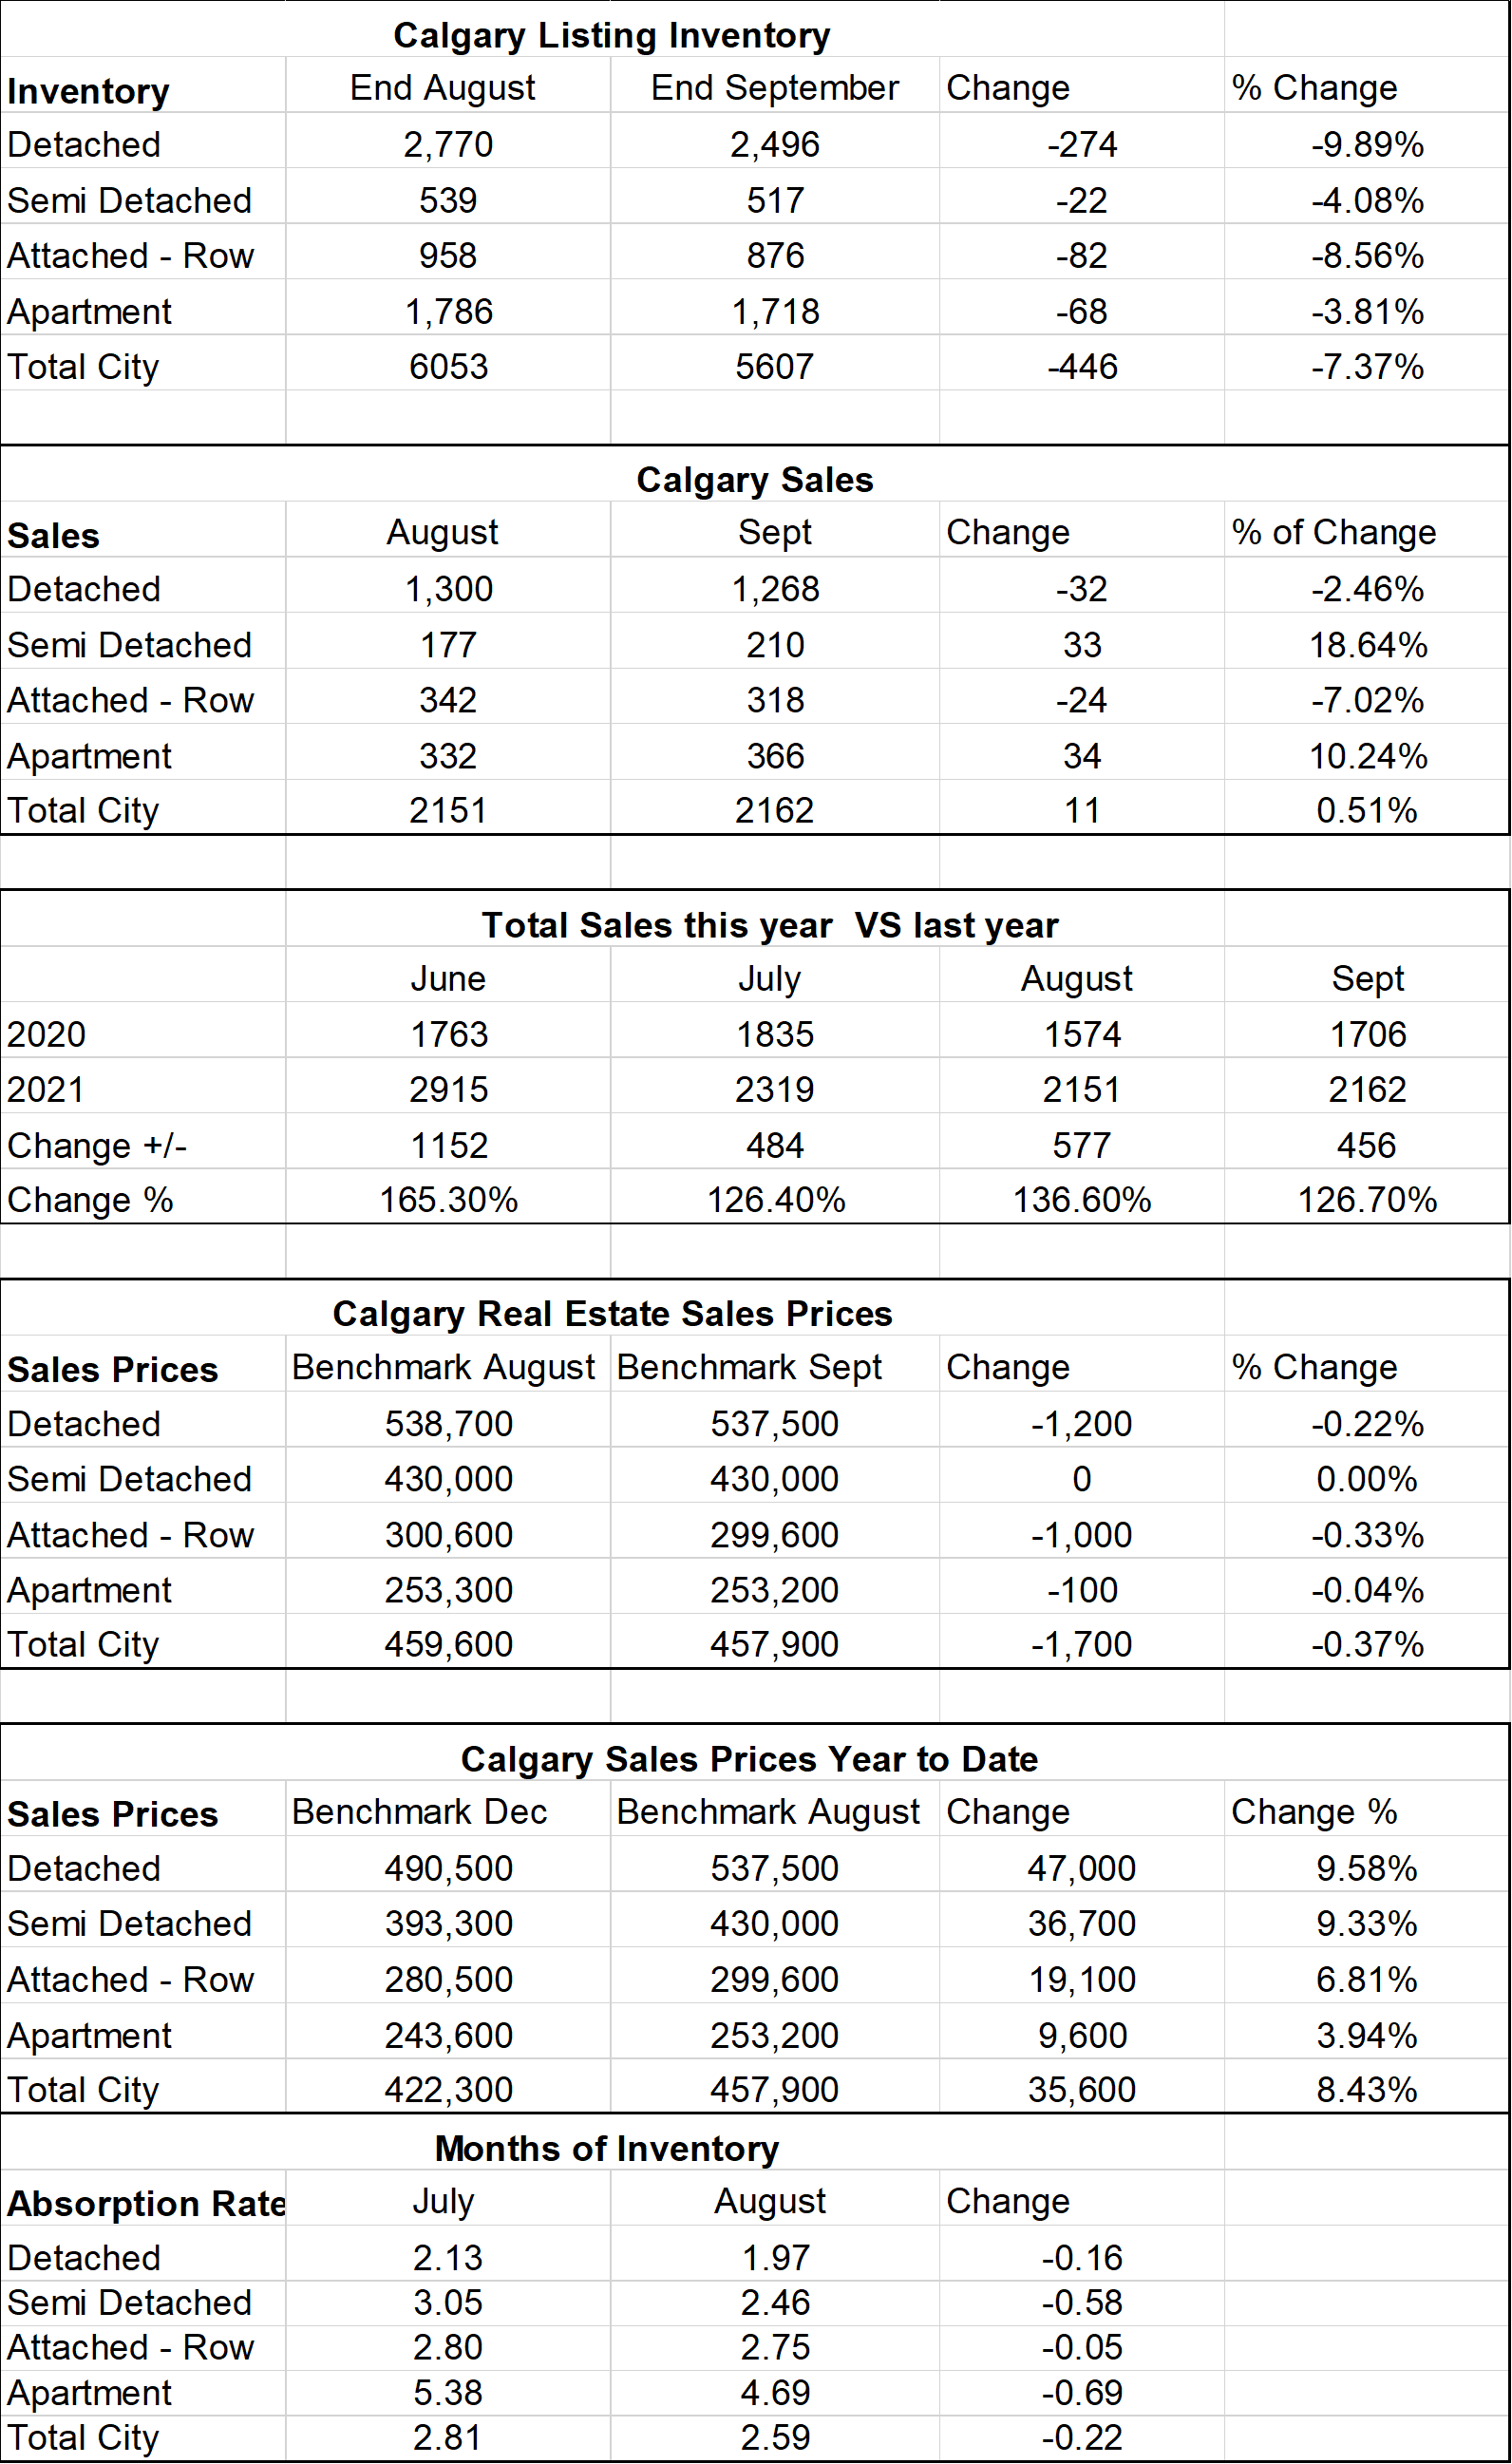
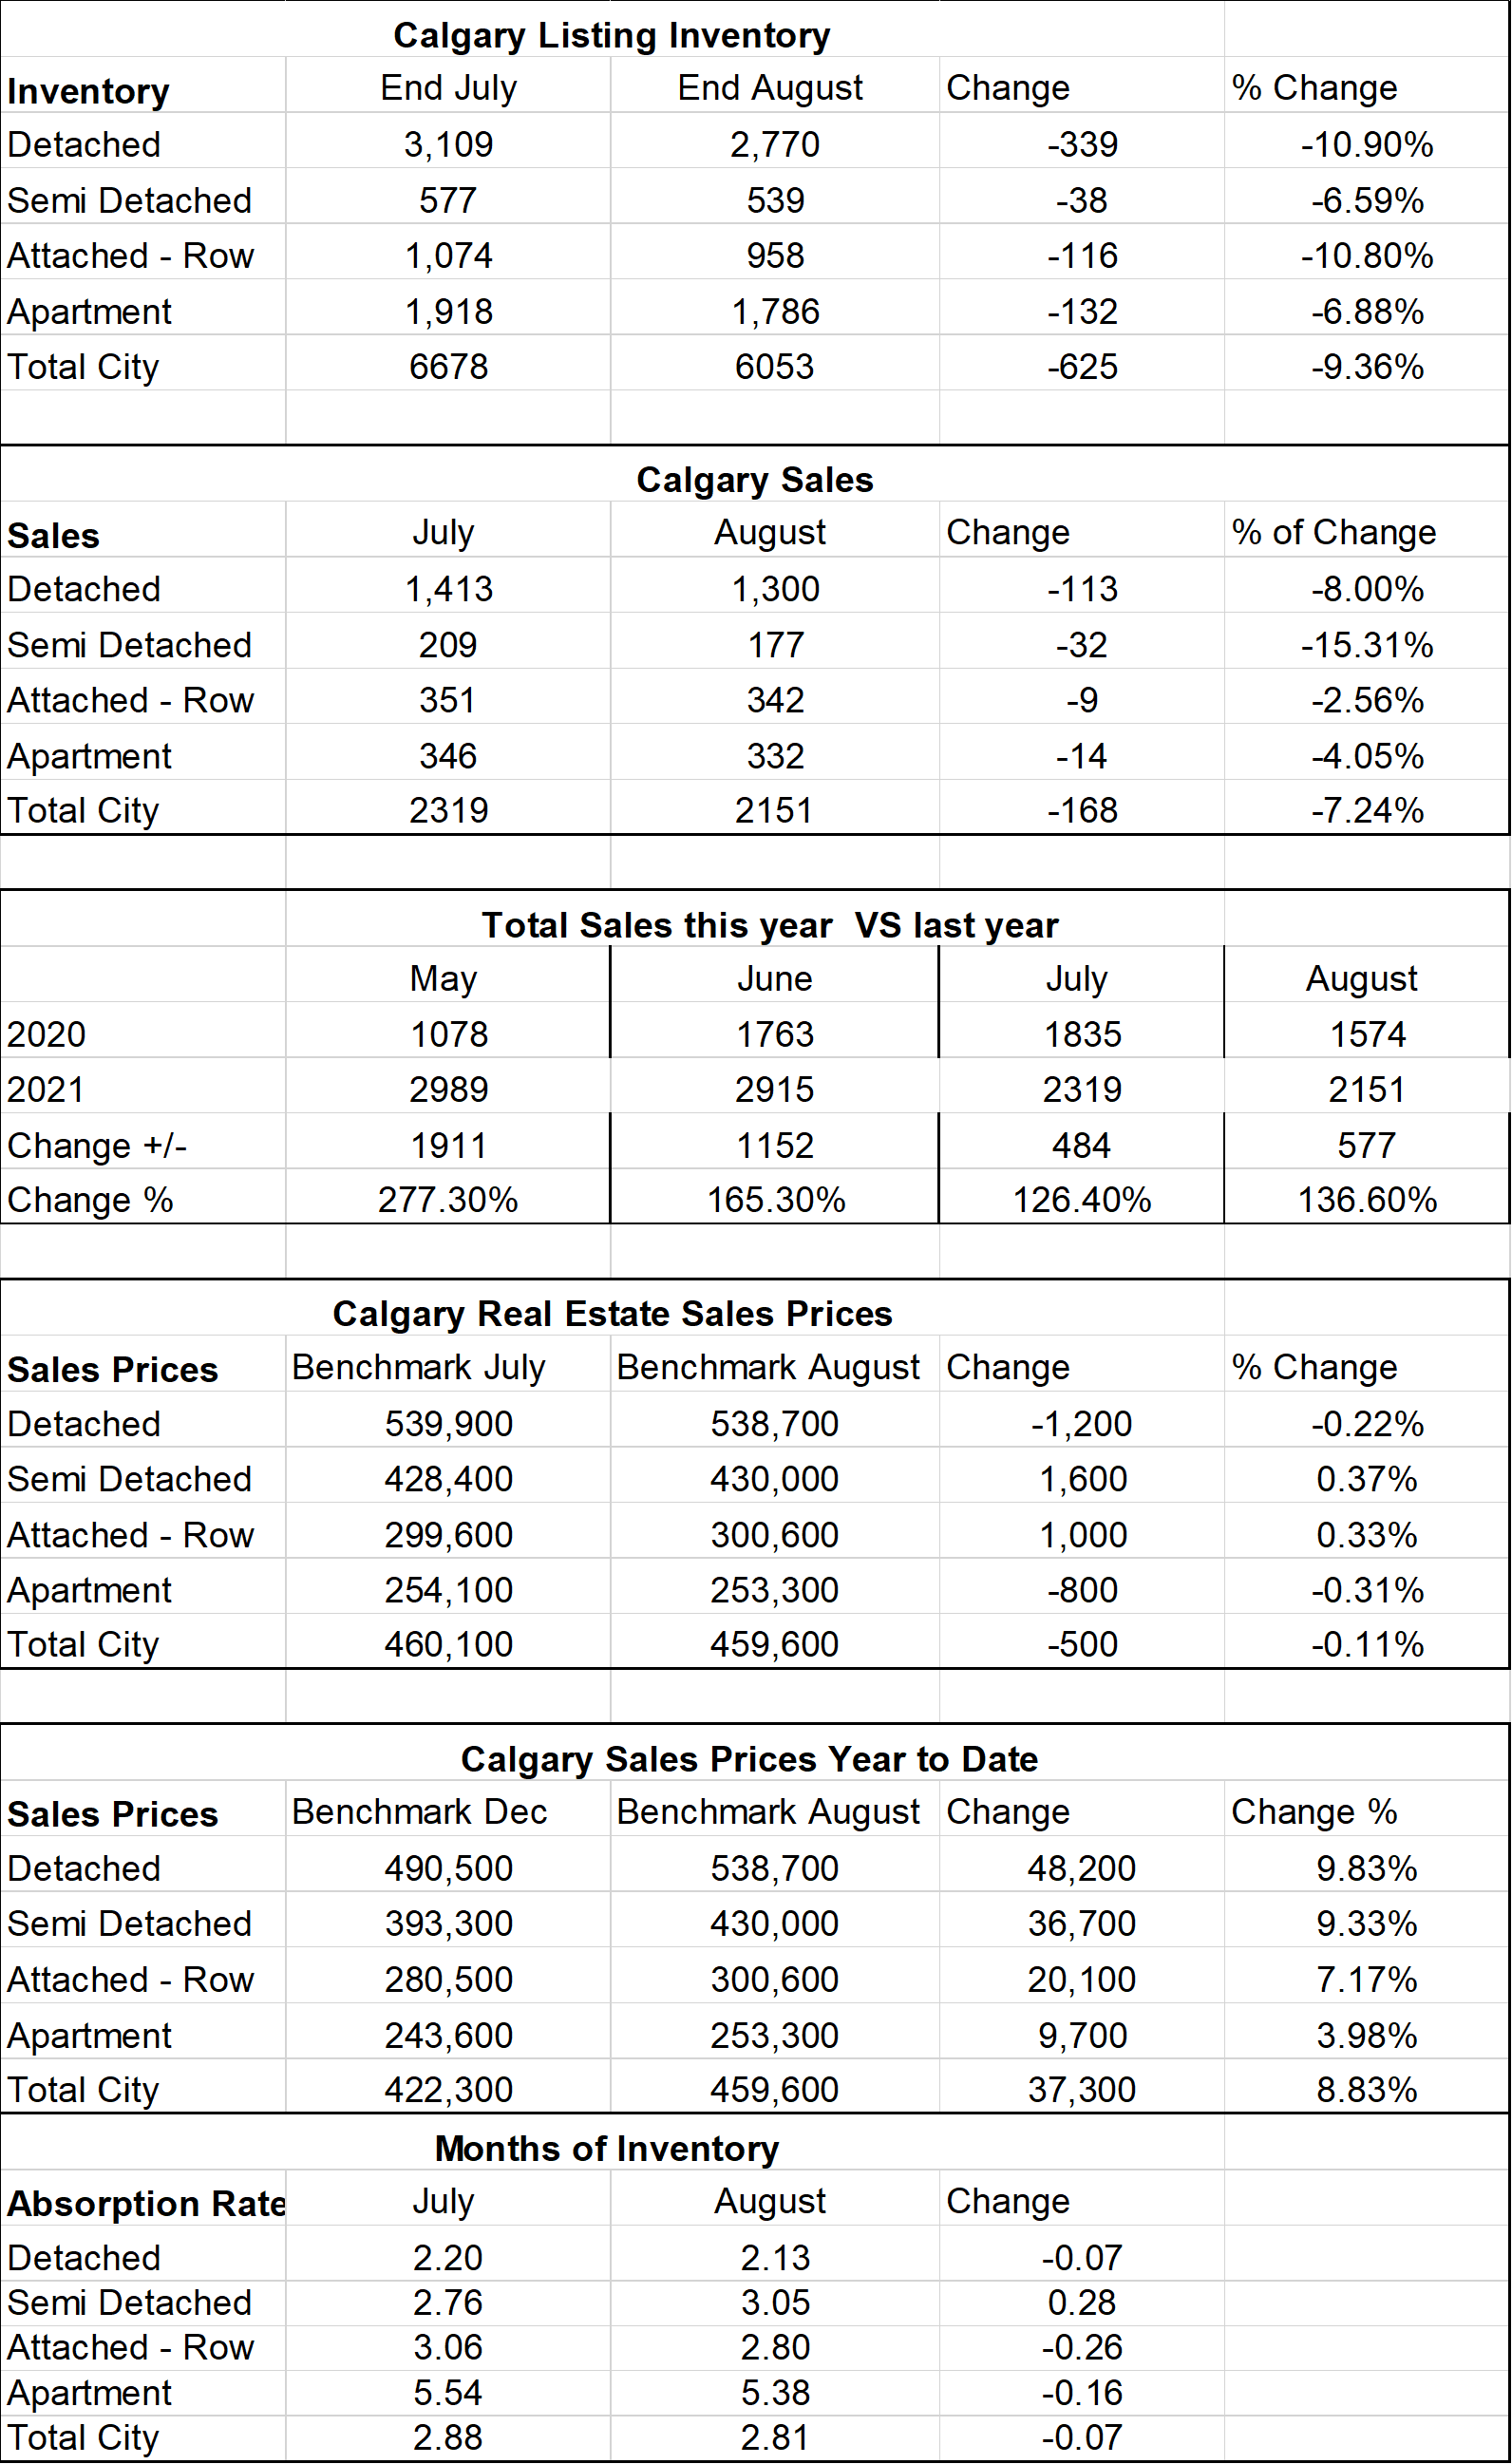
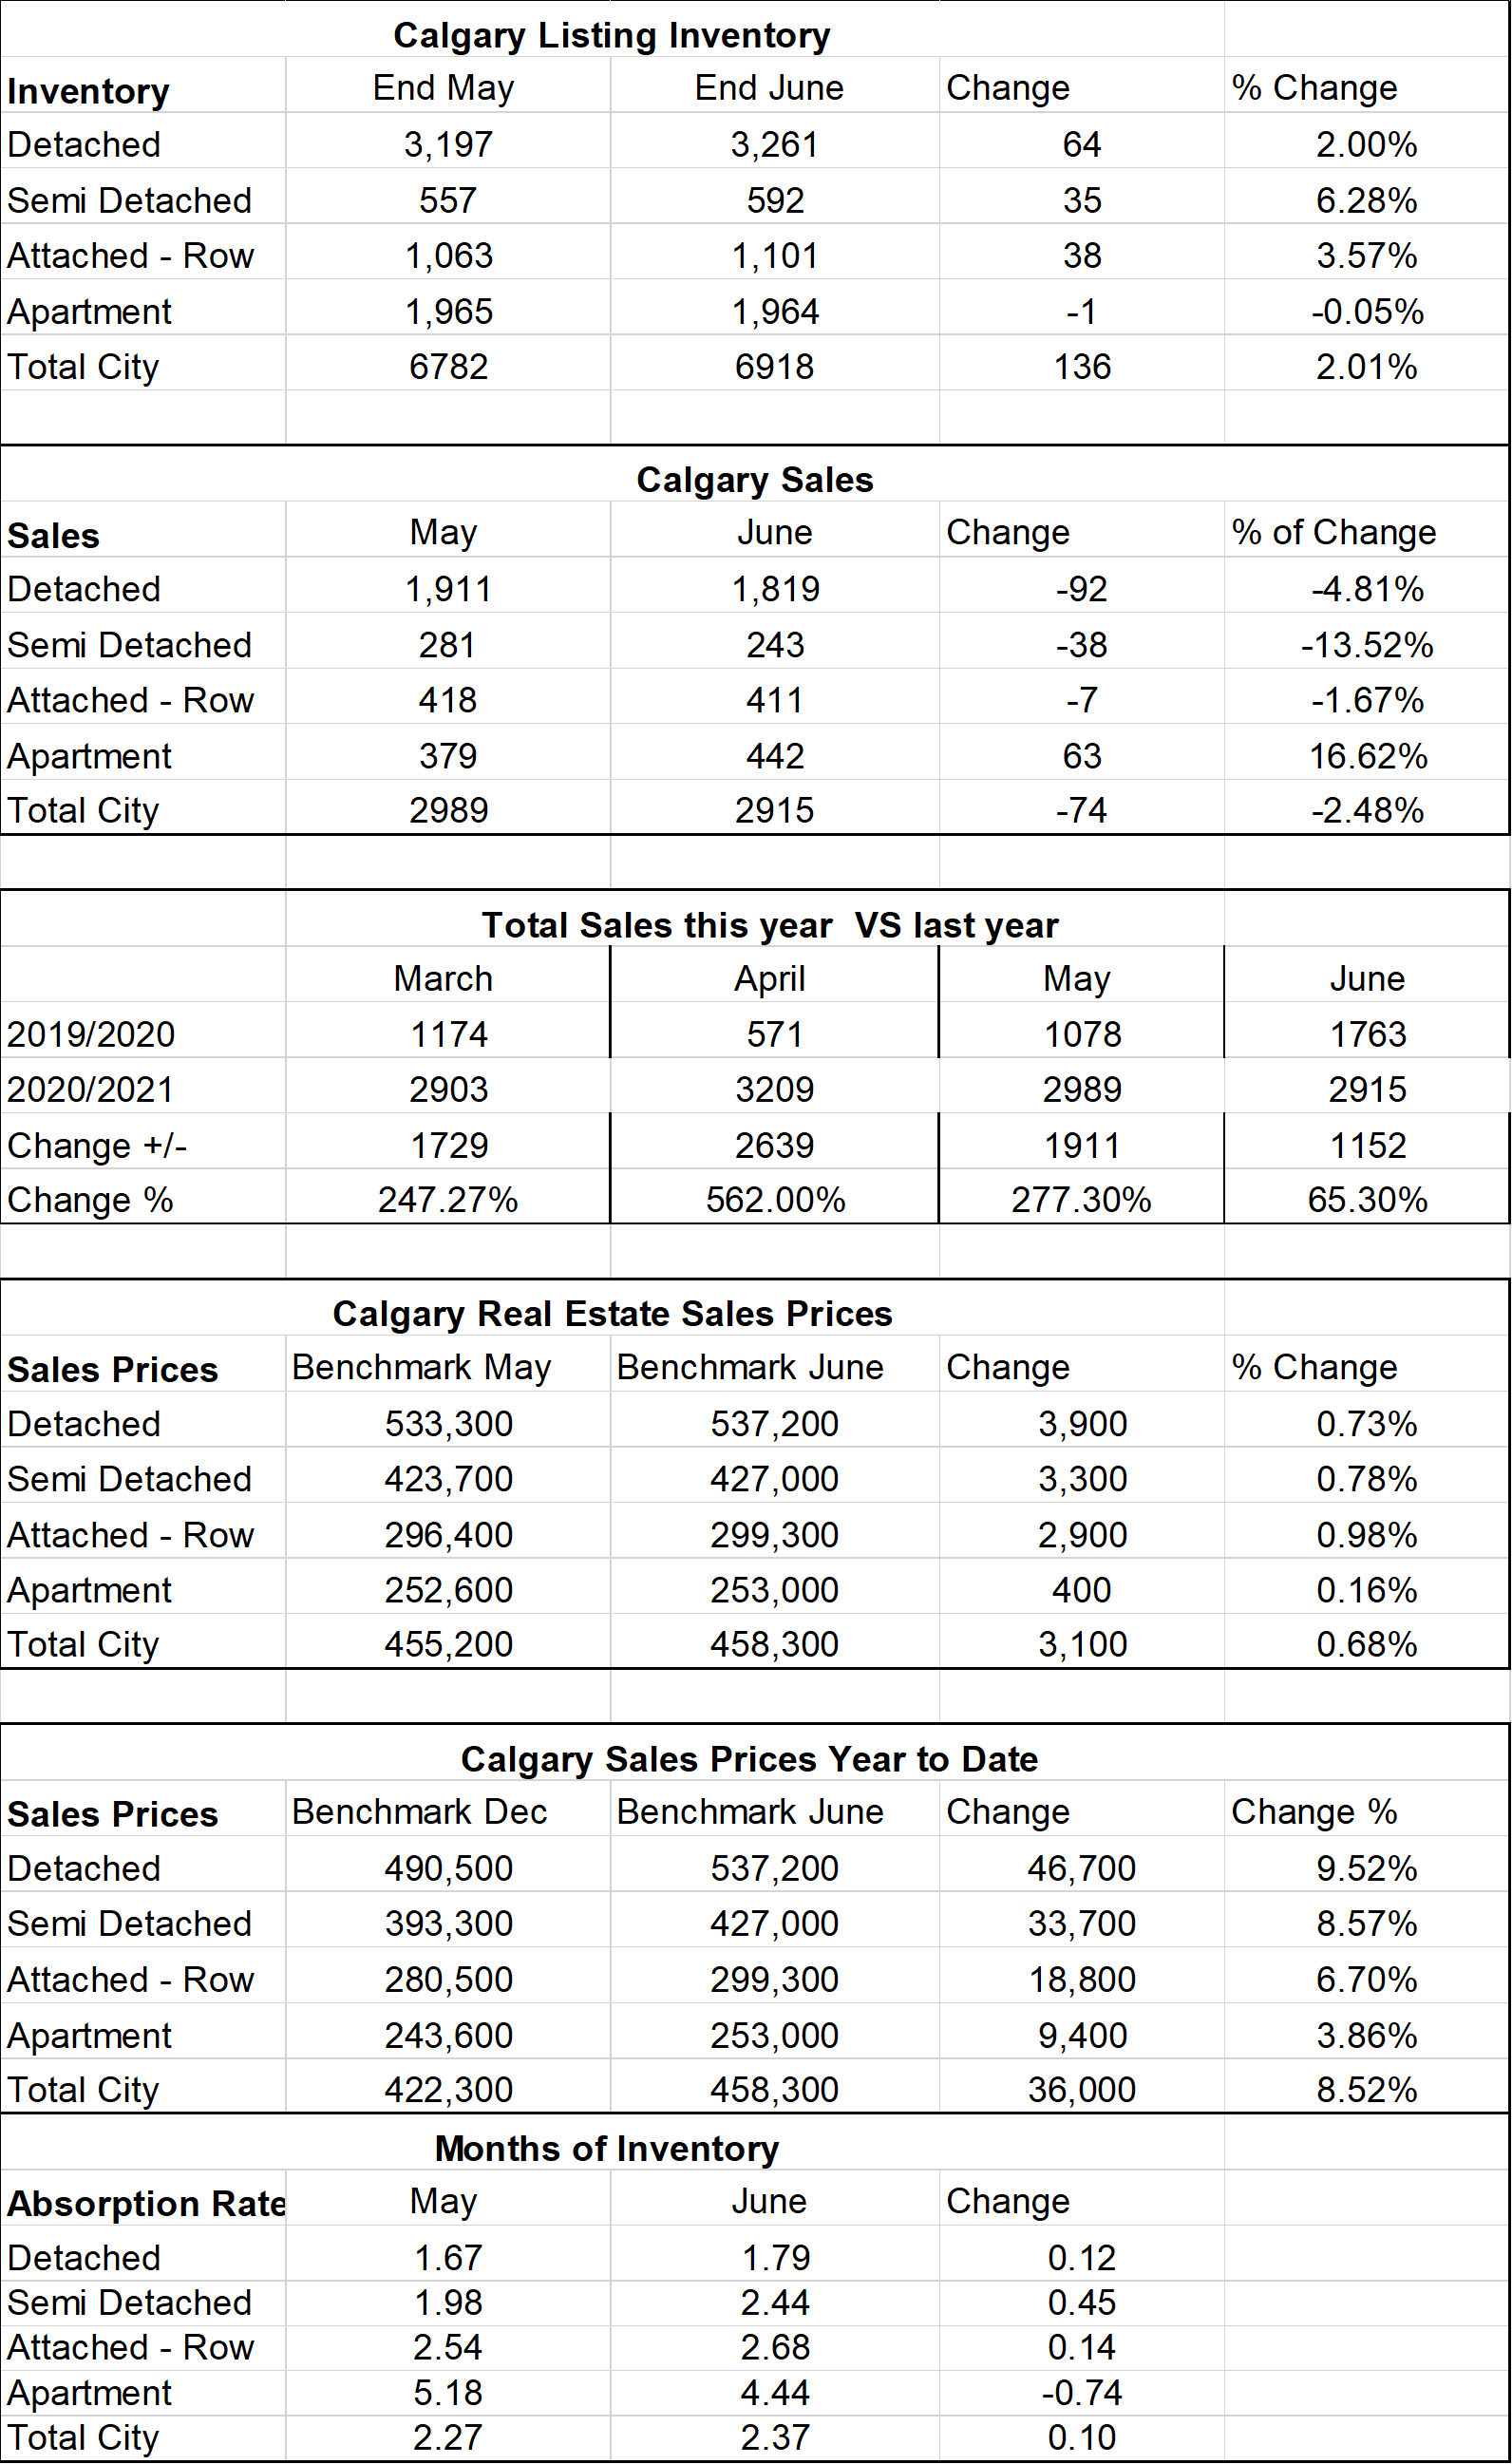
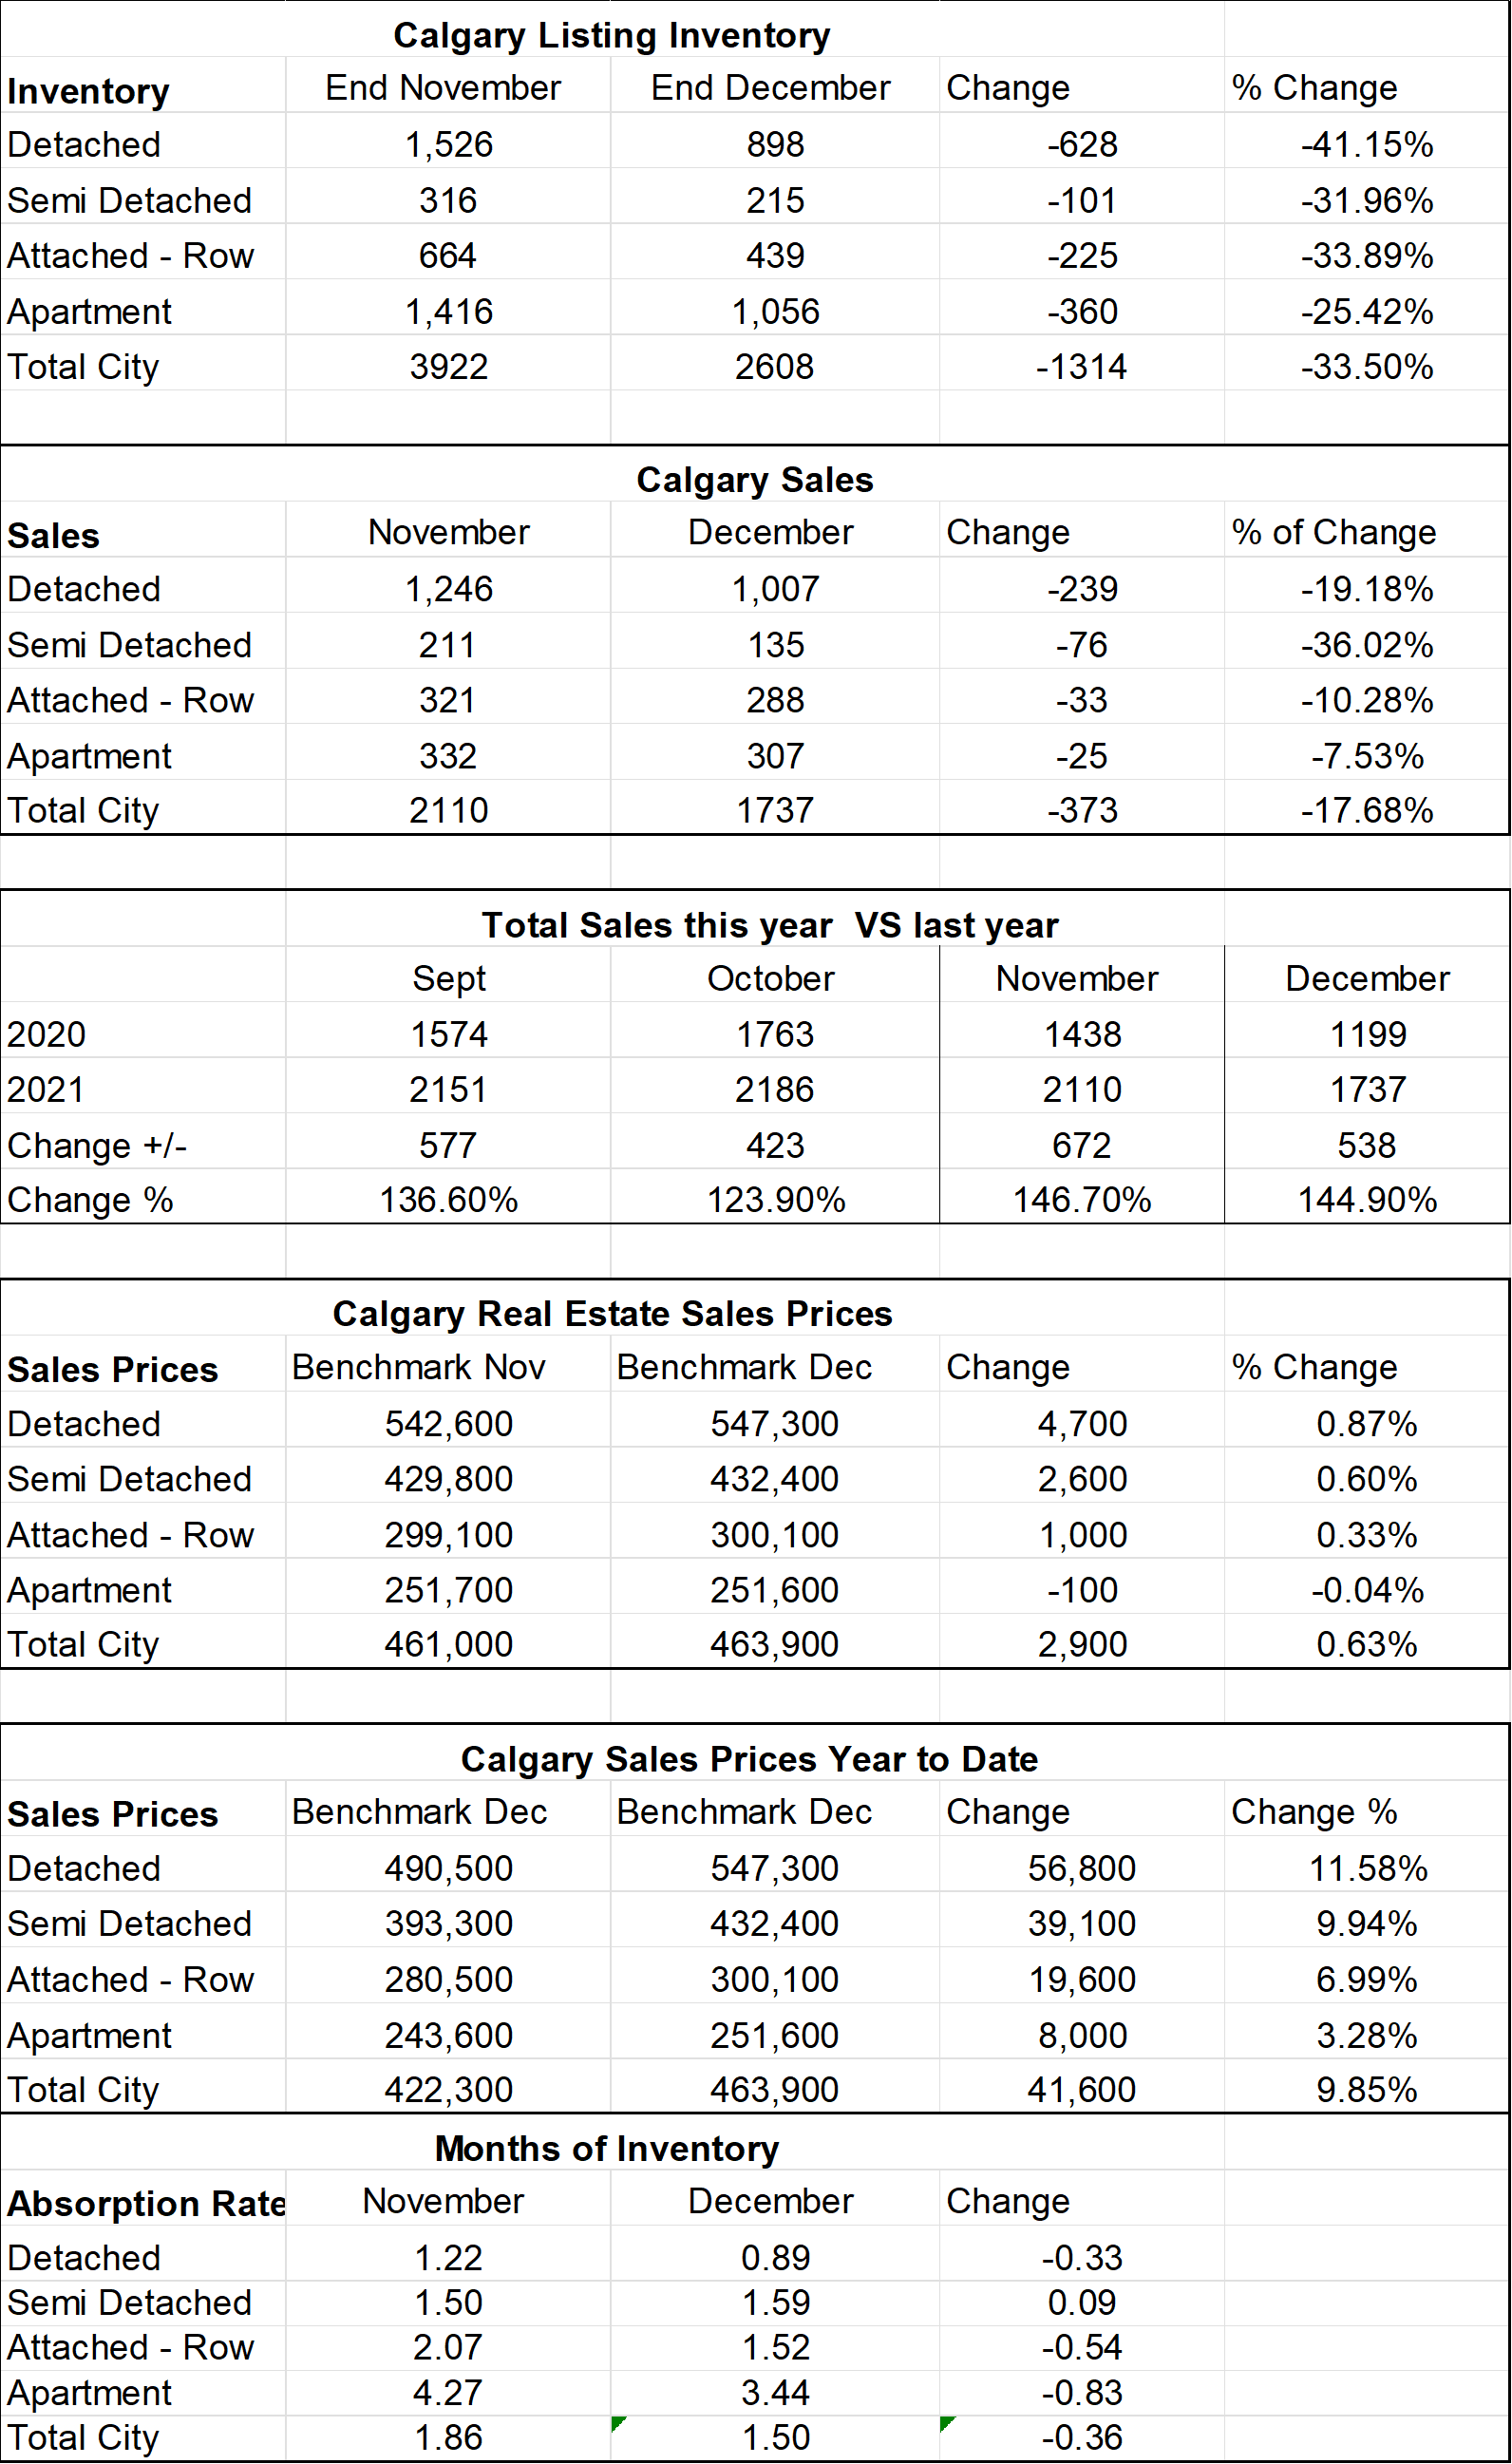
Calgary Listing Inventory
Listing inventory declined in all sectors during December which is normal for the season. What is not normal is how low our inventory is – Specifically in the Detached home sector. Our detached home inventory is at 898 listings compared to 1566 at the end of December last year. All other sectors are within one hundred listings of where we were last year.
Calgary Sales:
Sales in all categories declined in December. This is a normal trend where things wind down over the holiday season. In my opinion, our sales declined mostly due to a lack of inventory in the detached home market – If we had more listing there would have been more sales.
Sales Compared to 2020:
Calgary home sales were 72% higher than last year, (Keep in mind 2020 had a couple of slow months due to Covid.
The real story is that Calgary was 44% higher in sales than the 10-year average.
| Jan | Feb | Mar | Apr | May | June | July | |
| 2020 | 861 | 1190 | 1175 | 573 | 1080 | 1763 | 1835 |
| 2021 | 1208 | 1836 | 2903 | 3209 | 2989 | 2915 | 2319 |
| Change | +347 | +646 | +1729 | +2639 | 1,911 | 1,152 | +484 |
| % Change | +7.49 | +54.4 | 247% | +562% | 277.3% | 165.3% | 126.4% |
| Aug | Sept | Oct | Nov | Dec | Year to Date | |
| 2020 | 1574 | 1702 | 1763 | 1438 | 1199 | 16,149 |
| 2021 | 2151 | 2162 | 2186 | 2110 | 1737 | 27,686 |
| Change | +577 | +456 | + 423 | +672 | +538 | 11,537 |
| % Change | 136.6% | 126.7% | 123.9% | 146.7% | 144.9% | 171.4% |
Calgary Real Estate Benchmark Sales Prices:
Overall, the benchmark price increased for the Detached, Semi-Detached and Attached Row Sectors while the Apartment Condo sectors saw a small decline of $100 this month. (See chart below).
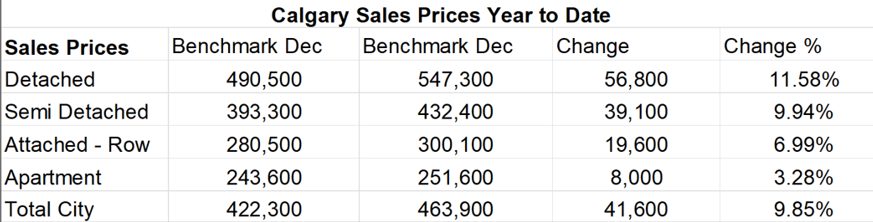
Calgary Real Estate Benchmark Year to Date Sales Price: See chart below.
Year to date every sector has seen an increase in the Benchmark price. Overall, we are at a 9.85% higher than at the end of 2020. Here are the Dec End Benchmark prices along with the increase and the % Increase for 2021.
2022 Price Increases
Current Months of Inventory (Absorption Rate):
The Months of inventory decreased in all sectors this month. As of today, here is where we sit:
Sellers Market: Detached, Semi-Detached, and Attached- Rowhomes
Balanced Market: Apartment Condos
Overall, we are in a Seller’s Market.
What might 2022 bring: (again just my opinion)
We are very unbalanced in the detached home sector that I believe sales in this sector will decline slightly from last year only due to a lack of listings on the market. Detached homes will continue to be in Multiple offers and the prices will continue to increase. As the prices increase in the detached sector it will push some buyers into the Semi-detached and Attached Row sectors. If this continues for the better part of the year it may also push buyers into the Apartment Condo Sector.
It is also important to note that these numbers vary by community, and by price range. If you would like numbers for your community, or more specific numbers for your home please contact us.
Below is a summary of numbers in chart form. All numbers are taken from the Calgary Real Estate Boards monthly Stats package.
Stats from the Calgary Real Estate Board