Archive for the ‘Education’ Category

Calgary Real Estate Market Snapshot – Aug 1, 2018

Thursday, August 2nd, 2018

What is really happening in the Calgary Real Estate Market?

What is really happening in the Calgary Real Estate Market?

Stay ahead of everyone else by following our Monthly Market Snapshot of the Calgary Real Estate Market. This shows what’s really happening! The market is driven by supply and demand so here we show the inventory (supply) and sales (demand) and most importantly the relationship between the two and how it affects the price of Calgary Real Estate.  A simple way to keep up to date with how the market is trending and to stay ahead of most! All numbers are taken from the Calgary Real Estate Boards Stats package for Realtors. I have also included some general comments which are simply my opinion.

Months of Inventory/Absorption Rate – the inventory divided by the number of sales in the last month). What does this mean you might ask?

Buyer’s Market >4.0 Drives prices down
Balanced Market Between 2.4 to 4.0 Prices typically remain stable
Seller’s Market <2.4 Drives prices up


Watch the Trend

On the above graph it is important to see the trends – As you can see the apartment condo absorption rate is has been trending down however in July it reversed and when back up.

 Current Months of Inventory:  If we did not list any more homes this is how many months it would take to deplete inventory.

In July the months of inventory increased in every Category.  If you have been following my monthly snapshot you will notice that most months when this changes it changes only a little where this month the numbers have increased substantially. This change puts us deep into a Buyer’s market in every category.


End of June 2018    July 2018    Change
Detached 3.98 4.72 0.74
Semi Detached 5.04 6.07 1.04
Attached – Row 5.73 6.78 1.05
Apartment 6.41 7.01 0.60
Total City 4.65 5.46 0.81


Calgary Listing Inventory

In July, our inventory decreased increased in all sectors and overall. This is totally normal at this time of year and we should expect this trend to continue for the rest of the year.


Inventory June 2018    July 2018    Change
 Detached 4817 4578 -239
Semi Detached 922 911 -11
Attached – Row 1209 1187 -22
Apartment 1872 1774 -98
Total Calgary 8820 8450 -370

Calgary Sales:

Sales were down in all categories and again this is normal for July as this is moving out of our busy season when people are focused on vacations and outdoor activities.

Sales Compared to last year: Of interest if we compare to last year Sales in June we were 11.3% down from last year while July we were down only 4.8% from last year – a big improvement.


Calgary Sales  June 2018    July 2018    Change % Change
Detached 1210 969 -241 -19.92%
Semi Detached 183 150 -33 -18.03%
Attached – Row 211 175 -36 -17.06%
Apartment 292 253 -39 -13.36%
Total City 1896 1547 -349 -18.41%


Calgary Real Estate Sales Prices:

As we are now in a buyer market we should expect prices to decline slightly which is what happened except in the Apartment Condo sector where prices increased slightly.


  Sales Prices June 2018   Benchmark Price   July 2018   Benchmark Price Change
Detached 503,100 501,300 -1,800
Semi Detached 418,000 416,200 -1,800
Attached – Row 302,300 300,300 -2,000
Apartment 259,100 259,700 600
Total City 436,500 435,200 -1,300


Sales Prices “Year to Date”  

Same as monthly number

Sales Prices Jan 1, 2018    Benchmark Price  July 2018   Benchmark Price Change

$

% Change
Detached 499,600 501,300 1,700 0.34%
Semi Detached 416,600 416,200 -400 -0.10%
Attached – Row 299,500 300,300 800 0.27%
Apartment 257,700 259,700 2,000 0.78%
Total City 433,200 435,200 2,000 0.46%


**Please note that these numbers include only Calgary homes and do change on a community basis and more so for towns.  This report does not include rural properties.  If you would like to find stats on your community just let me know.  If you have any questions about this summary or about Real Estate in general, please feel free to contact us.
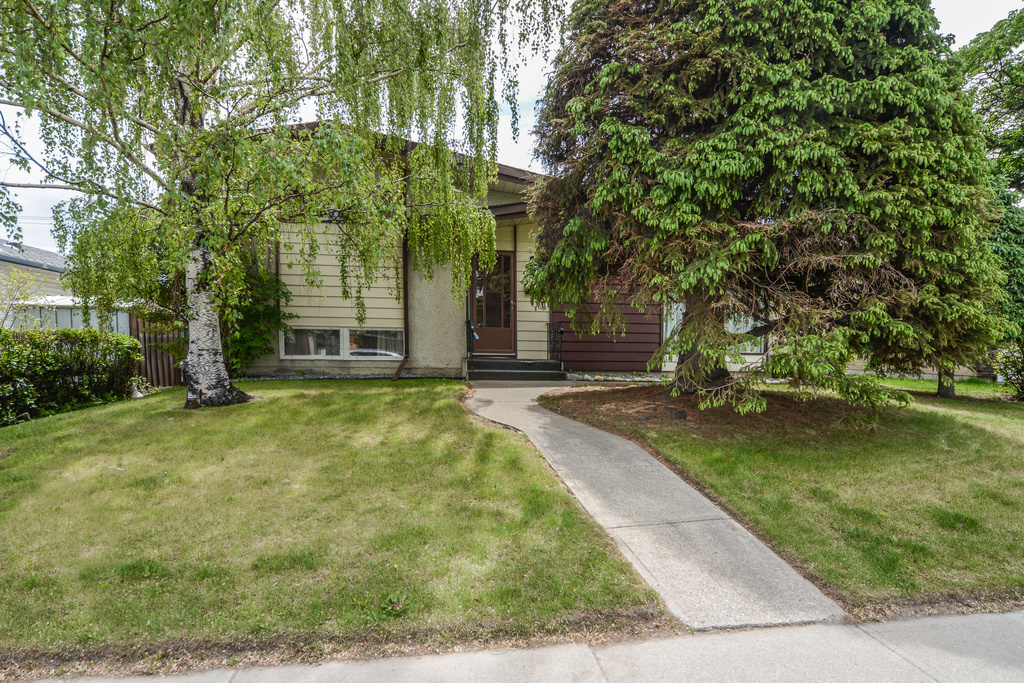


Just Listed 119 78 Avenue NE Calgary

Thursday, June 7th, 2018

Excellent opportunity to gain some sweat equity, flip a home or have a rental.

C4189464 : 4 Level Split in Huntington Hills for only $350,000

Open House Saturday June 9, 2018 from 2pm to 5pm

Open House Sunday June 10 from 1 pm to 4 pm

Looking for a renovation project, look no more. Fantastic 4 Bedroom, 4 level Split in a great location in Huntington Hills. This home provides good bones but is just dated and provides a great opportunity to get into Huntington Hillls at a great price point. Living room features vaulted ceilings, kitchen is spacious, updated and offers a large dining area. Upper level provides 2 spacious bedrooms and a full bath. Third level provides another 2 bedrooms and full bath.  Forth level is developed with a Rec room with awesome stone fireplace, and the utility room. Enjoy your large backyard and your oversized (23×25) double garage. All this and located close to public transit, schools, shopping nearby and easy access to Deerfoot trail. Shingles replaced aprox 2003. Some windows have been replaced.

Calgary Real Estate Market -June 1, 2018

Saturday, June 2nd, 2018

What is really happening in the Calgary Real Estate Market? 

What is really happening in the Calgary Real estate Market

What is really happening in the Calgary Real estate Market

What is really happening in the Calgary Real Estate Market?

Stay ahead of everyone else by following our Monthly Market Snapshot of the Calgary Real Estate Market. This shows what’s really happening! The market is driven by supply and demand so here we show the inventory (supply) and sales (demand) and most importantly the relationship between the two and how it affects the price of Calgary Real Estate.  A simple way to keep up to date with how the market is trending and to stay ahead of most! All numbers are taken from the Calgary Real Estate Boards Stats package for Realtors. I have also included some general comments which are simply my opinion.

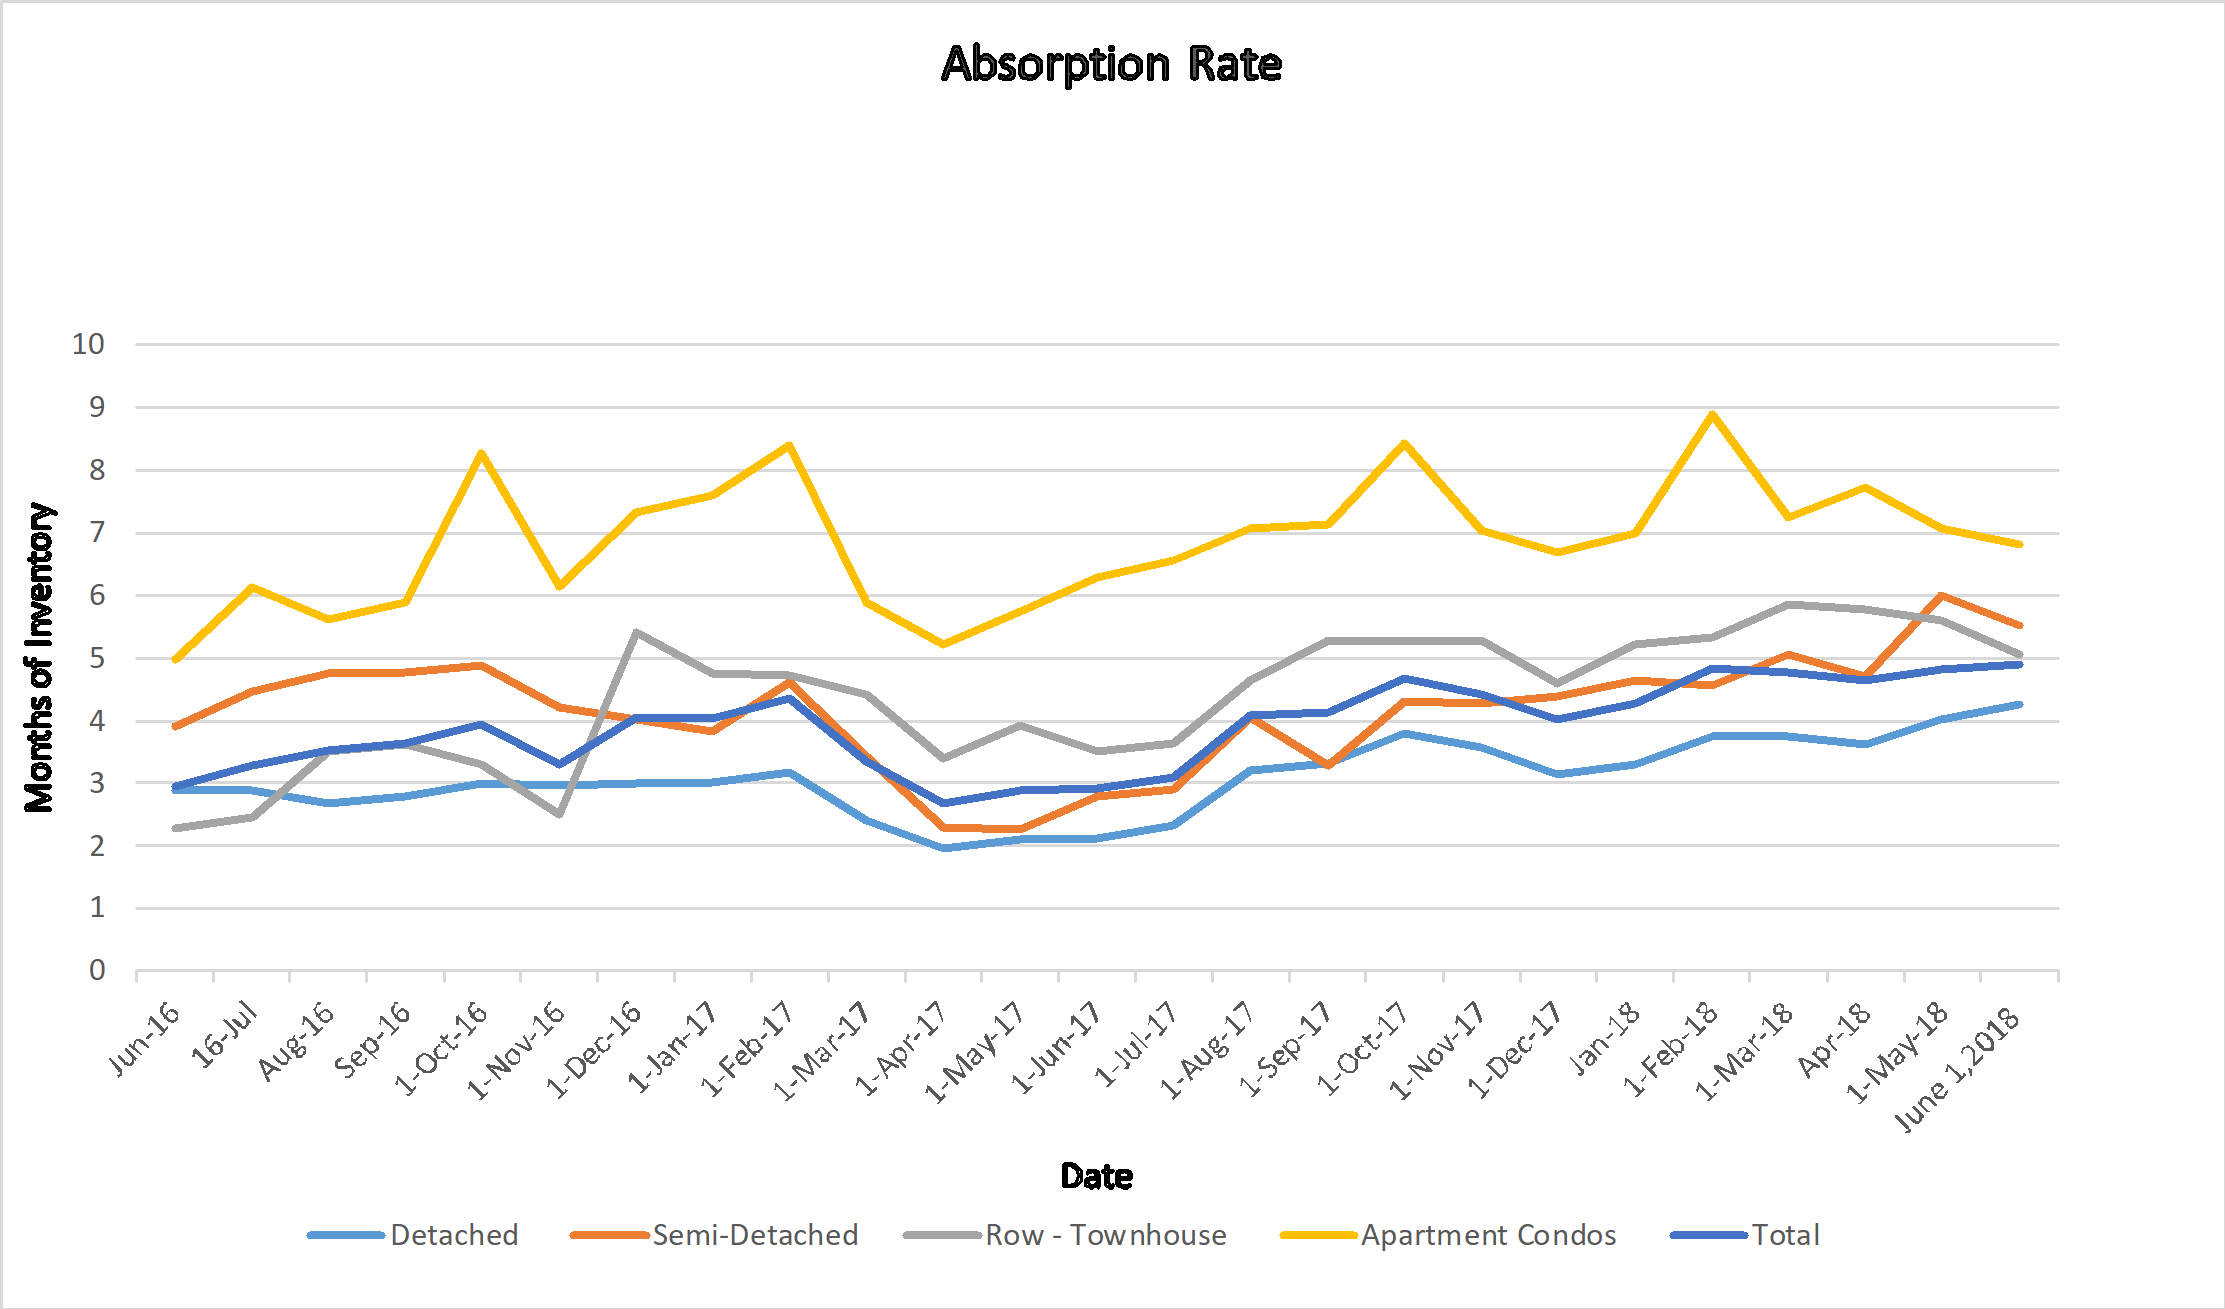
Absorption Rate (Months of Inventory) – the inventory divided by the number of sales in the last month). What does this mean you might ask?

Buyer’s Market >4.0 Drives prices down
Balanced Market Between 2.4 to 4.0 Prices typically remain stable
Seller’s Market <2.4 Drives prices up


Current Absorption Rate

No major fluctuations here this month.  Detached homes went up a little while all other categories went down between .25 and .54

End of Apr 2018    May 2018    Change
Detached 4.01 4.26 0.25
Semi Detached 6.00 5.53 -0.47
Attached – Row 5.60 5.06 -0.54
Apartment 7.06 6.81 -0.25
Total City 4.82 4.90 0.07


 Calgary Listing Inventory

In April, our inventory increased in all Sectors. This is totally expected at this time of year and we should expect this trend to continue for another month anyways.

Inventory Apr 2018    May 2018    Change
Detached 3642 4504 862
Semi Detached 756 862 106
Attached – Row 1075 1163 88
Apartment 1851 1921 70
Total City 7324 8450 1126


Calgary Sales:

The good news is that sales are up from last month in all categories.  Looking at the bigger picture we are still substantially down from last year’s  sales.  May showed 18.4% less sales than May 2017.   This however is an improvement as April sales were down 20.3% from last April.

Calgary Sales  Apr 2018    May 2018    Change % Change
Detached 908 1058 150 16.52%
Semi Detached 126 156 30 23.81%
Attached – Row 192 230 38 19.79%
Apartment 262 282 20 7.63%
Total City 1518 1726 208 13.70%


Calgary Real Estate Sales Prices:

Prices in April showed very little change.  Attached-Row houses showed the largest gain of $3,200. while Semi-Detached homes showed the largest decrease of $1,000.

  Sales Prices Apr 2018   Benchmark Price   May 2018   Benchmark Price Change
Detached 504,500 504,500 0
Semi Detached 420,000 419,000 -1,000
Attached – Row 300,000 303,200 3,200
Apartment 256,700 256,200 -500
Total City 436,500 436,900 400


Sales Prices “Year to Date”  

Same as monthly number

Sales Prices Jan 1, 2018    Benchmark Price  May 2018   Benchmark Price Change

$

% Change
Detached 499,600 504,500 4,900 0.98%
Semi Detached 416,600 419,000 2,400 0.58%
Attached – Row 299,500 303,200 3,700 1.24%
Apartment 257,700 256,200 -1,500 -0.58%
Total City 433,200 436,900 3,700 0.85%


**Please note that these numbers include only Calgary homes and do change on a community basis and more so for towns.  This report does not include rural properties.  If you would like to find stats on your community just let me know.  If you have any questions about this summary or about Real Estate in general, please feel free to contact us.
Should You Buy the Latest Home Automation Gadgets?

Tuesday, December 19th, 2017

You’re at work when the thought hits you, “Did I lock the door when I left this morning?”

You check your smartphone, see that you didn’t, and click the “LOCK” button. Now your house is secure. That’s home automation for you! But, is home automation a good idea?

That depends on a number of factors. On the pro side, home automation can improve your quality of life. There are automation products that will adjust heating/cooling depending on whether or not you’re home, make your morning coffee when you get out of bed, and the list goes on and on. These conveniences save you time. Home automation can also give you peace-of-mind. It’s comforting to be able to remotely see the inside of your home and check that everything’s okay.

Home automation can also make your property more appealing to buyers. Traditionally, buyers like homes with security systems, and will appreciate other automation gizmos, too. The only downside is the cost. Like most new technology, home automation products can be pricey and may become out-of-date within just a few years.

Thinking about it? Experts advise you to do your research first. Check out product reviews online. Then, if you determine that a particular product is going to benefit you, go for it!


Radon Gas Awareness

Tuesday, December 19th, 2017

What Is Radon Gas? 

Radon is an invisible, odourless, and tasteless radioactive gas  found naturally in soil and rock from the breakdown of uranium.   Radon gas may be inside your home and can be a health risk to you and your family.  Long term exposure can lead to lung cancer making it the leading cause of lung cancer among non-smokers.

Why is this important to me? 

In a recent study done by the University of Calgary researchers found that radioactive radon gas exceeds safe levels in one in eight Calgary Homes.   The study found that homes built in the past 25 years had a 31.5% higher average Radon Levels as they are built with tighter seals and have less ventilation than older homes.

How do I know if my home has high levels of Radon gas? 

The only way to know for sure is to have your home tested.  You can buy the test kits anywhere from home depot to The Lung Association.  The Kit from the Lung Association is only $34.99 +$11.95 shipping and includes the kit, instructions and Lab testing fees.  Order your kit here Lung Association

What if my home has high levels of Radon Gas? 

This is the easy part,  home venting to migate high levels of radon usually costs between $2000 to $2500.

If you would like to learn more about Radon Gas here is a great article from the Calgary Herald


Calgary Real Estate Market Snapshot – Dec. 1, 2017

Saturday, December 2nd, 2017

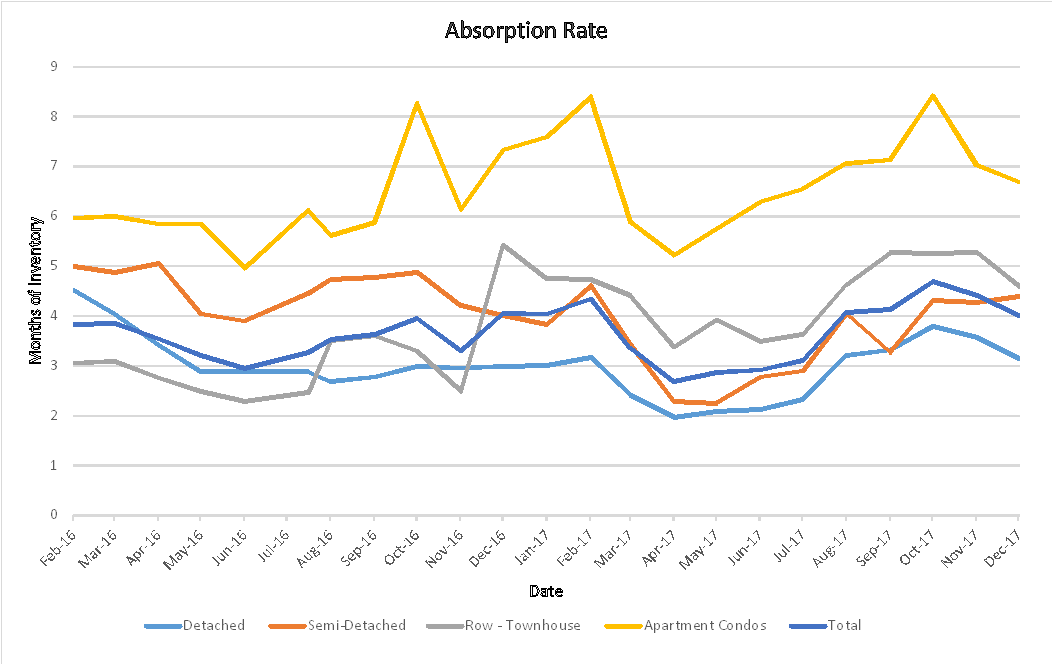
Absorption Rate Dec. 2017

What is really happening in the Calgary Real Estate Market?

Stay ahead of everyone else by following our Monthly Market Snapshot of the Calgary Real Estate Market This shows what’s really happening! The market is driven by supply and demand so here we show the inventory (supply) and sales (demand) and most importantly the relationship between the two and how it affects the price of Calgary Real Estate.  A simple way to keep up to date with how the market is trending and to stay ahead of most! All numbers are taken from the Calgary Real Estate Boards Stats package for Realtors. I have also included some general comments which are simply my opinion.

What is Absorption Rate (Months of Inventory)   (the inventory divided by the number of sales in the last month). What does this mean you might ask?

Buyer’s Market >4.0 Drives prices down
Balanced Market Between 2.4 to 4.0 Prices typically remain stable
Seller’s Market <2.4 Drives prices up

Current Absorption Rate

The Absorption rate for November decreased in all categories except Semi – Detached which rose a little.  In my opinion this is mainly due to listings expiring and not due to sales.  Either way this is good as it is keeping the market fairly balanced. 

Oct  2017  Nov  2017  Change
Detached 3.57 3.15 -0.42
Semi Detached 4.27 4.40 0.13
Attached – Row 5.28 4.60 -0.68
Apartment 7.03 6.69 -0.35
Total City 4.41 4.01 -0.39


Calgary Listing Inventory

In November all categories saw a decrease in the number of listings.  This is normal for this time of year where people will let their listing expire and then put it back on in the new year.

Inventory Oct  2017  Nov  2017  Change
Detached 3246 2758 -488
Semi Detached 611 555 -56
Attached – Row 967 861 -106
Apartment 1639 1491 -148
Total City 6463 5665 -798


Calgary Sales:

Sales for November saw a small decrease overall.  Attached Row homes are the only category to show an increase.  Semi-Detached saw a rather large decrease and it’s my belief that this is simply listings expiring that will be relisted in January.

Of interest Calgary year to date sales are 15% above last year’s sales.

Calgary Sales  Oct  2017  Nov  2017  Change % Change
Detached 908 875 -33 -3.63%
Semi Detached 143 126 -17 -11.89%
Attached – Row 183 187 4 2.19%
Apartment 233 223 -10 -4.29%
Total City 1467 1411 -56 -3.82%


Calgary Real Estate Sales Prices:

Prices for November showed a slight decrease in Calgary.  This in my opinion is mainly due to consumer confidence or lack of it.

  Sales Prices Oct  2017  Benchmark Price   Nov  2017  Benchmark Price Change
Detached 506,200 504,000 -2,200
Semi Detached 419,000 417,800 -1,200
Attached – Row 305,000 303,100 -1,900
Apartment 261,600 258,300 -3,300
Total City 438,900 436,700 -2,200


Sales Prices “Year to Date”  

Sales Prices Jan 1, 2017    Benchmark Price  Nov  2017  Benchmark Price Change

$

% Change
Detached 498,700 504,000 5,300 1.06%
Semi Detached 406,800 417,800 11,000 2.70%
Attached – Row 302,600 303,100 500 0.17%
Apartment 265,000 258,300 -6,700 -2.53%
Total City 433,400 436,700 3,300 0.76%

 **Please note that these numbers include only Calgary homes and do change on a community basis and more so for towns.  This report does not include rural properties.  If you would like to find stats on your community just let me know.

Housing Market Outlook, Fall of 2017 Produced by Canadian Mortgage and Housing Corp (CMHC)

Friday, October 27th, 2017

Every quarter CMHC provides a housing outlook report.  In the report you will find

  • New home market
  •  Resale Market
  • Rental Market
  • Economic Trends

The report show stats from the past and future predictions, In my opinion it is a great report.

To see full report click here

Tips to Winterize your home

Tuesday, October 3rd, 2017

To ensure your home is ready for the winter follow our tips to winterize. Most items you can do yourself but some will require a professional.

  1.  Hose bibs:  Turn off the water to all exterior hose bibs to prevent freezing.  Once water is off open the tap slightly to let water drain.   If you are in a newer home you will likely have a valve inside to drain all the water from the pipes.
  2. Irrigation systems:  If you have an irrigation system it is imperative that you have the lines blown out to remove all moisture from the lines. This again will prevent freezing of the pipes and ensures your system works next year.
  3.  Clean or replace your furnace filter.  Dirty filters make your furnace work harder and reduce its efficiency.
  4.  Have your heating system professionally inspected.  Atco gas will come out and check your system (I believe at no charge).
  5. If you have not done so recently have someone in to clean your vents.  This will reduce dust and give you better quality air inside your home.
  6. Clean your gutters and eavestroughs.  Clean eaves allow for proper flow of water so it does not just run over the gutters and land near your foundation.
  7. Do an  inspection of your windows and doors, are there any cracks or gaps that you can fill to reduce the amount of air that comes in cooling your home.
  8. *** Ensure the grade of your lot is sloping away from your foundation.  Grading towards the home is the number 1 cause of water seeping into basement.
  9. If you have a fireplace, get your Chimney professionally cleaned.  A dirty chimney is a fire hazard.


3 Reasons to Talk to a Realtor Today

Sunday, October 1st, 2017

You might naturally assume that it is most important to talk to a Realtor when you’re selling or buying a home. But there are many other circumstances in which it makes sense to give me a call. Here are a few examples.

1. When you’re at the “thinking about it” stage.  If you’re just thinking about selling your home, and haven’t made a firm decision yet, you might feel uncomfortable calling a Realtor. Don’t be. It’s better to gather the facts to assist you in your decision making,  I welcome your call.  We can discuss what your current property will likely sell for in today’s market, and determine the type of home you qualify to buy. That way, you’ll have some clarity and be able to make a more informed decision.

2. If you’re nervous about the selling process.   If you haven’t sold a home before, you might be concerned about what’s involved in the process. You might even worry that putting your home on the market is going to be a lot of work and create a lot of turbulence for you and your family. Fortunately, selling your home doesn’t need to be scary. In fact, a big part of my job as a Realtor is to make the process as smooth and trouble-free as possible. So if you have concerns about selling your home, you should give me a call.

3. If you have questions You likely have questions about the local real estate scene from time to time. You might have questions like: “How much did that home around the corner sell for?  How is the Market?  Is a condo or a house a better investment.  How much does it cost to build a house in Calgary? There are many types of questions and we will do our best to get you the answers you need.

Contact us


Does Your Home Insurance Cover Everything?

Friday, July 14th, 2017

When you suffer damage to, (or the loss of), your home or its contents, you expect your insurance company to help you out. And, most do a good job of doing just that.  Still, it’s a good idea to review your policy with your insurance advisor and find out what’s covered and what isn’t. You don’t want to discover that your policy will not cover the cost of repairing the damage caused by a flood in your laundry room.  Pay particular attention to coverage in the case of water damage.  Some insurance policies don’t cover floods and sewer backup unless an additional rider is purchased.  Also, check liability limits.  Ask your advisor to recommend an appropriate level.  Finally, make sure you know exactly how much your home is insured for.  Are you covered for the full replacement cost?  Are you comfortable with that coverage or the actual cash value?  Having the right insurance gives you peace-of-mind and is an important part of enjoying your home. Keep in mind that experts advise you to review your insurance with your advisor.  Ask lots of questions.  Make sure you understand your coverage fully.  By the way, if you’re looking for an insurance advisor, I’m well-connected in the local “home” industry and  I may be able to give you a couple of names of good, reputable professionals. Give me a call.