What is really happening in the Calgary Real Estate Market?
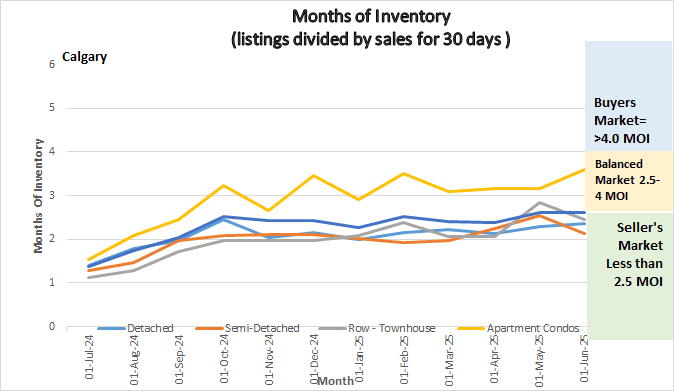
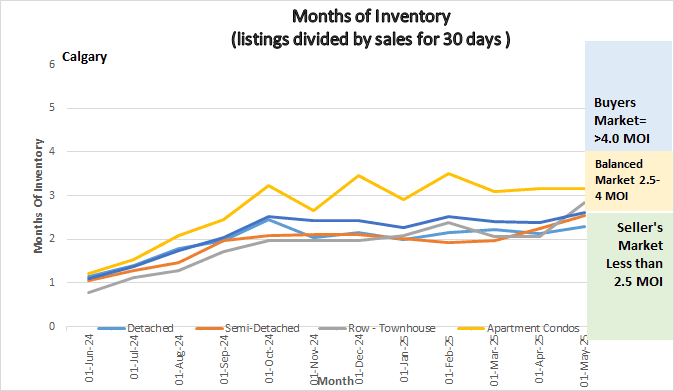
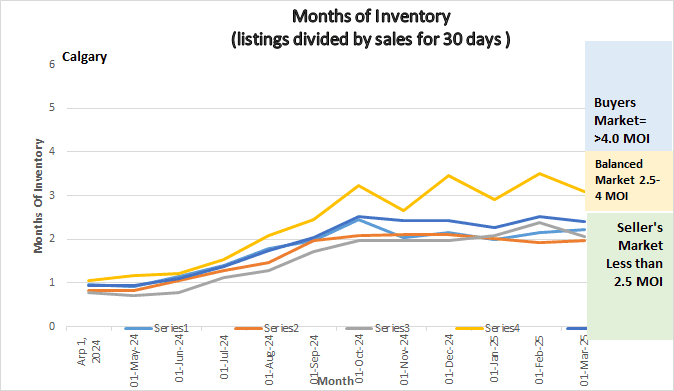
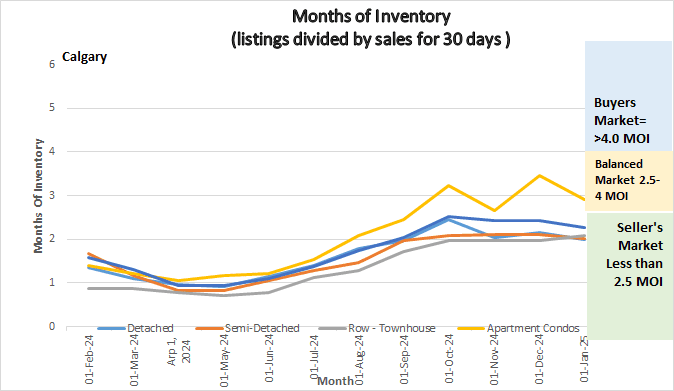
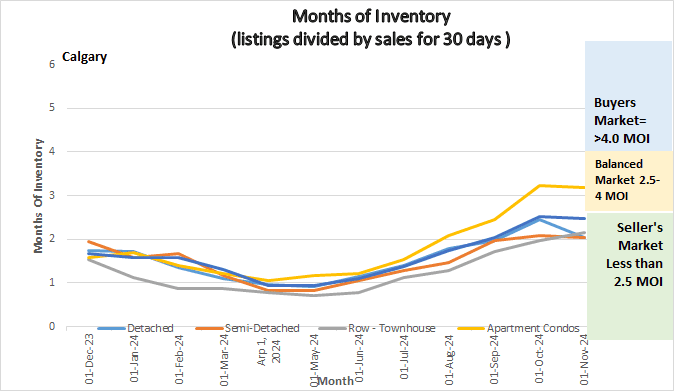
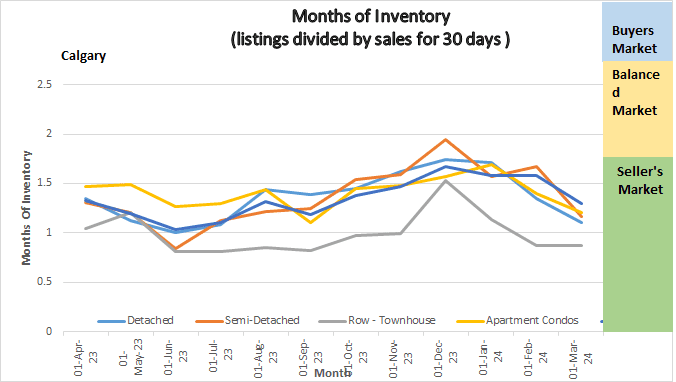
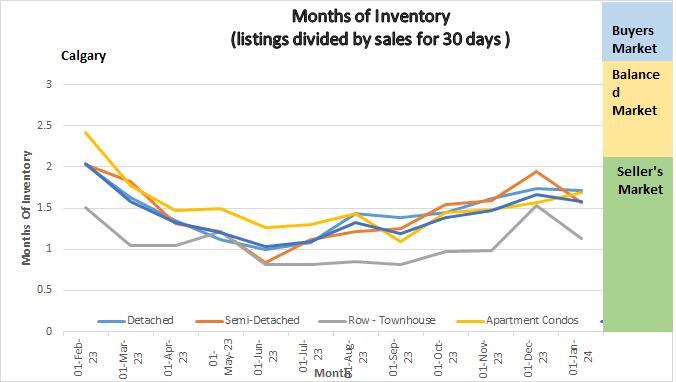
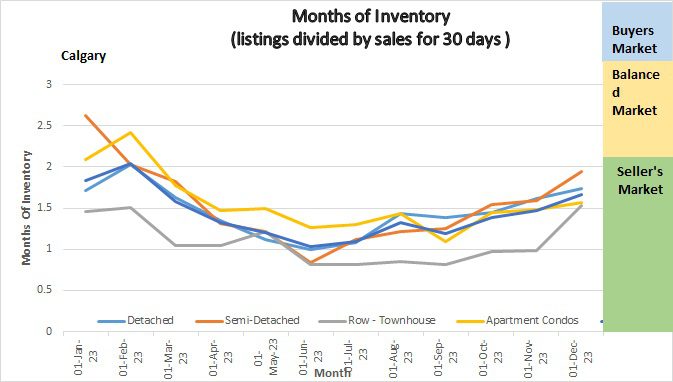
The following graph shows the months of inventory for each housing sector. Looking at a one-year trendline gives you an indication of where things are really heading.
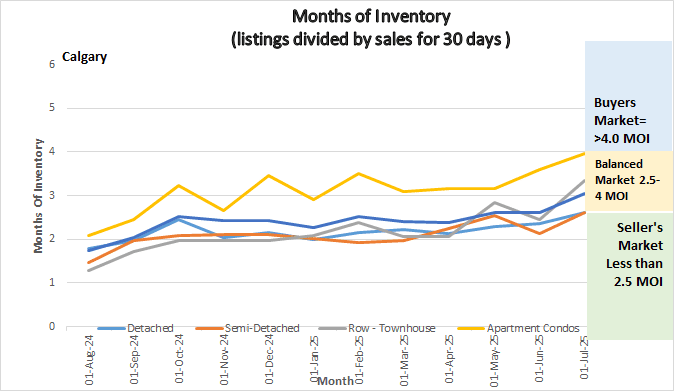
Graph showing Months of Inventory for Calgary Real Estate Market
Gord’s commentary for the month (just my opinion).
July 1, 2025, Highlights
- Months of Inventory continues to creep upwards
- Prices in all sectors decreased slightly (Highest sector was detached homes at <$5100>
- Apartment Condos almost hit Buyers Market territory
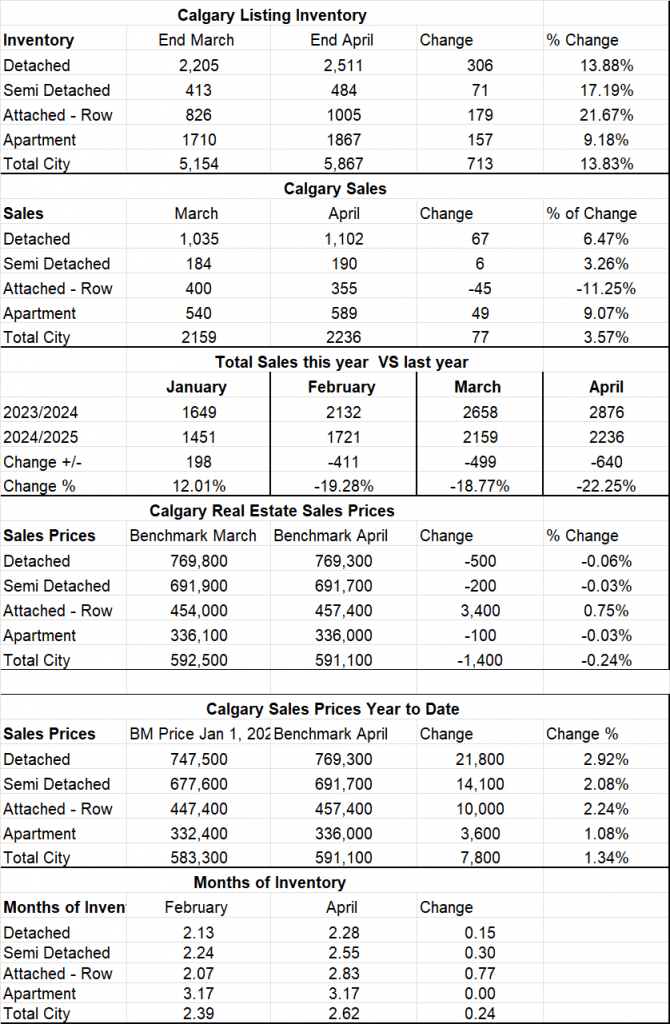
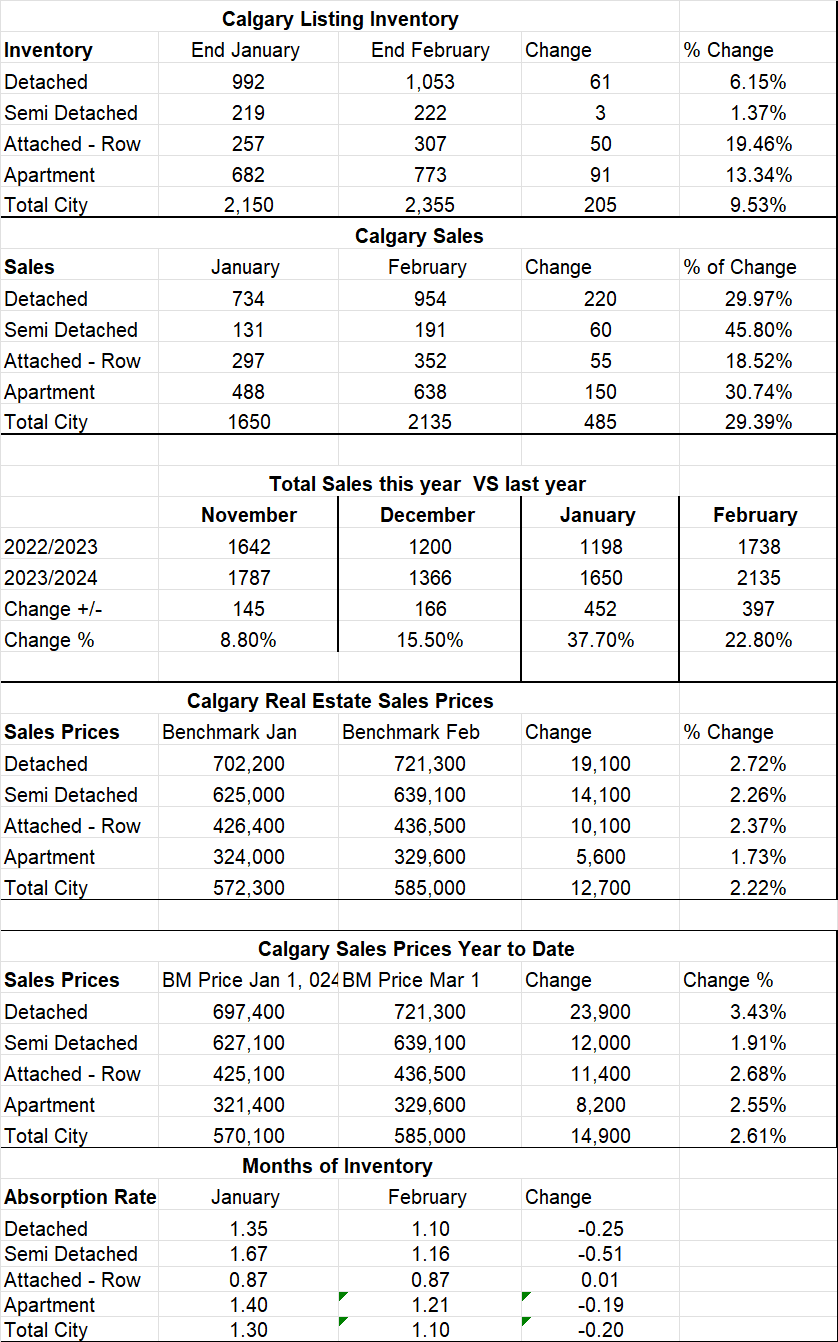
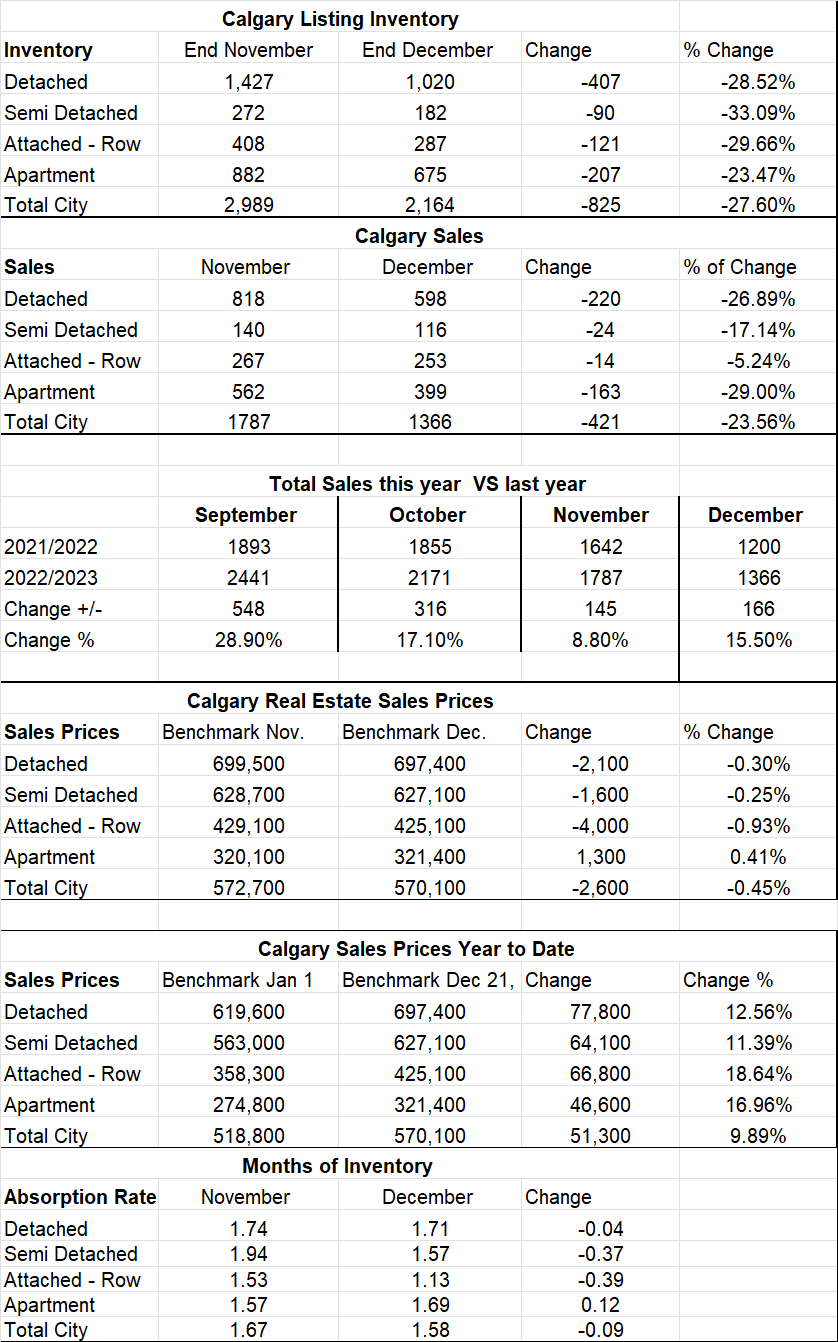
Calgary Listing Inventory
Our Inventory showed an increase of 201 listings or 2.98% which is a very small increase.
Calgary Sales: Sales in June were 10.98% lower than sales in May. This is not typical as June typically records our highest sales. This reinforces that the market continues to slow. The highest decrease is in the Attached Row sector at <24.02%) which is not surprising as this sector has been outperforming for the last year and a half.
Sales Compared to 2024:
Compared to June of 2024 our sales were down 451 or 16.5%. While this drop seems significant, the 2737 last year was when the market was booming.
| Dec | Jan | Feb | March | April | May | |
| 2024 | 1362 | 1649 | 2132 | 2658 | 2876 | 2737 |
| 2025 | 1322 | 1451 | 1721 | 2159 | 2236 | 2286 |
| Change | 40 | 198 | -411 | -499 | -640 | -451 |
| % Change | -3.0% | 12.1 | -19.28 | -18.88 | -22.25% | -16.50 |
Calgary Real Estate Benchmark Sales Prices:
The overall Benchmark price for June was $586,200 a slight decrease of $3,700 from the end of May. All sectors saw marginal decreases.
Current Months of Inventory (Absorption Rate):
As the listing Inventory increased and the number of sales decreased this put our months of inventory into an increasing position. The good news is the overall months of inventory increased by .5 which is much higher than previous months. Attached row homes saw the largest increase of .92 while Apartment condos saw the smallest increase of .33 Of note here is the Apartment condo sector hit 3.97 Months of inventory and 4 and above, I consider to be in a buyer’s market.
My Prediction for what is ahead:
I believe that over the next 6 months you will see a continued slowing of the market – certainly not a market crash but the Market just trying to balance itself out and find the new norm. Having said this, I also believe there are a ton of people sitting on the fence and if and when the Canadian economy shows positivity including making a deal with the US then our market will likely explode again.
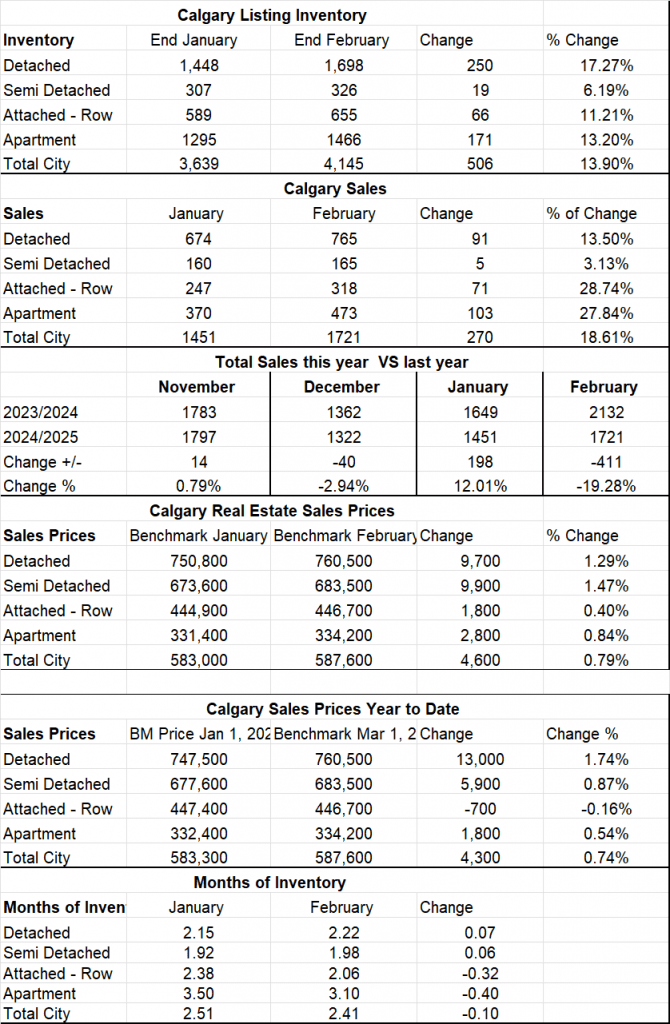
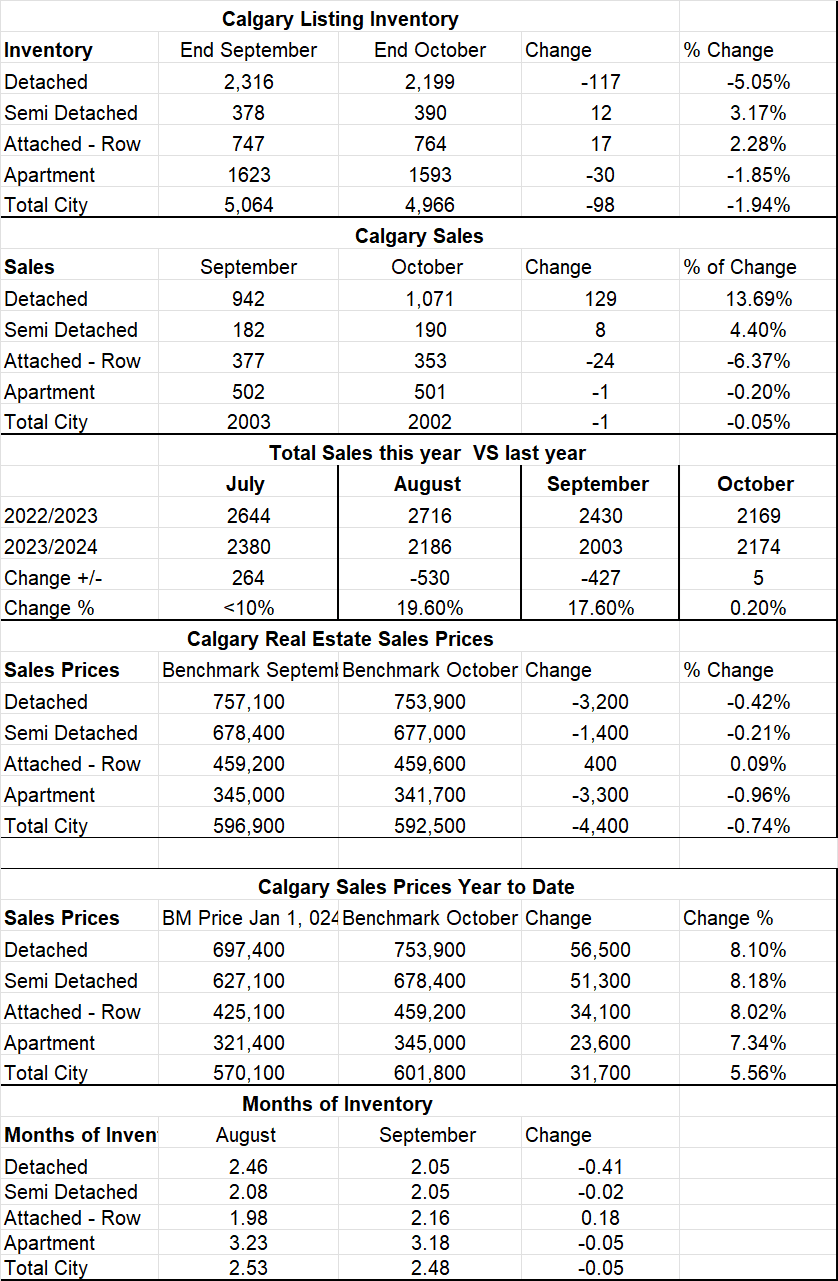
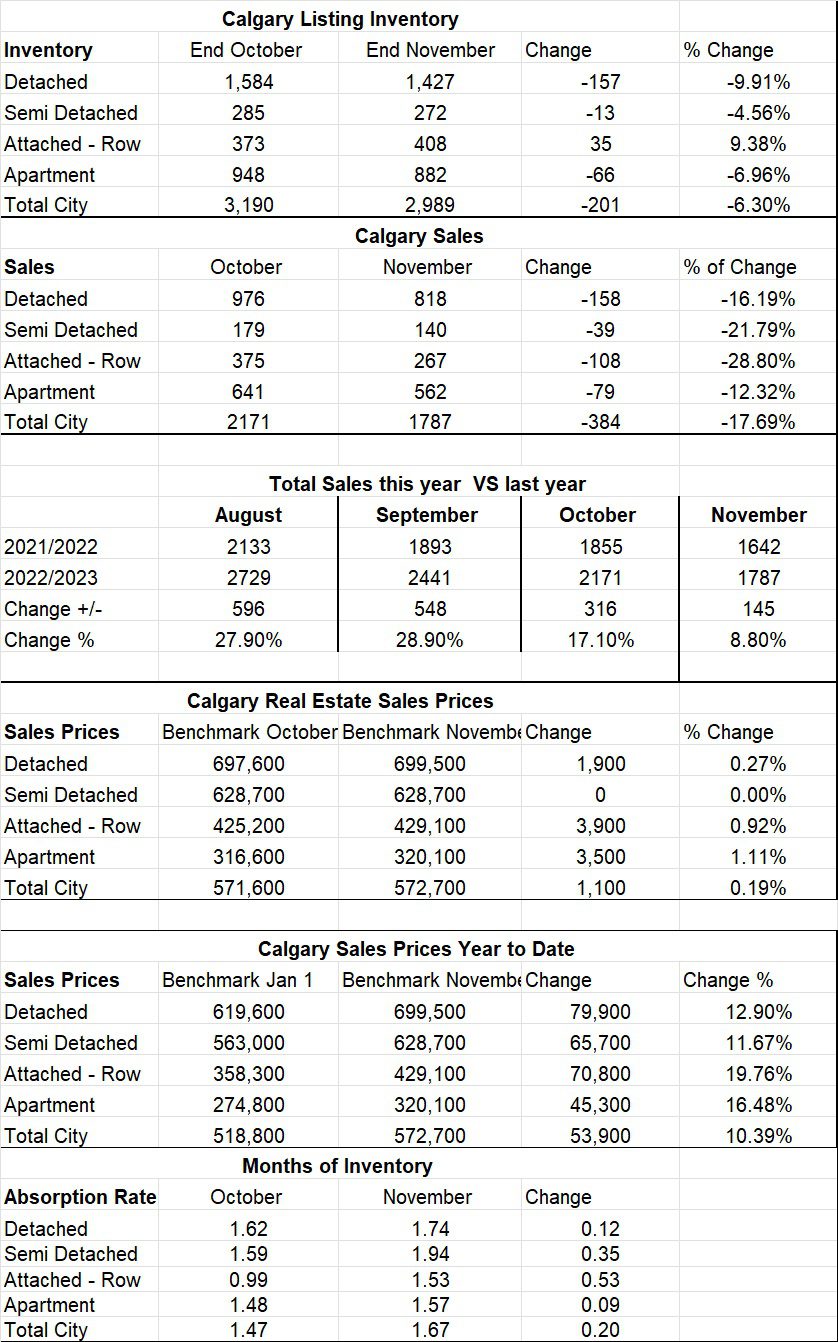
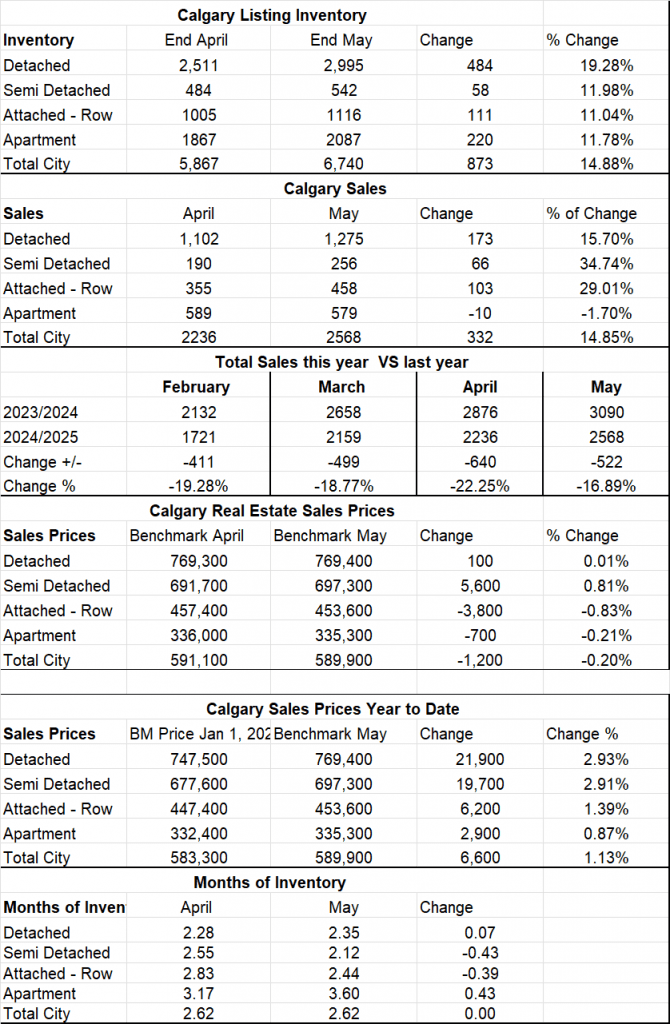
*Below is a summary of numbers in chart form. All numbers are taken from the Calgary Real Estate Boards monthly Stats package.
*All numbers vary by community and price ranges, if you would like stats specifically for your neighbourhood, please contact us.
Calgary Real Estate Board Realtors Stats