What is really happening in the Calgary Real Estate Market?
The market is a result of Supply and Demand therefore we look at both Supply (inventory) and Demand (Sales) and the relationship between the two. We also update you on the current benchmark price for all housing sectors.
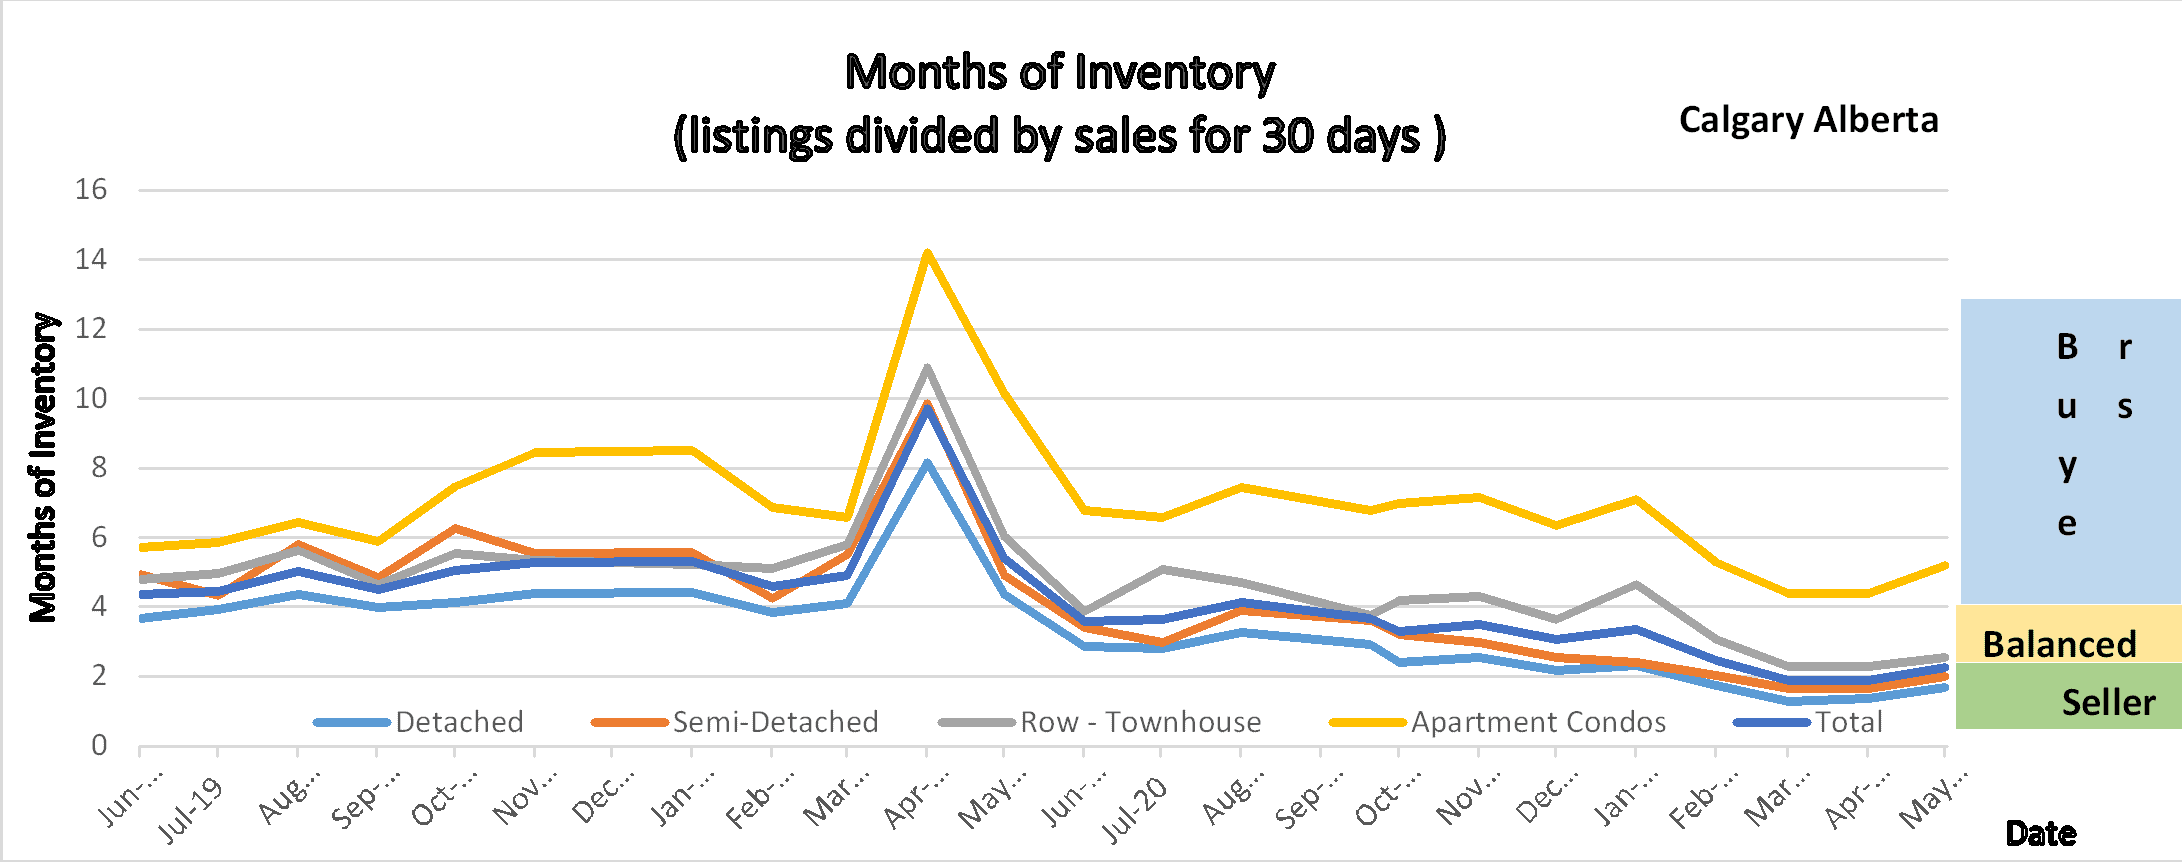
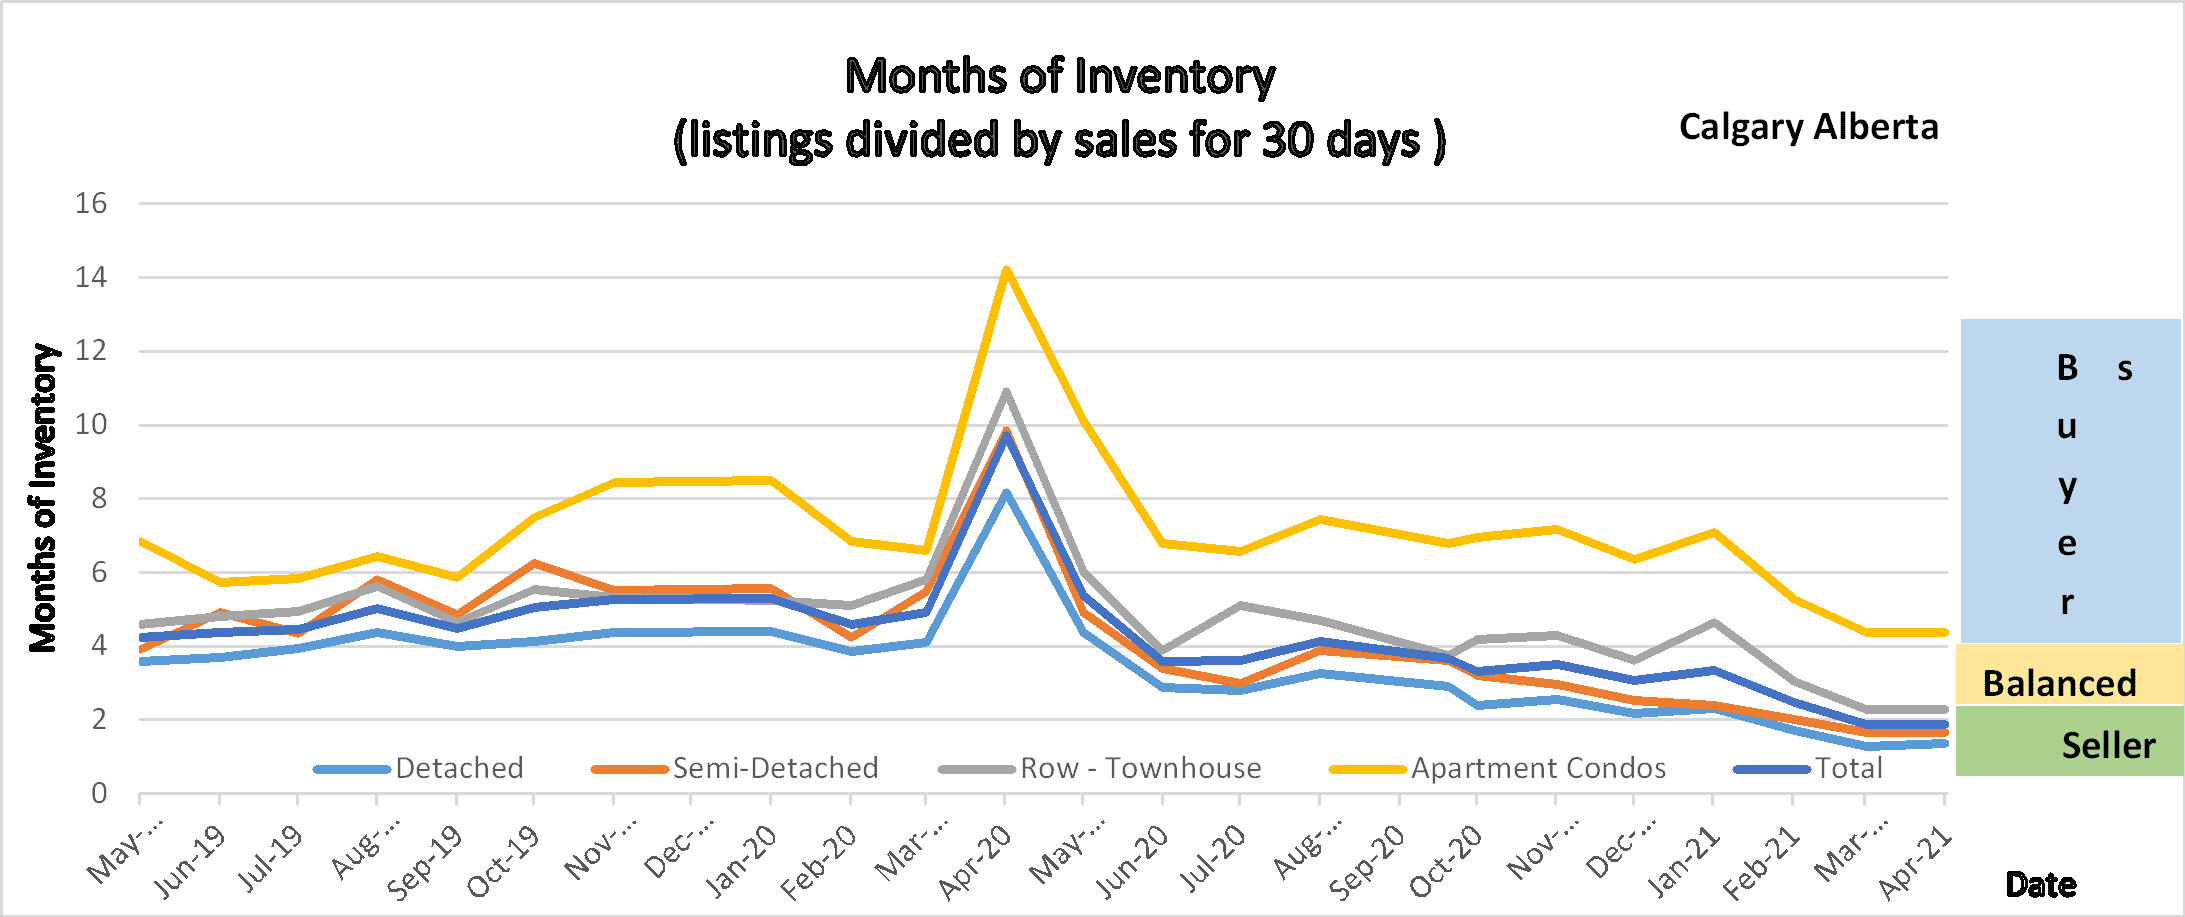
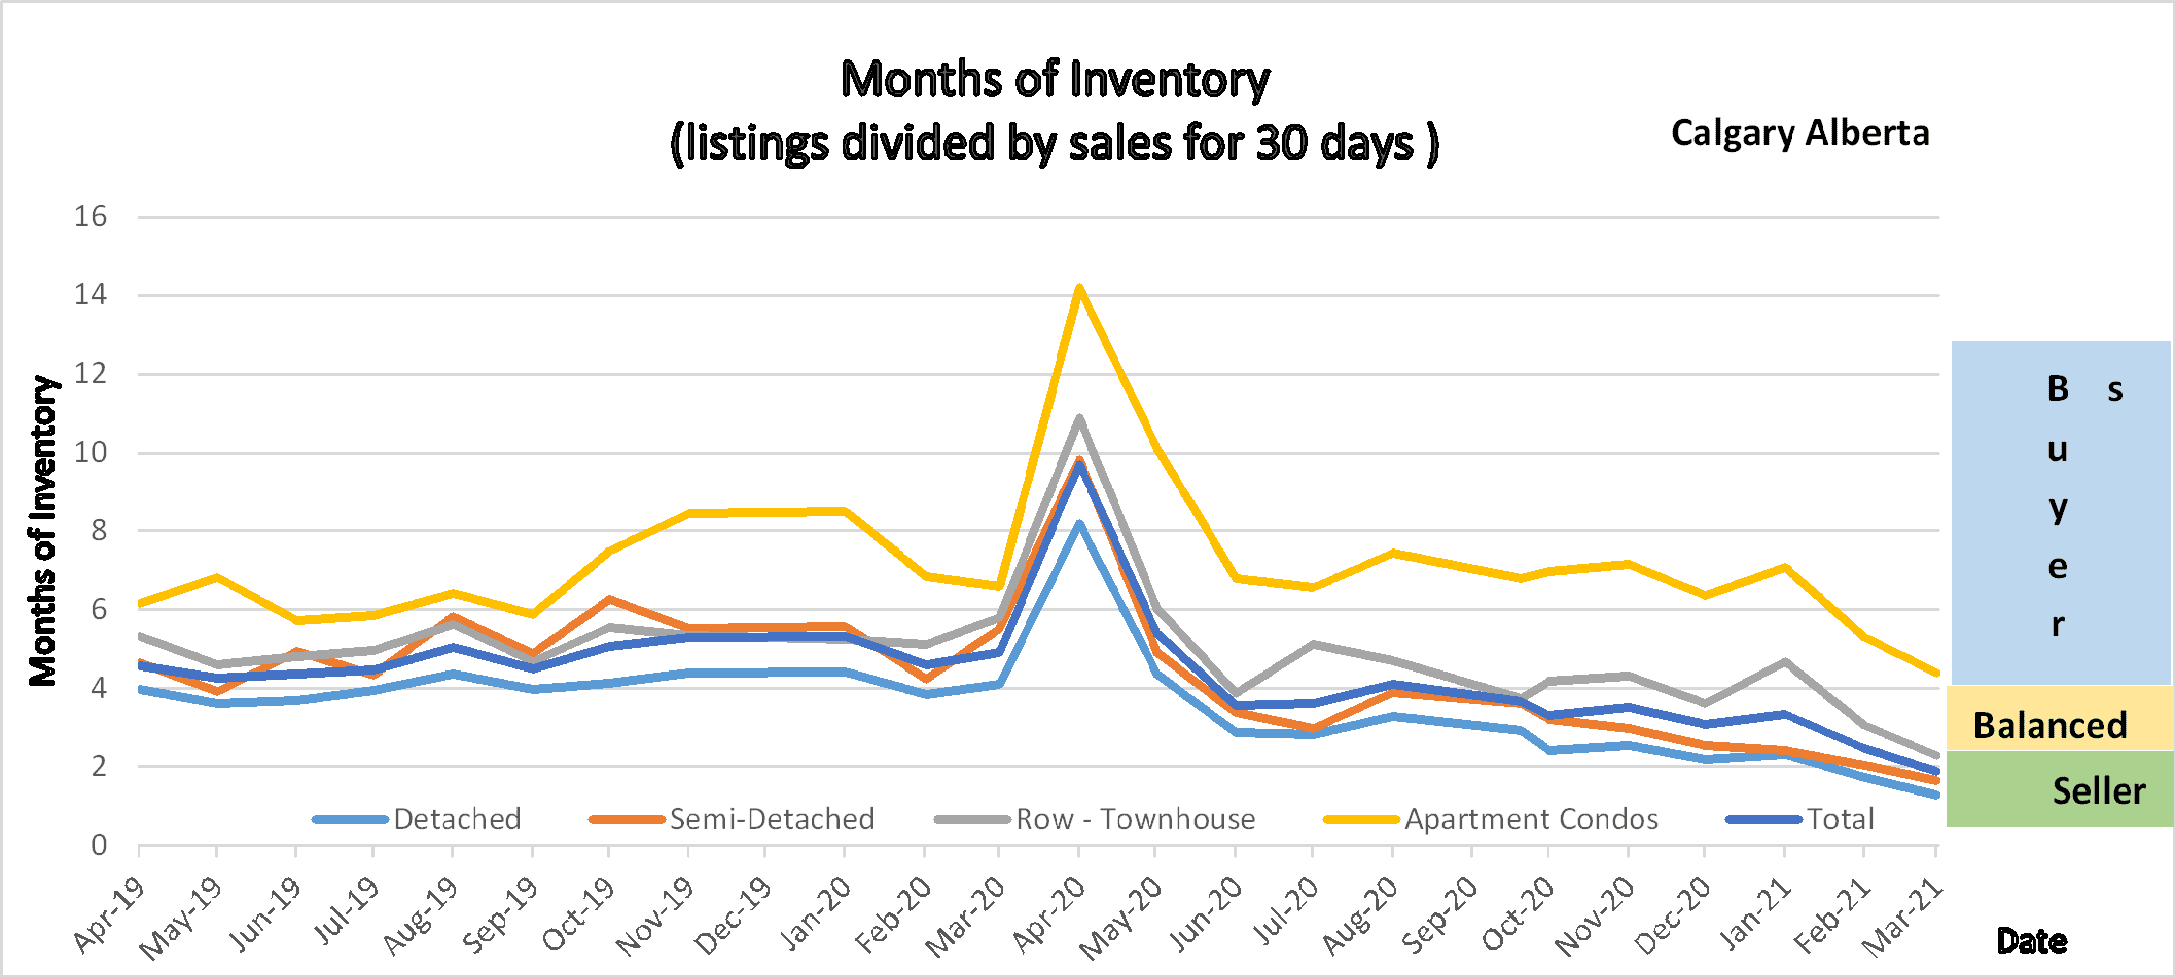
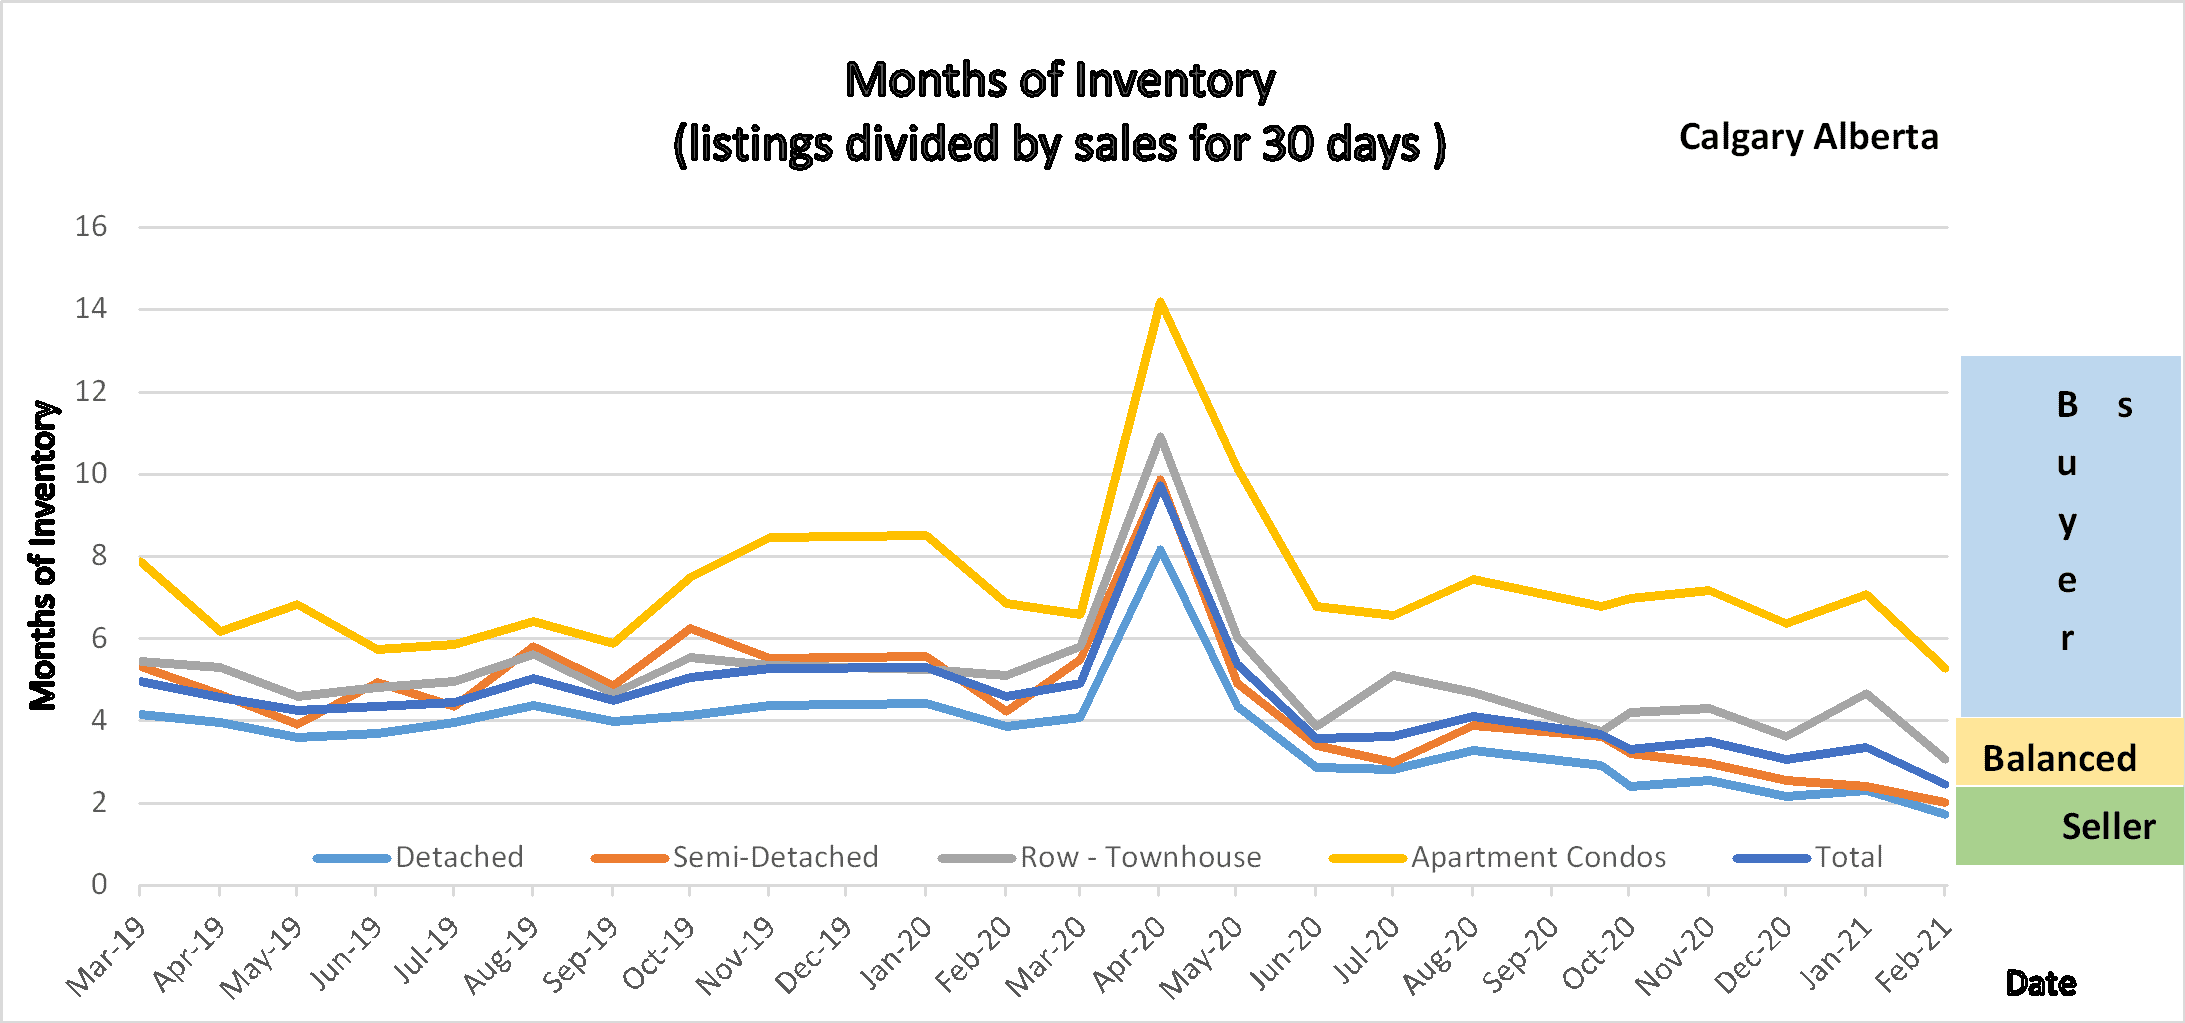
Following is a graph that shows the months of inventory for each housing sector. Looking at a 2-year trendline gives you an indication of where things are really heading.
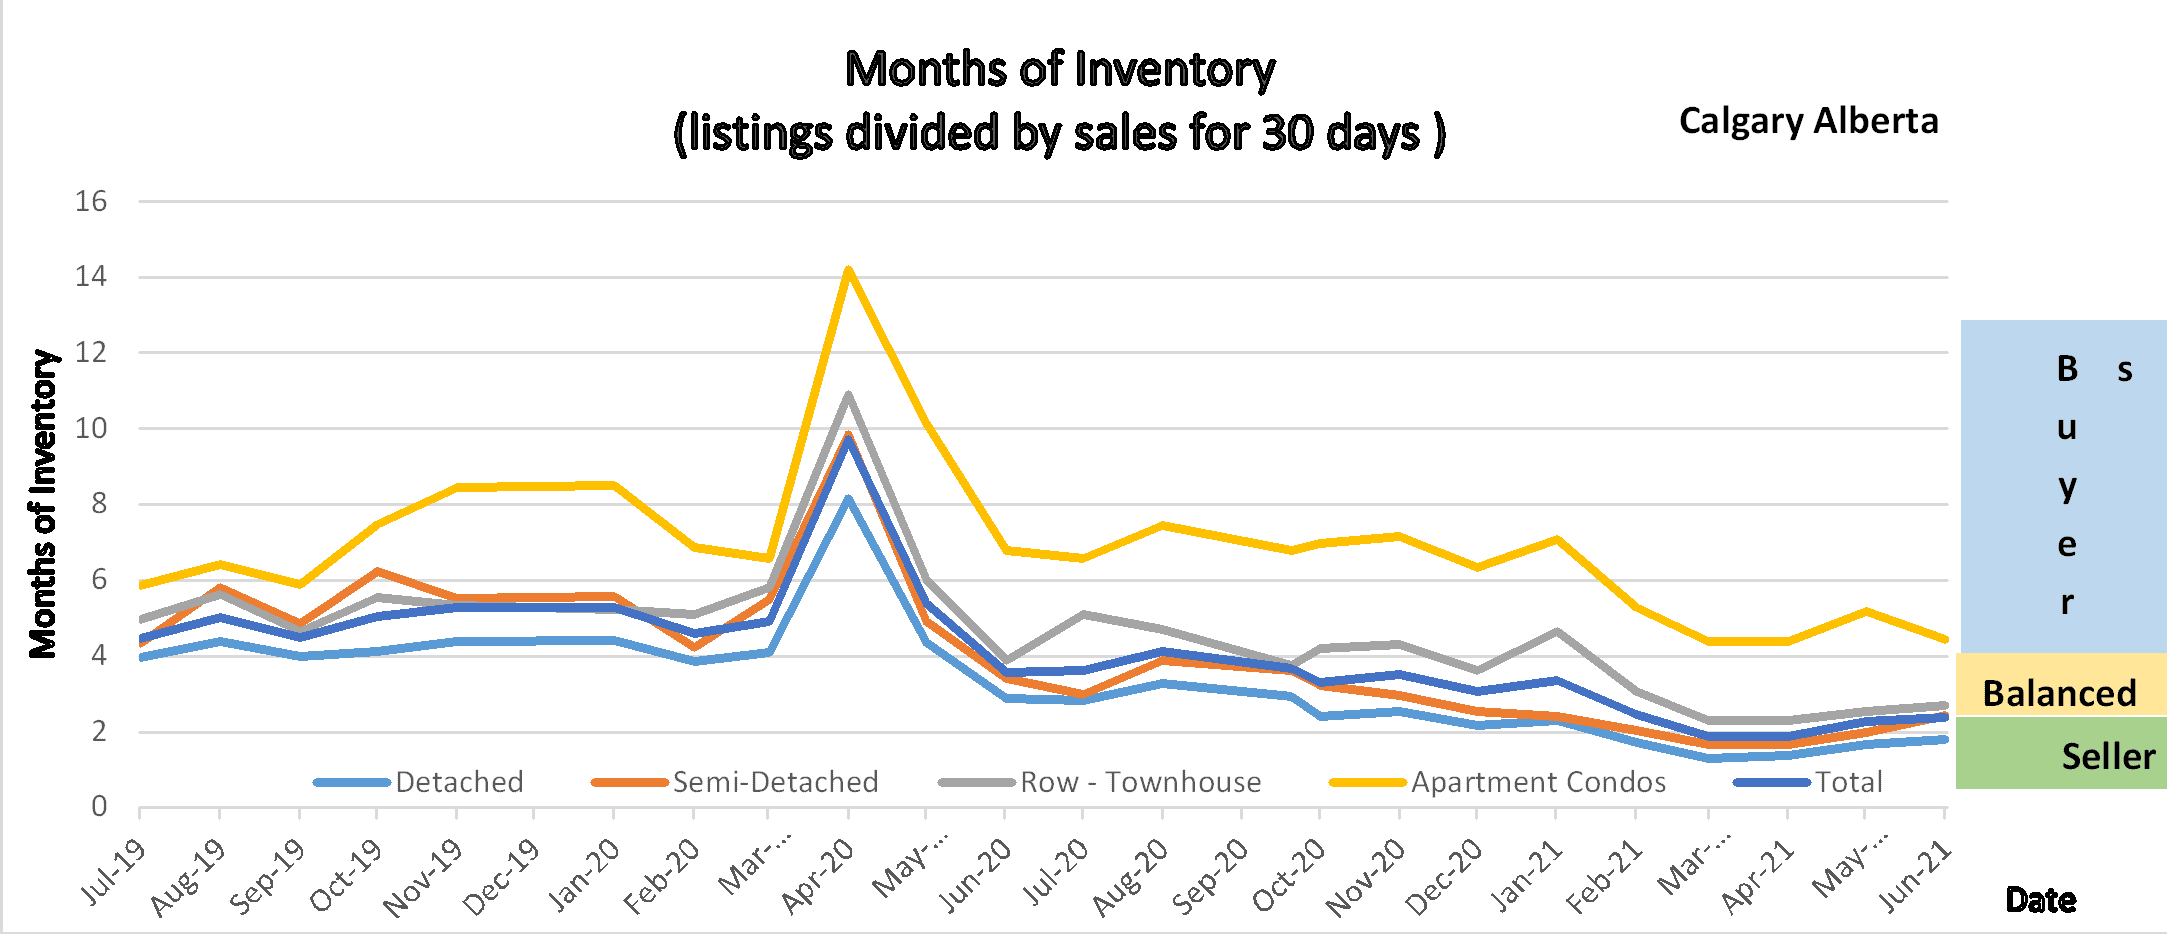
Graph shows the 2 month trend of months of inventory for all sectors in the Calgary Real Estate Market.
Gord’s commentary for the month (just my opinion).
Another solid month in the Calgary Real Estate Market showing the highest number of sales in June on record. Although sales have declined the market is still favoring Sellers or balanced except for the Apartment Condo sector.
The booming market has already brought out sellers who are fishing for huge dollars, yes there are more than a normal number of homes listed substantially above what the market will bear. This is what is going to cause the inventory to increase and balance out the market. Buyers be aware when shopping.
I have also noticed a decline in the intensity of buyers to compete on offers, there are still competing offers happening everywhere but the amount that buyers are going above list price is in my opinion shrinking.
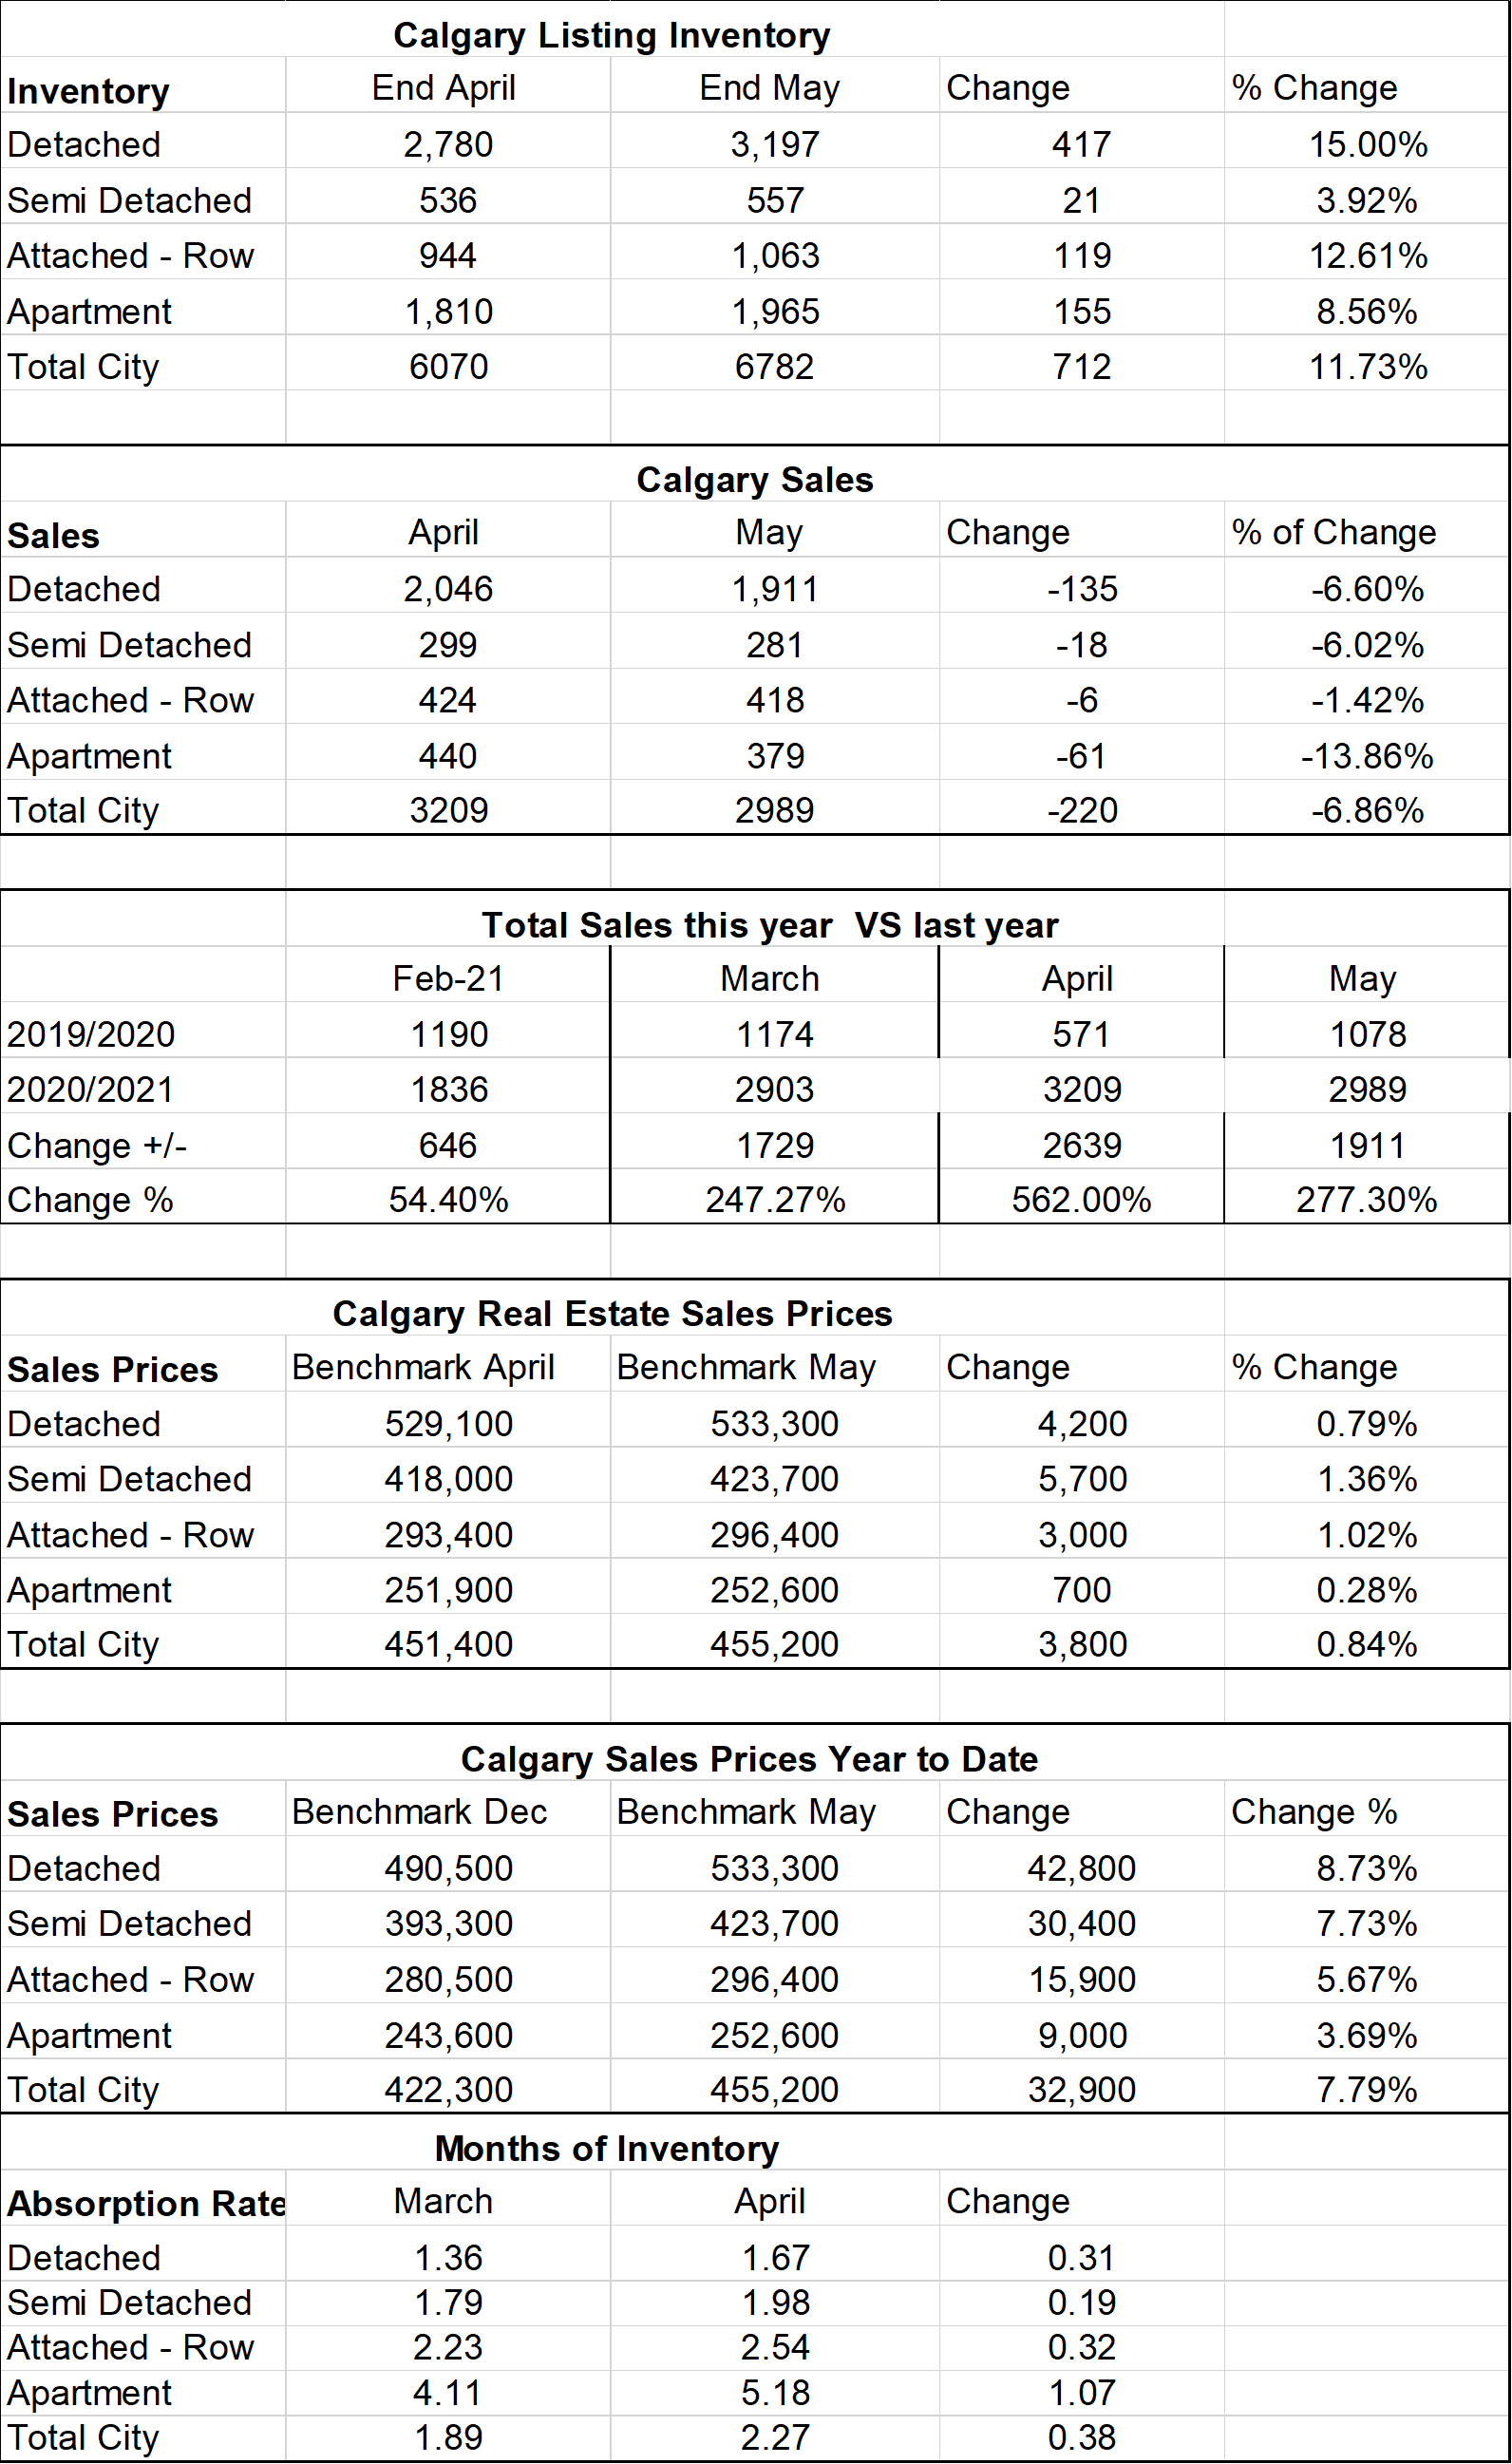
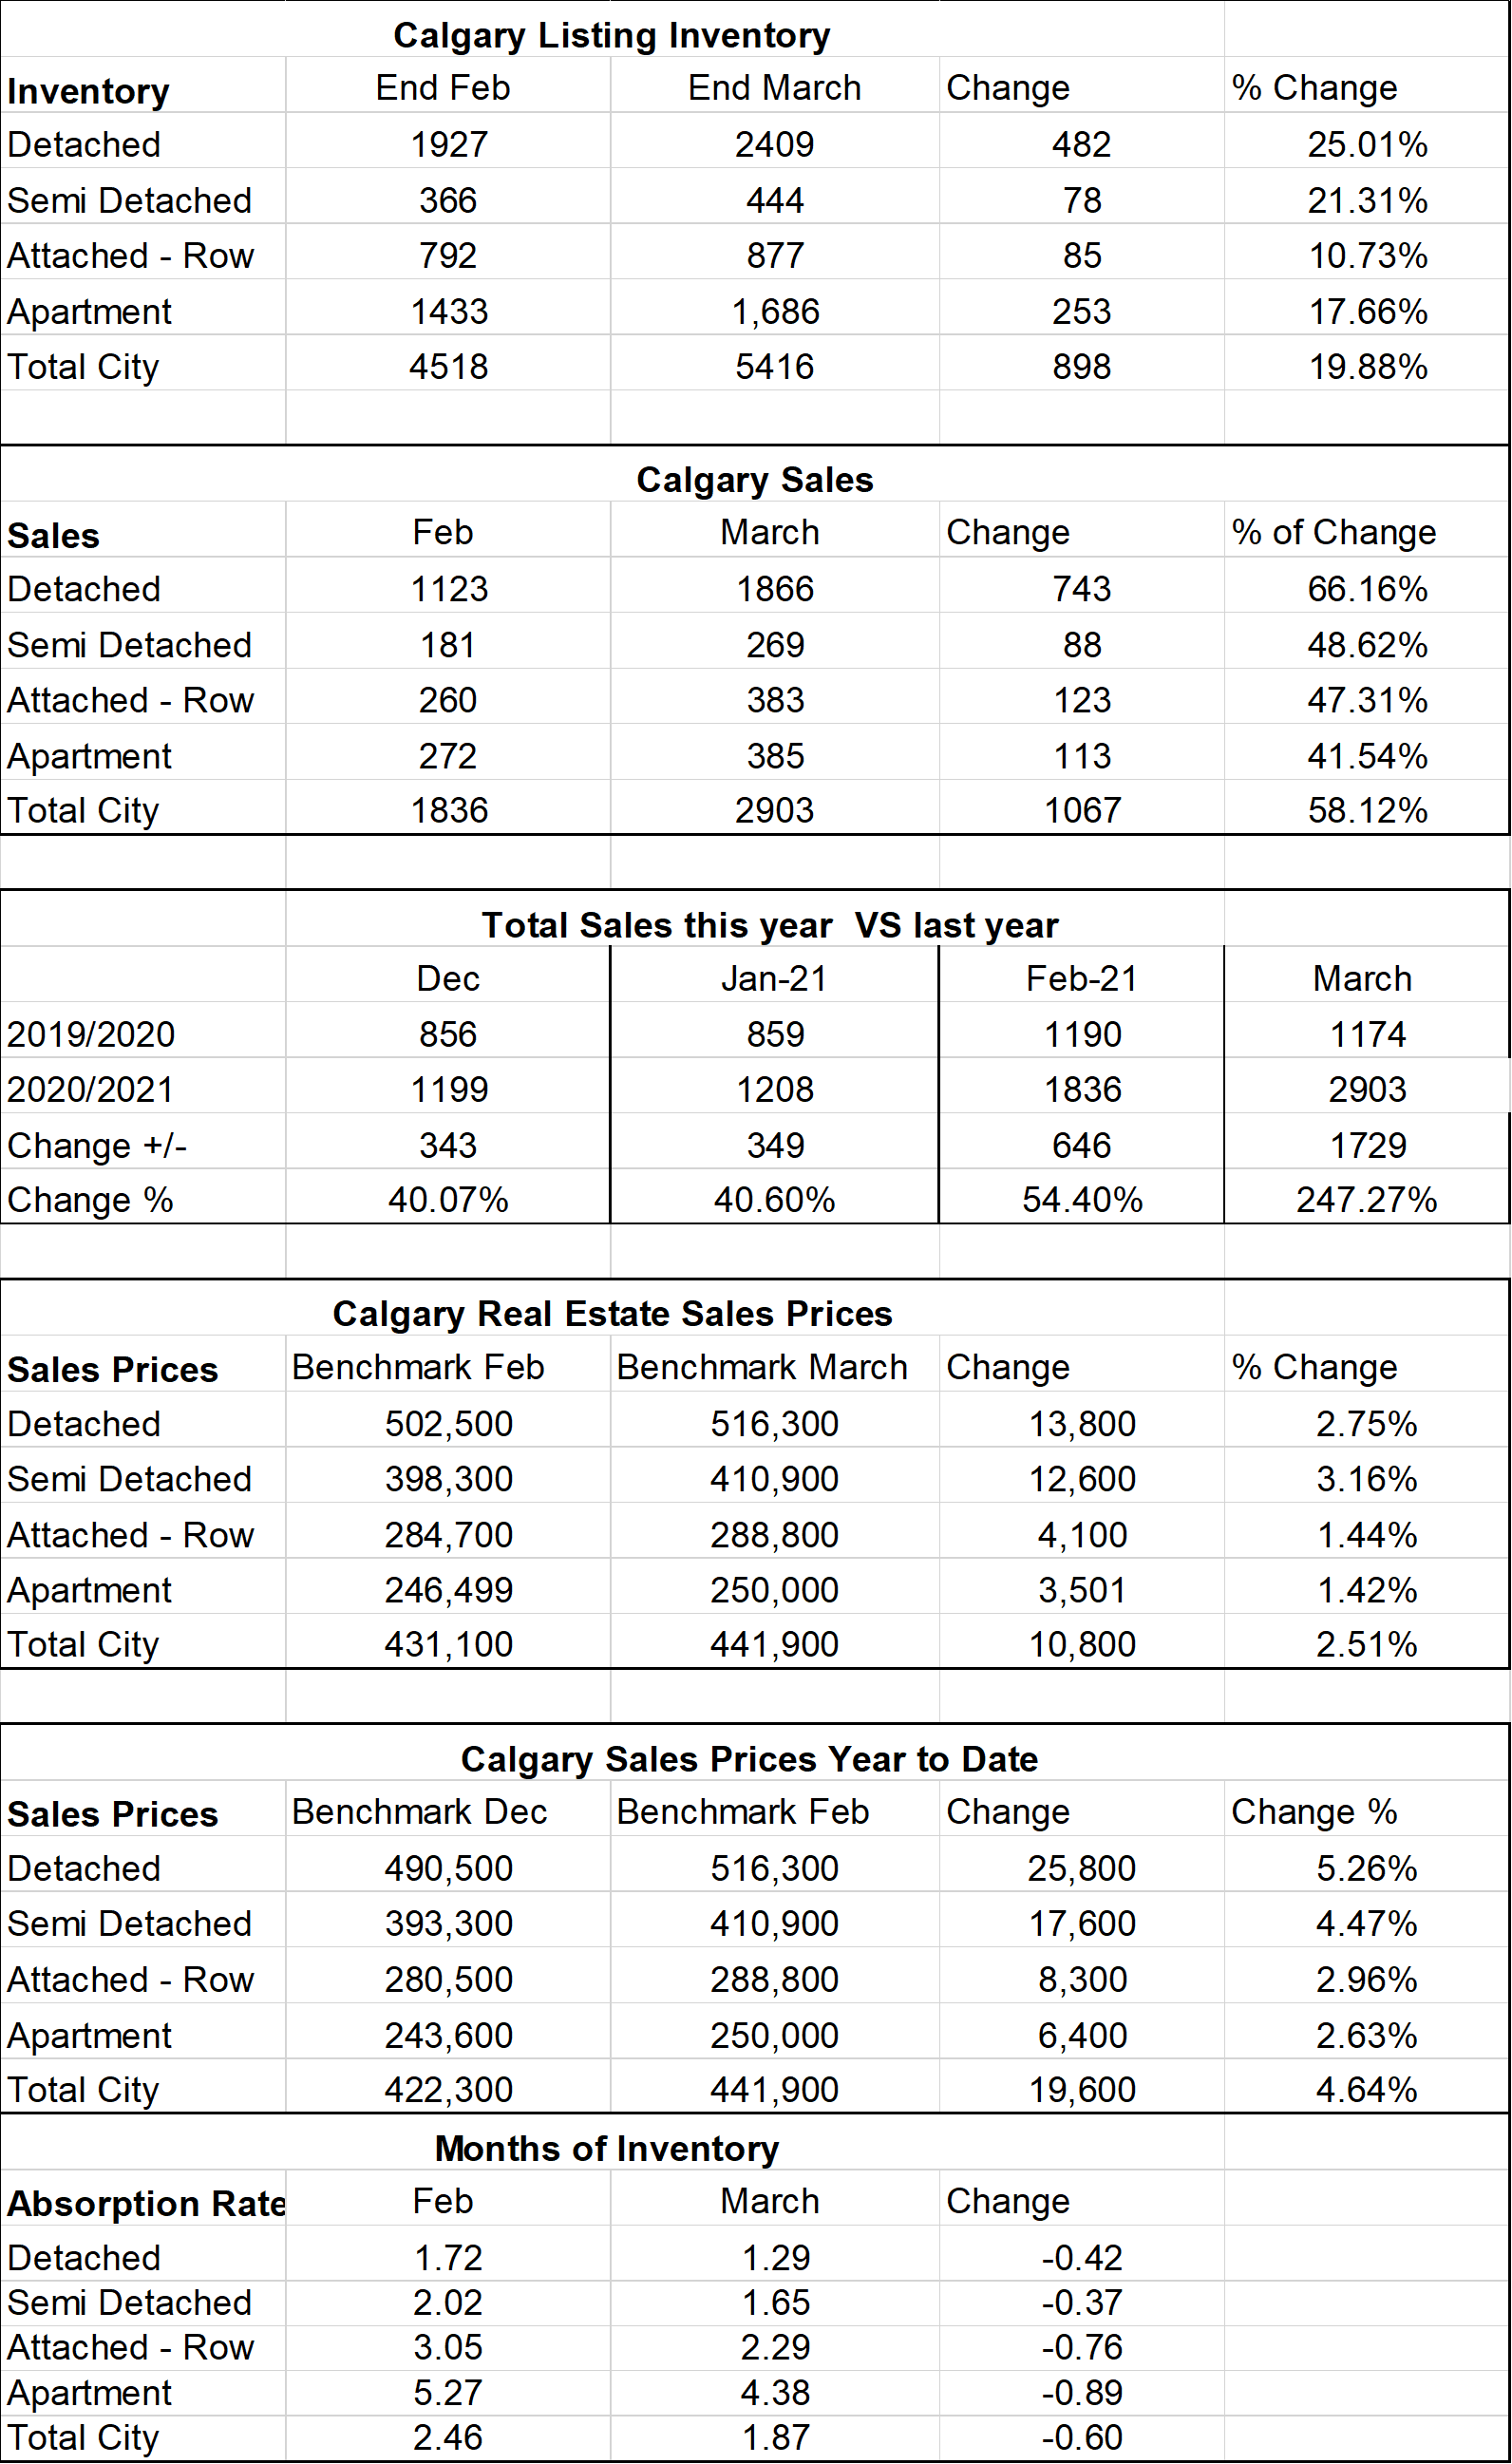
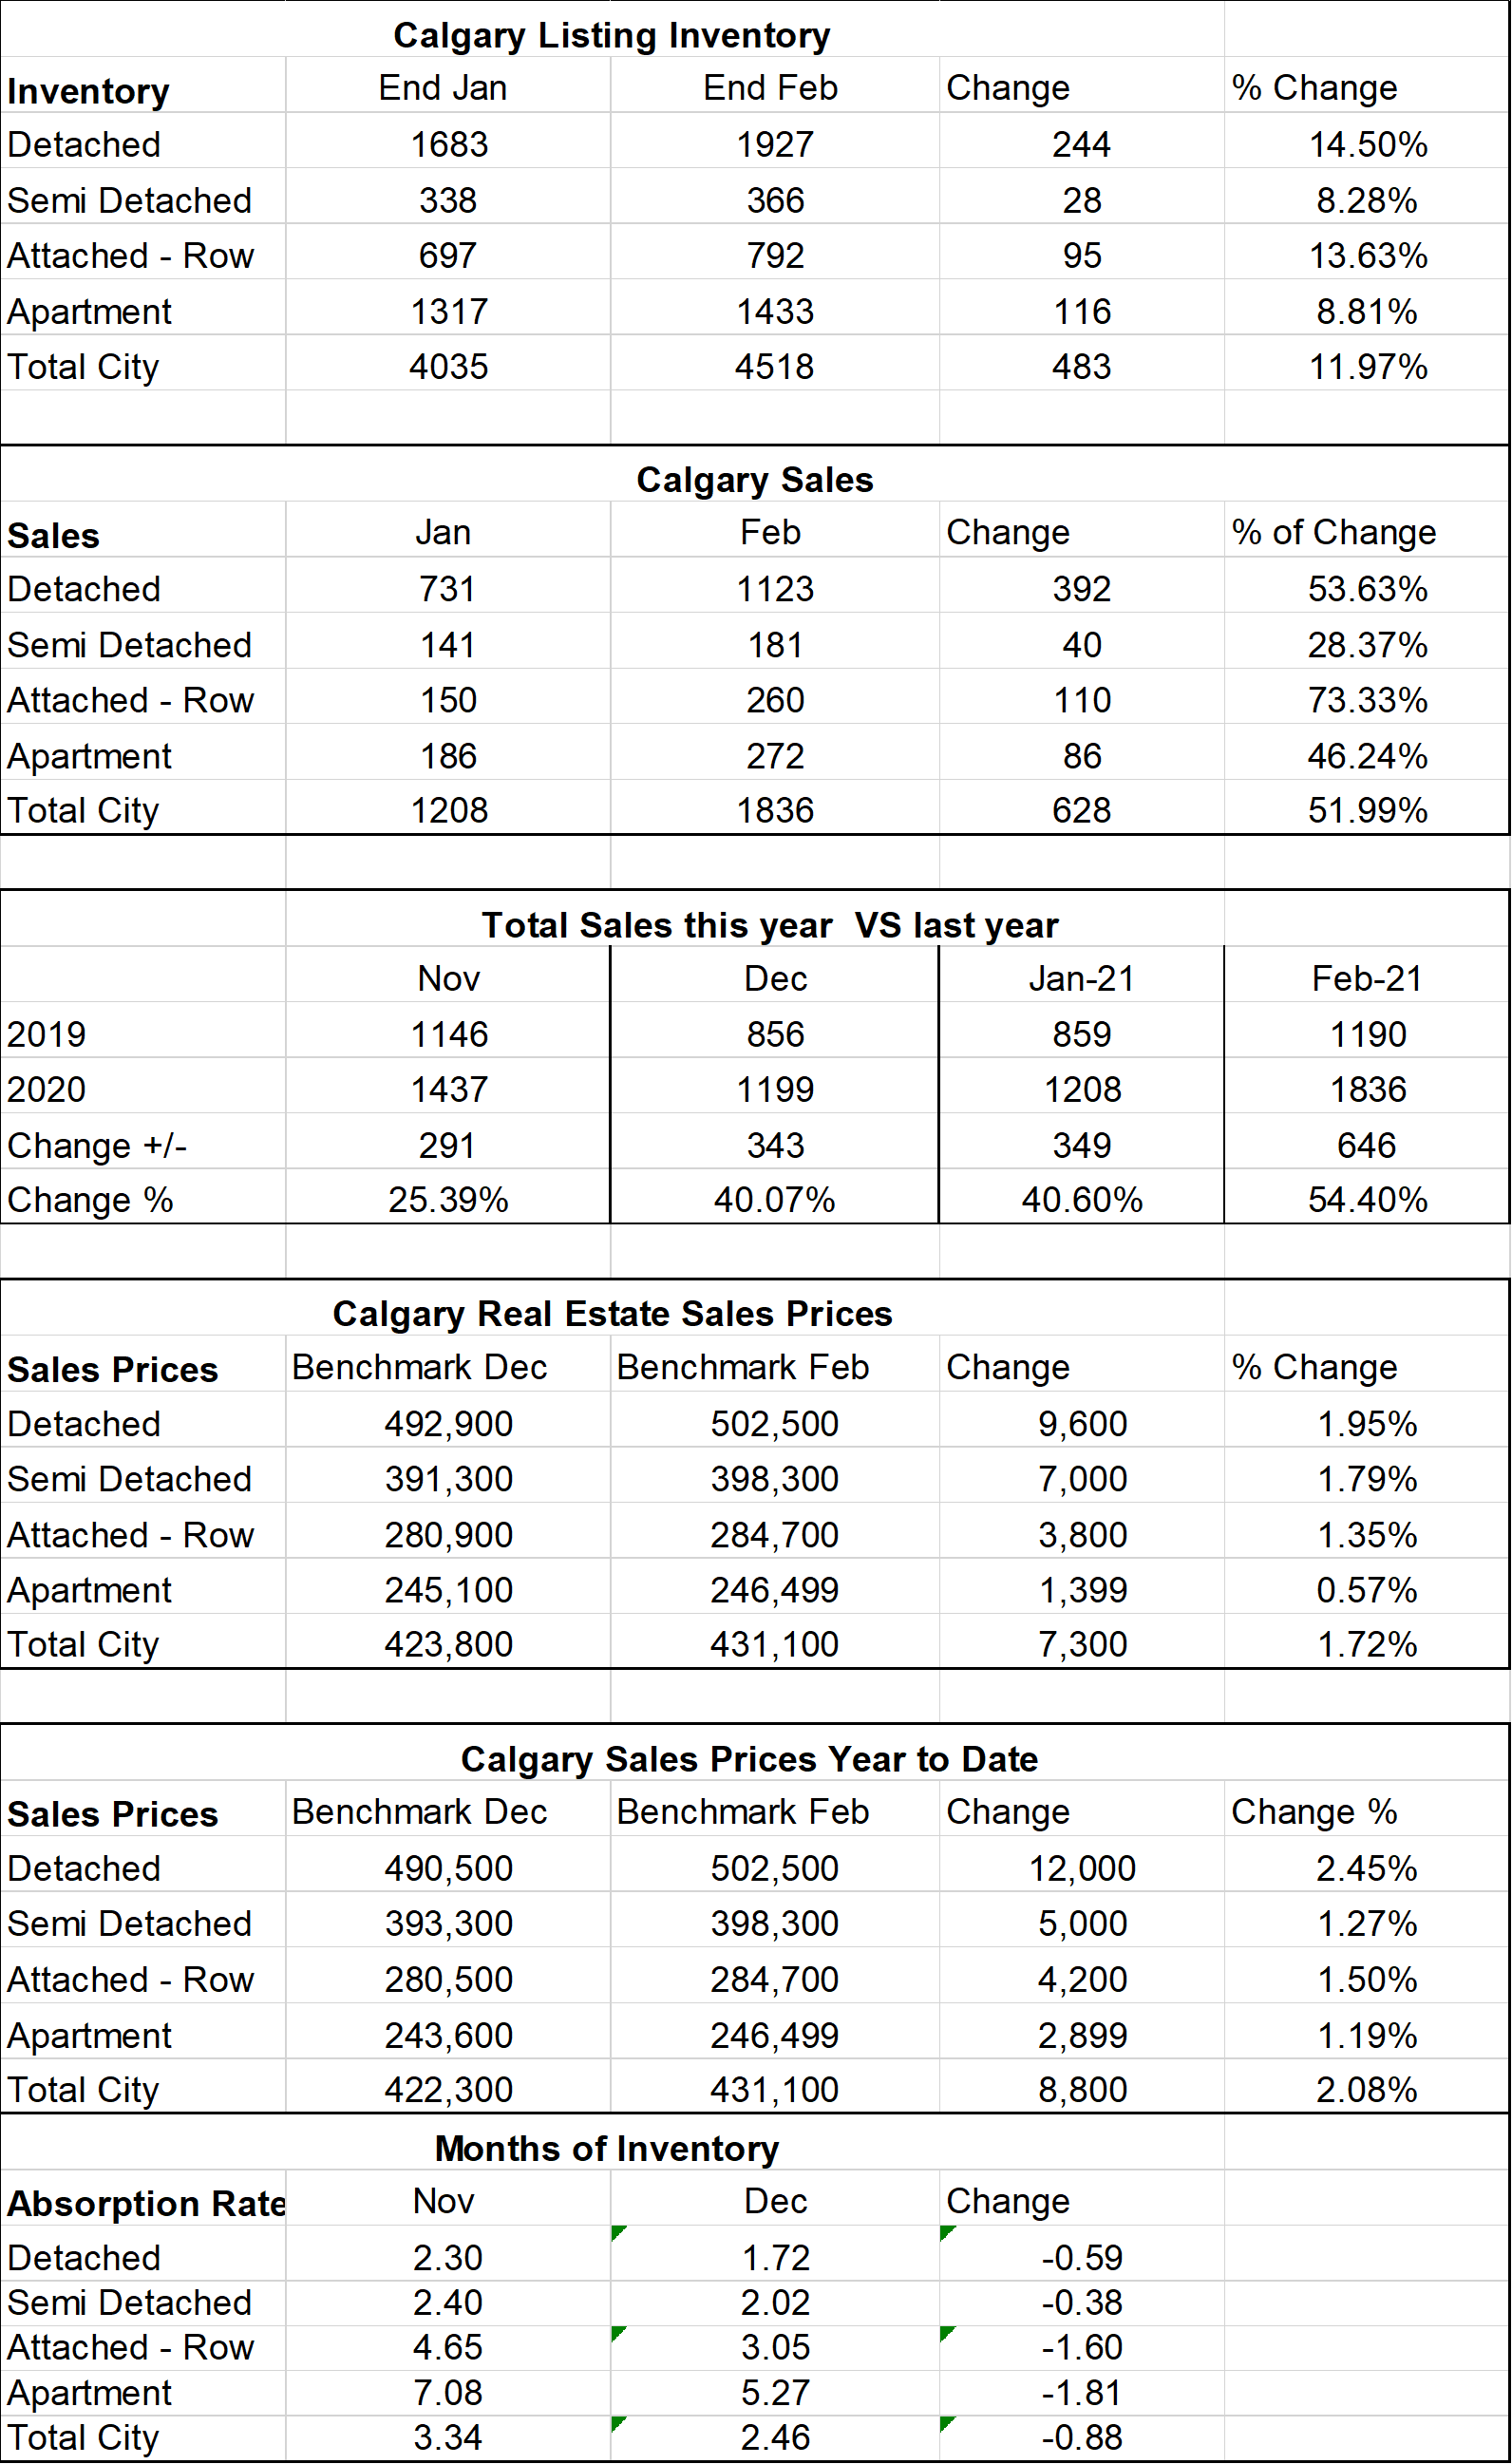
Calgary Listing Inventory
Our listing inventory increased by 136 through June. As of today, we are 2.01% higher than currently a month ago.
Calgary Sales:
Sales in June decreased by 74 or 2.48%
What is interesting here is that sales declined by 4.8% in Detached homes and 13.5% in Semi-Detached homes while sales in the Apartment sector increased by 16.6%
What is likely driving this is with the price increases some people may have moved into the Apartment Condo sector.
Sales Compared to 2020:
Normally this is a good category to watch however we are now comparing sales this year to when we were
in a collapsed market due to Covid and the First Shutdown. As you can see sales in June were 65.3% higher
than in June 2020.
| Jan | Feb | Mar | Apr | May | June | |
| 2020 | 861 | 1190 | 1175 | 573 | 1080 | 1763 |
| 2021 | 1208 | 1836 | 2903 | 3209 | 2989 | 2915 |
| Change | +347 | +646 | +1729 | +2639 | 1,911 | 1,152 |
| % Change | +7.49 | +54.4 | 247% | +562% | 277.3% | 65.3% |
| July | Aug | Sept | Oct | Nov | Dec | |
| 2020 | 1835 | 80 | 1702 | 1764 | 1437 | 1199 |
| 2021 | ||||||
| Change | ||||||
| % Change |
Calgary Real Estate Benchmark Sales Prices:
Overall, the benchmark price in Calgary increased again in June by $3,100.
The highest gains were in Detached homes at +$3,900 and the lowest gains we $400 in the Apartment sector which makes total sense based on Months of Inventory.
Current Months of Inventory (Absorption Rate):
With a slight increase in Inventory and a slight decrease in sales, all sectors (except apartment Condos) increased our months of Inventory slightly. Apartment condos months of Inventory went from 5.18 to 4.44 the largest decrease is quite some time as apartment condos have been struggling since 2015.
Buyers Markets include Apartment Condos.
Balanced Markers include Attached Row homes and Semi-Detached sectors.
Sellers Markets include just Detached Homes.
It is also important to note that these numbers vary by community, and by price range. If you would like numbers for your community, or more specific numbers for your home please contact us.
Below is a summary of numbers in chart form. All numbers are taken from the Calgary Real Estate Boards monthly Stats package.

This photo shows key stats that are taken from the stats package produces by the Calgary Real Estate Board.