Posts Tagged ‘Calgary House Prices’

Calgary Real Estate Market Snapshot – Dec. 1, 2017

Saturday, December 2nd, 2017

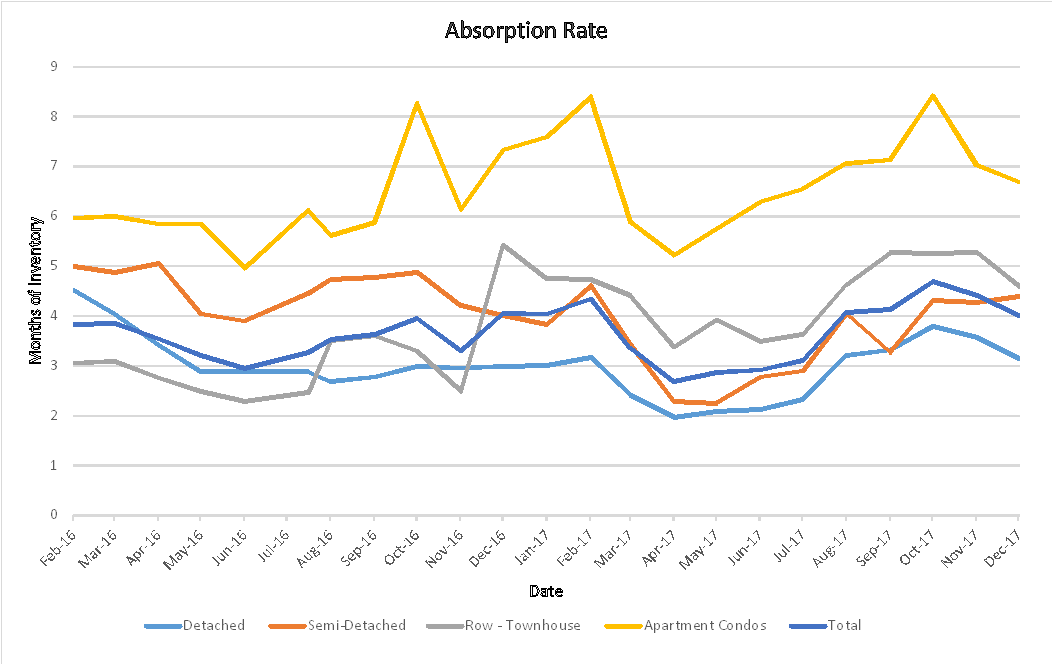
Absorption Rate Dec. 2017

What is really happening in the Calgary Real Estate Market?

Stay ahead of everyone else by following our Monthly Market Snapshot of the Calgary Real Estate Market This shows what’s really happening! The market is driven by supply and demand so here we show the inventory (supply) and sales (demand) and most importantly the relationship between the two and how it affects the price of Calgary Real Estate.  A simple way to keep up to date with how the market is trending and to stay ahead of most! All numbers are taken from the Calgary Real Estate Boards Stats package for Realtors. I have also included some general comments which are simply my opinion.

What is Absorption Rate (Months of Inventory)   (the inventory divided by the number of sales in the last month). What does this mean you might ask?

Buyer’s Market >4.0 Drives prices down
Balanced Market Between 2.4 to 4.0 Prices typically remain stable
Seller’s Market <2.4 Drives prices up

Current Absorption Rate

The Absorption rate for November decreased in all categories except Semi – Detached which rose a little.  In my opinion this is mainly due to listings expiring and not due to sales.  Either way this is good as it is keeping the market fairly balanced. 

Oct  2017  Nov  2017  Change
Detached 3.57 3.15 -0.42
Semi Detached 4.27 4.40 0.13
Attached – Row 5.28 4.60 -0.68
Apartment 7.03 6.69 -0.35
Total City 4.41 4.01 -0.39


Calgary Listing Inventory

In November all categories saw a decrease in the number of listings.  This is normal for this time of year where people will let their listing expire and then put it back on in the new year.

Inventory Oct  2017  Nov  2017  Change
Detached 3246 2758 -488
Semi Detached 611 555 -56
Attached – Row 967 861 -106
Apartment 1639 1491 -148
Total City 6463 5665 -798


Calgary Sales:

Sales for November saw a small decrease overall.  Attached Row homes are the only category to show an increase.  Semi-Detached saw a rather large decrease and it’s my belief that this is simply listings expiring that will be relisted in January.

Of interest Calgary year to date sales are 15% above last year’s sales.

Calgary Sales  Oct  2017  Nov  2017  Change % Change
Detached 908 875 -33 -3.63%
Semi Detached 143 126 -17 -11.89%
Attached – Row 183 187 4 2.19%
Apartment 233 223 -10 -4.29%
Total City 1467 1411 -56 -3.82%


Calgary Real Estate Sales Prices:

Prices for November showed a slight decrease in Calgary.  This in my opinion is mainly due to consumer confidence or lack of it.

  Sales Prices Oct  2017  Benchmark Price   Nov  2017  Benchmark Price Change
Detached 506,200 504,000 -2,200
Semi Detached 419,000 417,800 -1,200
Attached – Row 305,000 303,100 -1,900
Apartment 261,600 258,300 -3,300
Total City 438,900 436,700 -2,200


Sales Prices “Year to Date”  

Sales Prices Jan 1, 2017    Benchmark Price  Nov  2017  Benchmark Price Change

$

% Change
Detached 498,700 504,000 5,300 1.06%
Semi Detached 406,800 417,800 11,000 2.70%
Attached – Row 302,600 303,100 500 0.17%
Apartment 265,000 258,300 -6,700 -2.53%
Total City 433,400 436,700 3,300 0.76%

 **Please note that these numbers include only Calgary homes and do change on a community basis and more so for towns.  This report does not include rural properties.  If you would like to find stats on your community just let me know.

August 1, 2017 Market Snapshot

Wednesday, August 2nd, 2017

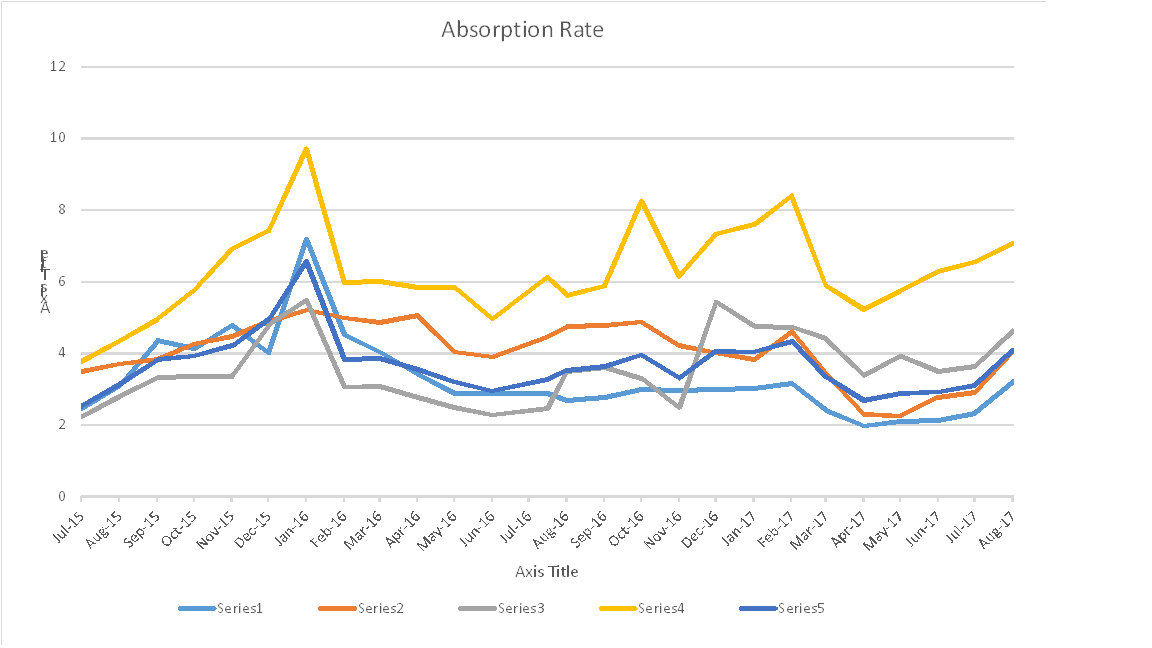
Absorption Rate Graph

What is really happening in the Calgary Real Estate Market?

Stay ahead of everyone else by following our Monthly Market Snapshot of the Calgary Real Estate Market This shows what’s really happening! The market is driven by supply and demand so here we show the inventory (supply) and sales (demand) and most importantly the relationship between the two and how it affects the price of Calgary Real Estate.  A simple way to keep up to date with how the market is trending and to stay ahead of most! All numbers are taken from the Calgary Real Estate Boards Stats package for Realtors. I have also included some general comments which are simply my opinion.

Absorption Rate (Months of Inventory)   (the inventory divided by the number of sales in the last month). What does this mean you might ask?

Buyer’s Market >4.0 Drives prices down
Balanced Market Between 2.4 to 4.0 Prices typically remain stable
Seller’s Market <2.4 Drives prices up

Important Disclaimer:  ***Error***   For those who regularly follow my Market Snapshot you may notice the numbers from last month do not jive with the numbers from this month.  It appears to me that this is a correction reversing last month’s numbers from the Real Estate Board.

The chart below shows the change in Sales Price numbers for June and July, so you can see it’s a numbers correction and not what’s really happening.  Hopefully this is the last error!

These numbers also reflect what I am seeing in the Market with infills rising and townhouses declining in price.


June Prices July Prices Net Change 2 Months
Semi-Detached +39,000 (11,300) +27,700
Row – Townhouses (14,300) +12,700 (1,600)

_______________________________________________________________________________

August Market Snapshot Report 

*** Absorption Rate

The Absorption rate for July saw all categories increase.   This is somewhat normal for this time of year as the majority of summer vacations are taken between July 15th to Aug 15th.  Our scorching weather may have played a factor in this as well.


June 2017 July  2017  Change
Detached 2.33 3.21 0.88
Semi Detached 2.90 4.05 1.15
Attached – Row 3.63 4.63 1.01
Apartment 6.55 7.07 0.52
Total City 3.11 4.08 0.97


Calgary Listing Inventory

In July we saw an increase in all categories except apartment condos.  I’m speculating the only reason we saw a decline in apartment condos is that many of the listings that are not selling are starting to expire.

Inventory June 2017 July  2017  Change
Detached 3224 3268 44
Semi Detached 560 596 36
Attached – Row 1001 1001 0
Apartment 1874 1810 -64
Total City 6659 6675 16


Calgary Sales:

As you can see sales declined in all categories in July.  Once again I believe this change to be mostly seasonal and also partially due to the hot weather.  This is the first month in a while where we have seen such large decreases.

Calgary Sales  June 2017 July  2017  Change % Change
Detached 1385 1018 -367 -26.50%
Semi Detached 193 147 -46 -23.83%
Attached – Row 276 216 -60 -21.74%
Apartment 286 256 -30 -10.49%
Total City 2140 1637 -503 -23.50%


Calgary Real Estate Sales Prices:

For July we saw small increases in price with the exception of the data errors mentioned above.

Moving forward I expect that detached and semi-detached will remain flat, townhouses may decrease a little more and apartment condos will continue to decrease.

  Sales Prices June 2017 Benchmark Price   July  2017  Benchmark Price Change
Detached 509,400 512,100 2,700
Semi Detached 432,100 420,800 -11,300
Attached – Row 294,000 306,700 12,700
Apartment 265,800 266,200 400
Total City 441,500 443,600 2,100


Sales Prices “Year to Date”  


Sales Prices Jan 1, 2017    Benchmark Price  June 2017  Benchmark Price Change

$

% Change
Detached 498,700 512,100 13,400 2.69%
Semi Detached 406,800 420,800 14,000 3.44%
Attached – Row 302,600 306,700 4,100 1.35%
Apartment 265,000 266,200 1,200 0.45%
Total City 433,400 443,600 10,200 2.35%


**Please note that these numbers include only Calgary homes and do change on a community basis and more so for towns.  This report does not include rural properties.  If you would like to find stats on your community just let me know.  If you have any questions about this summary or Real Estate questions please feel free to contact us.

TSW Real Estate Group

Gord Piper & Brent Wilcox


March 1, 2017 Calgary Real Estate snapshot

Wednesday, March 1st, 2017

The Calgary Real Estate Market in changing.

Detached homes are now in a Seller’s market position

Semi-Detached homes are now into a balanced market position

Row (Townhouses) and Apartment condos are in a buyers market position but have moved drastically into a better market (towards balanced)


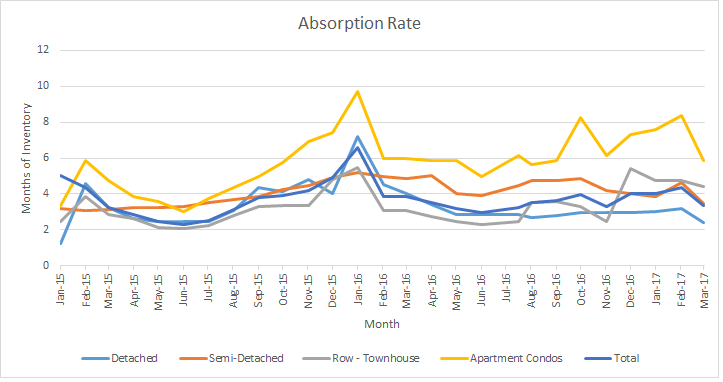
Absorption rate for the Calgary Real Estate market for February 2017.

Absorption rate for the Calgary Real Estate market for February 2017.

What is really happening in the Calgary Real Estate market?

Stay ahead of everyone else by following our Monthly Market Snapshot of the Calgary Real Estate Market This shows what’s really happening! The market is driven by supply and demand so here we show the inventory (supply) and sales (demand) and most importantly the relationship between the two and how it affects the price of Calgary Real Estate.  A simple way to keep up to date with how the market is trending and to stay ahead of most! All numbers are taken from the Calgary Real Estate Boards Stats package for Realtors. I have also included some general comments which are simply my opinion.

Absorption Rate (Months of Inventory)   (the inventory divided by the number of sales in the last month). What does this mean you might ask?

Buyer’s Market >4.0 Drives prices down
Balanced Market Between 2.4 to 4.0 Prices typically remain stable
Seller’s Market <2.4 Drives prices up

*** Absorption Rate***  

The absorption rate for all of Calgary decreased quite substantially this month.  Not a lot of listings going on market but more importantly a large increase in sales is driving this.  Detached homes have now gone into a Seller’s Market position,  Attached-Row & Apartment condos are still in a buyer’s market and Semi-detached is in a balanced market.


December   2016 January  2017 Change
Detached 3.17 2.41 -0.75
Semi Detached 4.61 3.44 -1.17
Attached – Row 4.73 4.41 -0.32
Apartment 8.40 5.88 -2.53
Total City 4.34 3.35 -0.99


Calgary Listing Inventory

February saw a slight increase in our inventory level in all categories.  This is a normal pattern for February as were approaching the spring market.  Normal trends would predict that over the next few months we will continue to see more listings so a further increase in inventory.

Inventory December   2016 January  2017 Change
Detached 1849 1990 141
Semi Detached 383 437 54
Attached – Row 610 679 69
Apartment 1269 1387 118
Total City 4112 4493 381


Calgary Sales:

Wow.  Every Category saw a large increase in sales in February.  The smallest increase was in Attached-row houses (townhouses) and they still increased over Jan by 19.38%   It is normal for us to see an increase in sales from Jan to Feb but this is a large increase which the Calgary Market has been waiting for, for some time.


Calgary Sales   December   2016 January  2017 Change % Change
Detached 584 825 241 41.27%
Semi Detached 83 127 44 53.01%
Attached – Row 129 154 25 19.38%
Apartment 151 236 85 56.29%
Total City 947 1342 395 41.71%


Calgary Real Estate Sales Prices: 

Prices are consistent with our Absorption rate with Detached and Semi Detached prices rising while Attached-Row houses and apartment condos decreased a little more as they are still in a buyer’s market position.   My predictions for the next few months is more of the same trends.

  Sales Prices December   2016 Benchmark Price  January  2017 Benchmark Price Change
Detached 500,400 501,900 1,500
Semi Detached 384,600 386,300 1,700
Attached – Row 307,100 305,900 -1,200
Apartment 269,900 269,200 -700
Total City 437,400 438,100 700


Sales Prices “Year to Date”   


Sales Prices Jan 1, 2017    Benchmark Price  January  2017 Benchmark Price Change

$

% Change
Detached 498,300 501,900 3,600 0.72%
Semi Detached 385,400 386,300 900 0.23%
Attached – Row 307,900 305,900 -2,000 -0.65%
Apartment 269,200 269,200 0 0.00%
Total City 435,400 438,100 2,700 0.62%

Price Sensitivity

**Please note that these numbers include only Calgary homes and do change on a community basis and more so for towns.  This report does not include rural properties.  If you would like to find stats on your community just let me know.  If you have any questions about this summary or Real Estate questions please feel free to contact us.


Sept 1, 2016 Calgary Real Estate Market Snapshot

Friday, September 2nd, 2016

Stay ahead of everyone else by following our Monthly Market Snapshot of the Calgary Real Estate Market This shows what’s really happening! The market is driven by supply and demand so here we show the inventory (supply) and sales (demand) and most importantly the relationship between the two and how it affects the price of Calgary Real Estate.  A simple way to keep up to date with how the market is trending and ahead of most! All numbers are taken from the Calgary Real Estate Boards Stats package for Realtors. I have also included some general comments which are simply my opinion.

Absorption Rate (Months of Inventory)   (the inventory divided by the number of sales in the last month). What does this mean you might ask?

Buyer’s Market >4.0 Drives prices down
Balanced Market Between 2.4 to 4.0 Prices typically remain stable
Seller’s Market <2.4 Drives prices up

*** Absorption Rate***  

In my opinion this is the most critical number to look at.  All categories except for apartment condos increased slightly this month.  Apartment condos took a small decrease and this is most likely balancing out from last month when it increased substantially.  In summary Detached and Attached homes are doing well while row houses and apartment condos are showing an oversupply of inventory compared to sales.

  July 2016 August  2016 Change
Detached 2.47 2.78 0.30
Semi Detached 2.88 3.60 0.72
Attached – Row 4.43 4.77 0.34
Apartment 6.11 5.88 -0.23
Total City 3.27 3.61 0.34


Calgary Listing Inventory

August inventory levels stayed almost the same as July Levels

Inventory July 2016 August  2016 Change
Detached 2746 2720 -26
Semi Detached 521 497 -24
Attached – Row 886 868 -18
Apartment 1558 1571 13
Total City 5711 5656 -55


Calgary Sales:

Sales in all categories decreased this month which in my opinion is very normal for this time of year with summer holidays and many peoples focusing on getting kids ready to go back to school.

Important note:  Sales from July to August 2015 decreased by 193 or 11.7%  compared to 10.2% this year.

Calgary Sales   July 2016 August  2016 Change % Change
Detached 1110 980 -130 -11.71%
Semi Detached 181 138 -43 -23.76%
Attached – Row 200 182 -18 -9.00%
Apartment 255 267 12 4.71%
Total City 1745 1567 -178 -10.20%


Calgary Real Estate Sales Prices: 

Pricing changes in August were not drastic.  Detached and Semi Detached increased while Attached-Row and Apartment categories decreased with the largest decrease in the Apartment category which is the sector with the highest absorption rate.   I would expect further price declines in the Apartment condo sector.

  Sales Prices July 2016 Benchmark Price    August  2016

Benchmark Price

Change
Detached 502,300 503,200 900
Semi Detached 385,200 387,100 1,900
Attached – Row 310,300 310,000 -300
Apartment 277,000 274,900 -2,100
Total City 440,000 440,200 200


Sales Prices “Year to Date”   

Year to date prices

Sales Prices Dec 31, 2015   Benchmark Price  August 2016 Benchmark Price Change

$

% Change
Detached 514100 503,200 -10,900 -2.12%
Semi Detached 393100 387,100 -6,000 -1.53%
Attached – Row 318500 310,000 -8,500 -2.67%
Apartment 288,000 274,900 -13,100 -4.55%
Total City 452800 440,200 -12,600 -2.78%

Point of Interest

Just my personal opinion but it is important to note that buyers are still acting as if it is a buyer’s market. What I mean here is they are shopping carefully looking for value and taking their time to make decisions.

 Price Sensitivity

It is also important to note that homes in the lower price ranges are still moving much quicker than homes in the higher price ranges.

**Please note that these numbers do change on a community basis and more so for towns.  This report does not include rural properties.  If you would like to find stats on your community just let me know.  If you have any questions about this summary, would like to receive it monthly or Real Estate questions please feel free to contact us.


August 1, 2016 Calgary Real Estate Market Snapshot

Tuesday, August 2nd, 2016

Stay ahead of everyone else by following our Monthly Market Snapshot of the Calgary Real Estate Market This shows what’s really happening! The market is driven by supply and demand so here we show the inventory (supply) and sales (demand) and most importantly the relationship between the two and how it affects the price of Calgary Real Estate.  A simple way to keep up to date with how the market is trending and ahead of most! All numbers are taken from the Calgary Real Estate Boards Stats package for Realtors. I have also included some general comments which are simply my opinion.

Absorption Rate (Months of Inventory)   (the inventory divided by the number of sales in the last month). What does this mean you might ask?

Buyer’s Market >4.0 Drives prices down
Balanced Market Between 2.4 to 4.0 Prices typically remain stable
Seller’s Market <2.4 Drives prices up


*** Absorption Rate***  

In my opinion this is the most critical number to look at.   All categories increased slightly this month except Apartment condos which increased by 1.16.   This is a reverse trend from last month where all categories decreased.   As you can see the apartment condo market is still favouring Buyers the most.

  June 2016 July 2016 Change
Detached 2.28 2.46 0.18
Semi Detached 2.88 2.88 0.01
Attached – Row 3.90 4.45 0.55
Apartment 4.96 6.12 1.16
Total City 2.95 3.27 0.32


Calgary Listing Inventory

July saw a decrease in inventory in all categories except Apartment Condos which increased very slightly.   This decrease is due to less new listings coming to market.


Inventory June 2016 July 2016 Change
Detached 2923 2727 -196
Semi Detached 532 522 -10
Attached – Row 975 882 -93
Apartment 1543 1554 11
Total City 5973 5685 -288


Calgary Sales:

Sales in all categories decreased this month which in my opinion is very normal for this time of year with summer holidays many peoples focus.

Calgary Sales   June 2016 July 2016 Change % Change
Detached 1282 1108 -174 -13.57%
Semi Detached 185 181 -4 -2.16%
Attached – Row 250 198 -52 -20.80%
Apartment 311 254 -57 -18.33%
Total City 2028 1741 -287 -14.15%


Calgary Real Estate Sales Prices: 

Pricing changes in July were minimal with all categories decreasing slightly.  Again apartment condos decreased a little more and this make sense to me with the higher absorption rate.  I would expect further price declines in the Apartment condo sector.

  Sales Prices June  2016

Benchmark Price 

  July 2016

Benchmark Price

Change
Detached 502,400 502,300 -100
Semi Detached 385,600 385,200 -400
Attached – Row 310,800 310,300 -500
Apartment 278,200 277,000 -1,200
Total City 440,400 440,000 -400


 Sales Prices “Year to Date”   

Year to date prices

Sales Prices Dec 31, 2015   Benchmark Price  July  2016

Benchmark Price

Change

$

% Change
Detached 514100 502,300 -11,800 -2.30%
Semi Detached 393100 385,200 -7,900 -2.01%
Attached – Row 318500 310,300 -8,200 -2.57%
Apartment 288,000 277,000 -11,000 -3.82%
Total City 452800 440,000 -12,800 -2.83%


Price Sensitivity

It is also important to note that homes in the lower price ranges are still moving much quicker than homes in the higher price ranges.

**Please note that these numbers do change on a community basis and more so for towns.  This report does not include rural properties.  If you would like to find stats on your community just let me know.  If you have any questions about this summary or Real Estate questions please feel free to contact us.


May 1, 2016 Calgary Real Estate Market Snapshot

Tuesday, May 3rd, 2016

Newsflash – Detached homes enter into a sellers market.

Stay ahead of everyone else by following our Monthly Market Snapshot of the Calgary Real Estate Market. This shows what’s really happening! The market is driven by supply and demand so here we show the inventory (supply) and sales (demand) and most importantly the relationship between the two and how it affects the price of Calgary Real Estate.  A simple way to keep up to date and ahead of most! All numbers are taken from the Calgary Real Estate Boards Stats package for Realtors.

Absorption Rate (Months of Inventory)   (the inventory divided by the number of sales in the last month). What does this mean you might ask?

Buyer’s Market

>4.0 Drives prices down
Balanced Market Between 2.8 to 4.0 Prices typically remain stable
Seller’s Market <2.8 Drives prices up

Before we get into this month’s report (for followers) it is important to note that the Calgary Real Estate Board made changes to categories again and this time for the better.  In past they used Attached Homes and now they have broken this into two categories –Semi Detached & Row (Townhouses). This makes more sense to me as they are quite different markets.

*** Absorption Rate***  

In my opinion this is the most critical number to look at.  Detached homes are now back in a seller’s market. Three months in a row the absorption rates have been on a steady decrease.  If you are someone sitting on the fence to see if prices will go down more my suggestion is to get off the fence especially if you are looking for a detached home.

  Mar  2016 April  2016 Change
Detached 3.08 2.76 -0.32
Semi Detached 4.04 3.42 -0.62
Attached – Row 4.87 5.05 0.18
Apartment 6.00 5.85 -0.15
Total City 3.85 3.54 -0.31

 Calgary Listing Inventory

April saw an increase in inventory in all categories and this is very typical for April.

Inventory Mar  2016 April  2016 Change
Detached 3094 3127 33
Semi Detached 582 595 13
Attached – Row 896 930 34
Apartment 1535 1590 55
Total City 6107 6242 135

Calgary Sales:

Sales in all categories increased again this month.  This is very typical for a spring market.  It is important to note that Sales are still down from normal levels but are increasing.

Calgary Sales   Mar  2016 April  2016 Change % Change
Detached 1004 1134 130 12.95%
Semi Detached 144 174 30 20.83%
Attached – Row 184 184 0 0.00%
Apartment 256 272 16 6.25%
Total City 1588 1764 176 11.08%


Calgary Real Estate Sales Prices: 

Interesting that all categories decreased in prices.  In my opinion, I believe it is simply because buyers and sellers are not aware of how the market has shifted direction and everyone is still acting like it’s a buyer’s market.  Buyers are bringing low offers, and sellers are happy just to get an offer and are willing to settle a little lower.

  Sales Prices March   2016

Benchmark Price 

April  2016

Benchmark Price

Change
Detached 502400 501500 -900
Semi Detached 385600 383600 -2000
Attached – Row 318500 314800 -3700
Apartment 281300 280400 -900
Total City 442800 441000 -1800


 Sales Prices “Year to Date”   

Year to date prices

Sales Prices Dec 31, 2015   Benchmark Price  April  2016

Benchmark Price

Change

$

% Change
Detached 514100 501500 -12600 -2.45%
Semi Detached 393100 383600 -9500 -2.42%
Attached – Row 318500 314800 -3700 -1.16%
Apartment 288000 280,400 -7,600 -2.64%
Total City 452800 441000 -11800 -2.61%


Price Sensitivity

It is also important to note that homes in the lower price ranges are still moving much quicker than homes in the higher price ranges.

**Please note that these numbers do change on a community basis and more so for towns.  This report does not include rural properties.  If you would like to find stats on your community just let me know.  If you have any questions about this summary or Real Estate questions please feel free to contact us.