What is really happening in the Calgary Real Estate Market?
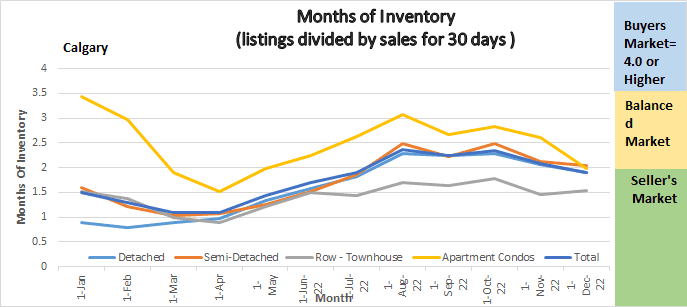
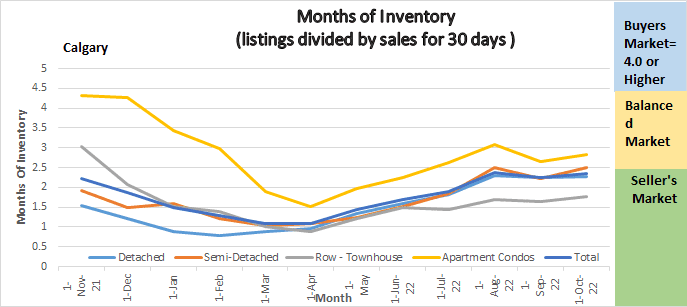
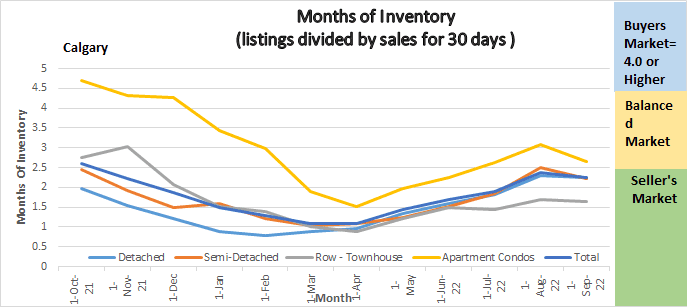
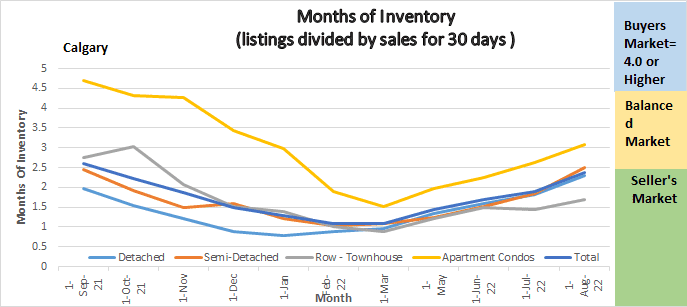
Following is a graph that shows the months of inventory for each housing sector. Looking at a one-year trendline gives you an indication of where things are really heading.
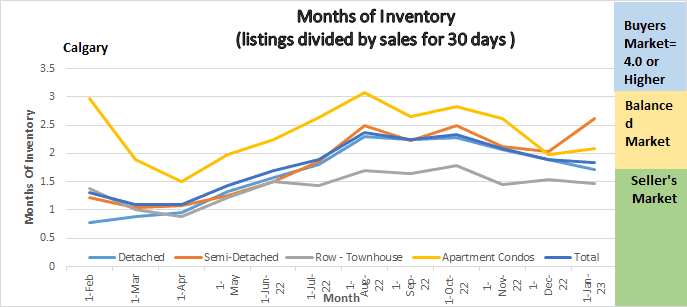
Graph shows the months of inventory for all sectors in the Calgary Real Estate Market. Also show for each sector it that sector is in a Buyers, Sellers or Balanced Market position.
Gord’s commentary for the month (just my opinion).
December 2022 Highlights
The Calgary Market continues to stay strong!
- Our Inventory continues to decline, and we are well below normal levels of listings
- Sales declined but not as much as Inventory
- Months of Inventory declined again
2022 Summary at a Glance
The first half of the year sales were sky high and tapered off in the last half of the year.
- Sales reached a record high in 2022 with 29,672 sales
- As of January 1, there were 2214 listings on the market – the lowest level of Inventory for December in over a decade.
- Calgary continues to report activity that is better than levels seen before the pandemic and higher than long term trends.
- Benchmark Prices eased to $518,000 in December down 5% from the peak in May but are still almost 8% higher than December last year.
Calgary Listing Inventory
Listing Inventory declined again this month. In all sectors combined we are down 28.79% in listings from December 1st. While declining numbers of listings are normal for this time of year this is a steeper decline than what I would like to see. Although this is good for sellers, I think this could be another tough year for buyers.
Calgary Sales:
All sectors saw a decrease of sales in December, overall sectors the decline was 26.94% putting the decline of sales less than the decline of inventory (listings).
Sales Compared to 2021:
It is also important to look at sales compared to the Previous year. Sales for December were down 30.61% when compared to last December of 2021. Although this looks like a substantial number, we also need to consider that last December is when things in the Calgary Real Estate Market started getting heated so not meeting last years sales does not concern me at all. Overall sales in December were still above the long-term average.
| Jan | Feb | Mar | Apr | May | June | July | |
| 2021 | 1207 | 1831 | 2903 | 3204 | 2981 | 2914 | 2314 |
| 2022 | 2009 | 3305 | 4107 | 3401 | 3071 | 2842 | 2254 |
| Change | + 802 | 1474 | +1204 | +197 | 90 | -72 | -60 |
| % Change | + 66.4% | +180.5% | +141.5% | +1.06 | +1.03% | 2.5% | 2.7% |
| Aug | Sept | Oct | Nov | Dec | |
| 2021 | 2146 | 2157 | 2184 | 2108 | 1735 |
| 2022 | 2136 | 1901 | 1857 | 1648 | 1204 |
| Change | -10 | -256 | -327 | -460 | -531 |
| % Change | -.5% | -11.9% | -17.6% | -21.8% | 30.61% |
Calgary Real Estate Benchmark Sales Prices:
The benchmark price for all sectors combined declined by $1,400 in December. All sectors saw a decline except the Semi-Detached Sector that increased by $200.
Calgary Real Estate Benchmark Year to Date Sales Price: See chart below.
Year to date the Calgary Benchmark Price increased by 7.81% in 2022. All the increases were between 7.8% to 9.8% except the Attached Row Sector which increased by 14.36%. See stats below for sector breakdowns.
Current Months of Inventory (Absorption Rate):
The Detached and Attached Row houses both saw a small decline in the months of inventory.
The apartment condo market saw a slight increase of .11 while the Semi-Detached market saw a significant increase of .58 months of Inventory.
What might the first quarter of 2023 bring: (again just my opinion)
Based on what I am seeing, I believe that for the first half of the year we will continue to see a low inventory of listings. This is going to push sales numbers down as buyers are just not finding what they are looking for so are waiting. Depending what the Federal bank does with interest rates, but I speculate that we will see another 1 or 2 increases in the interest rate which will put more downward pressure on demand.
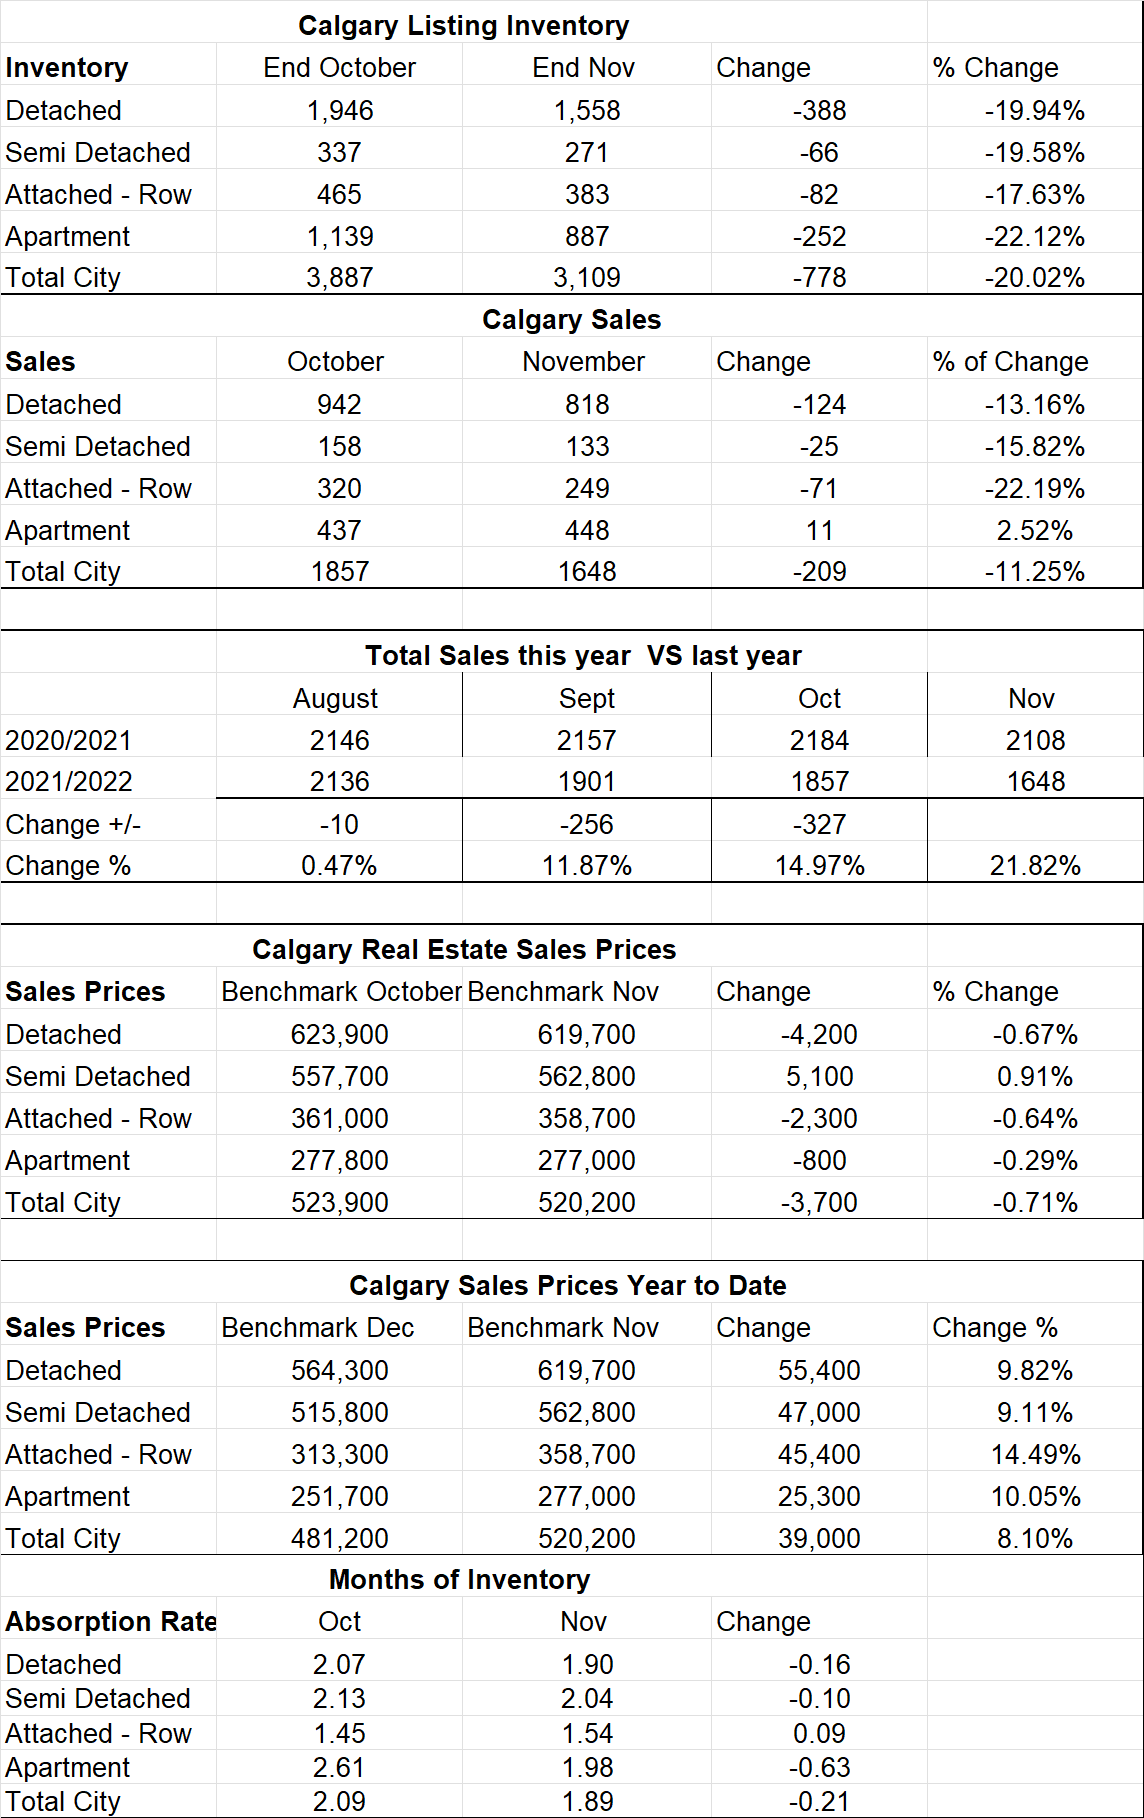
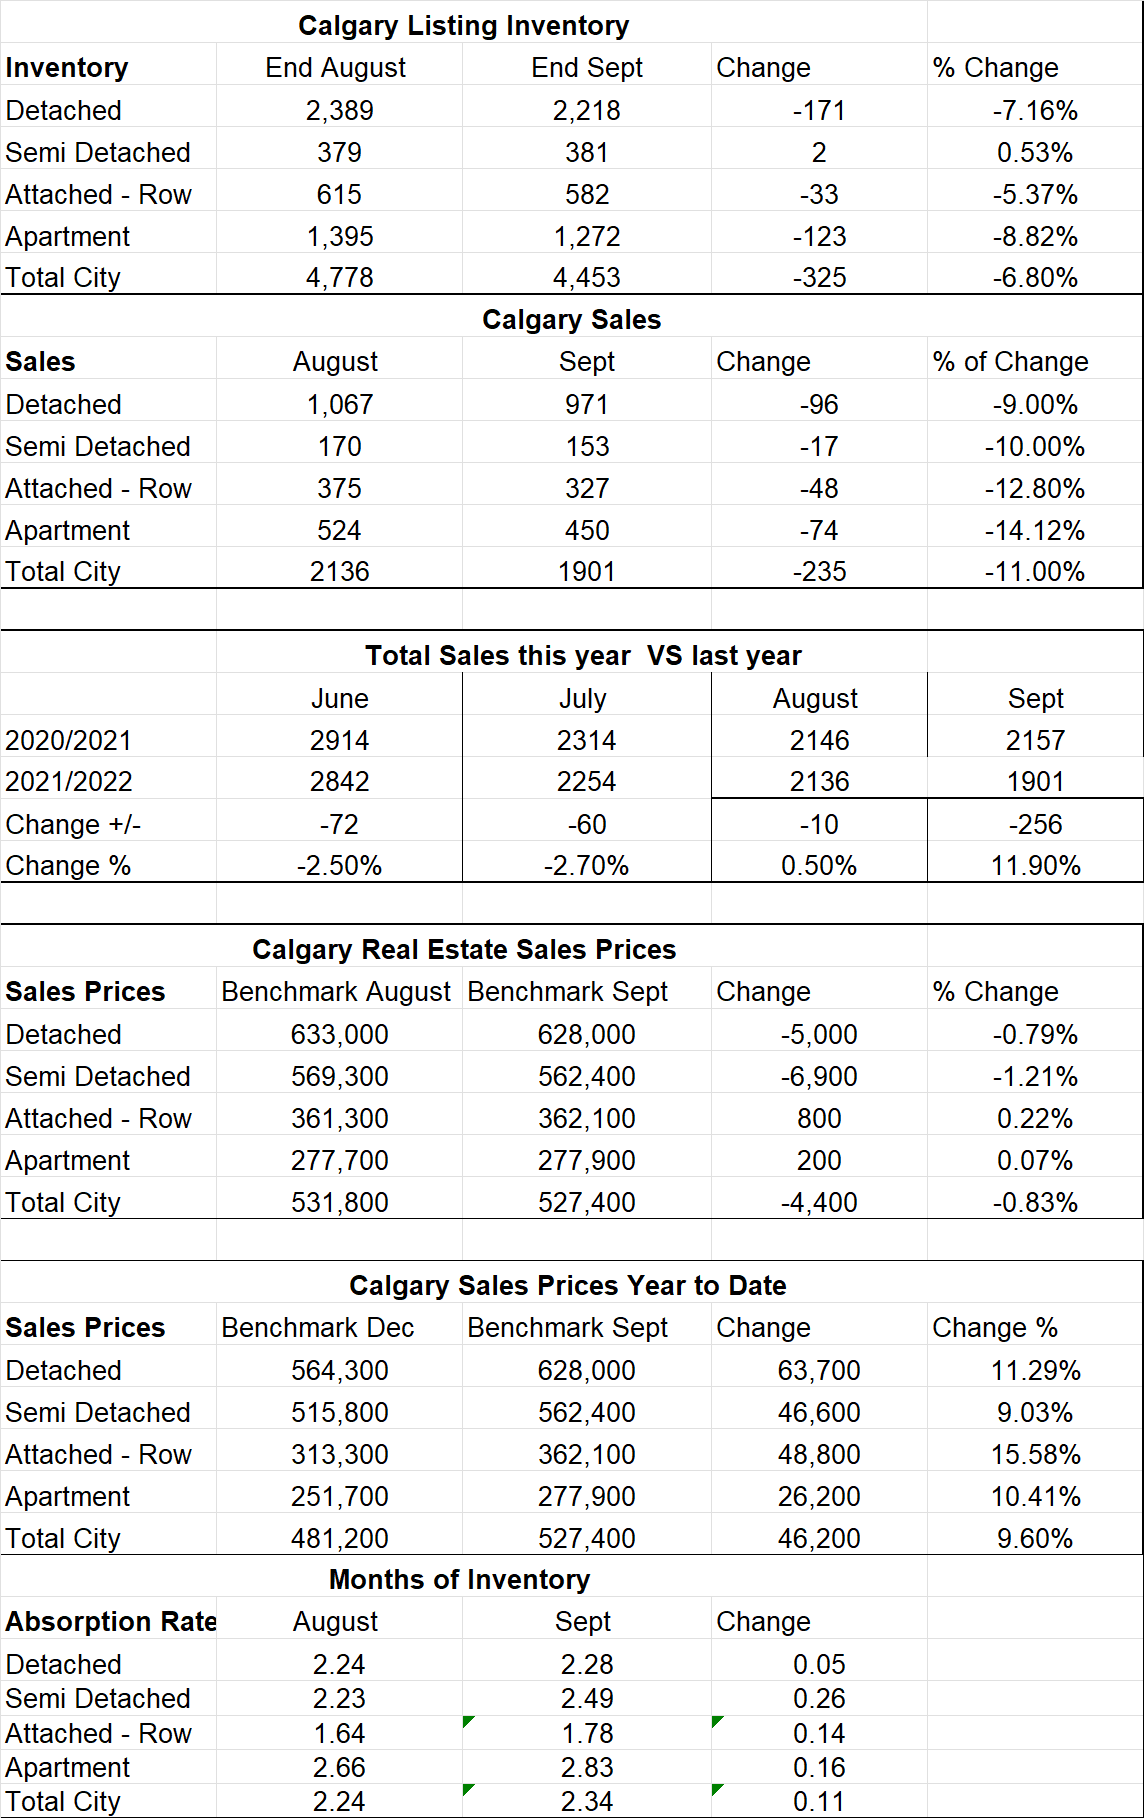
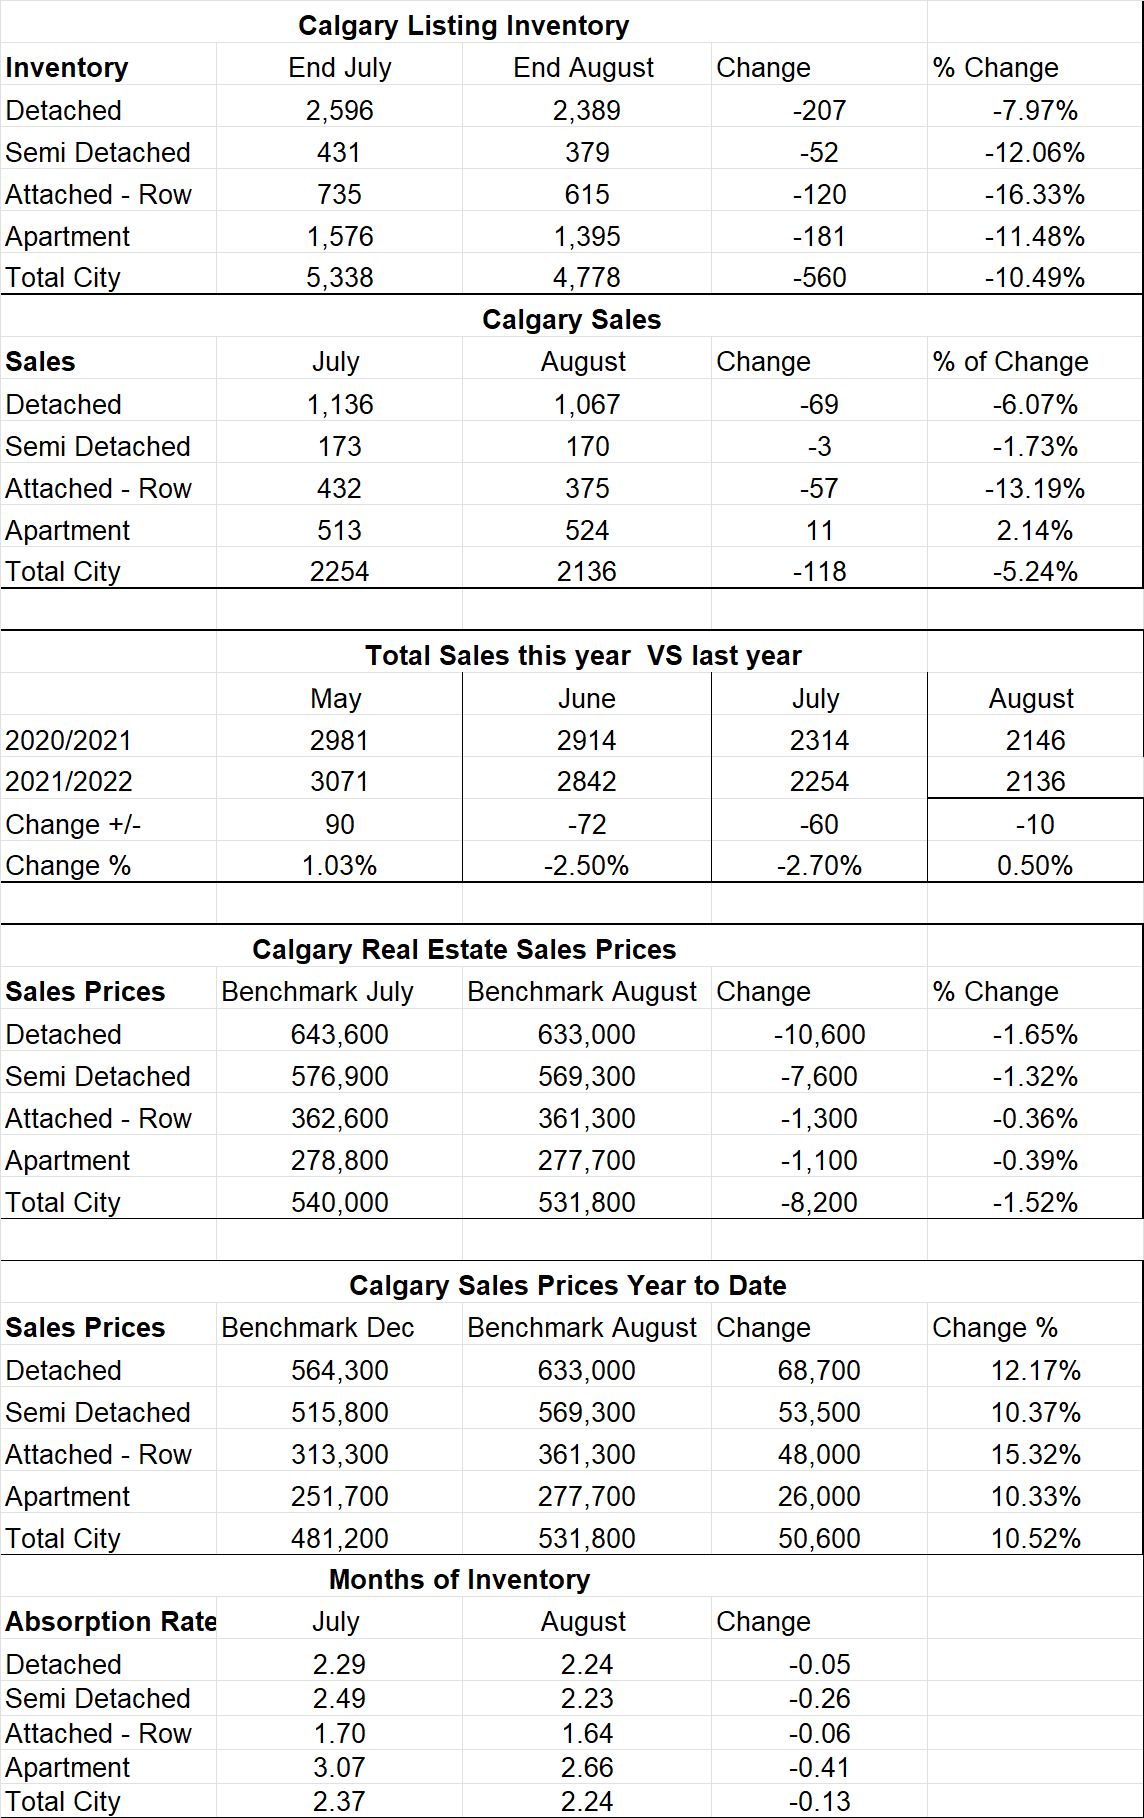
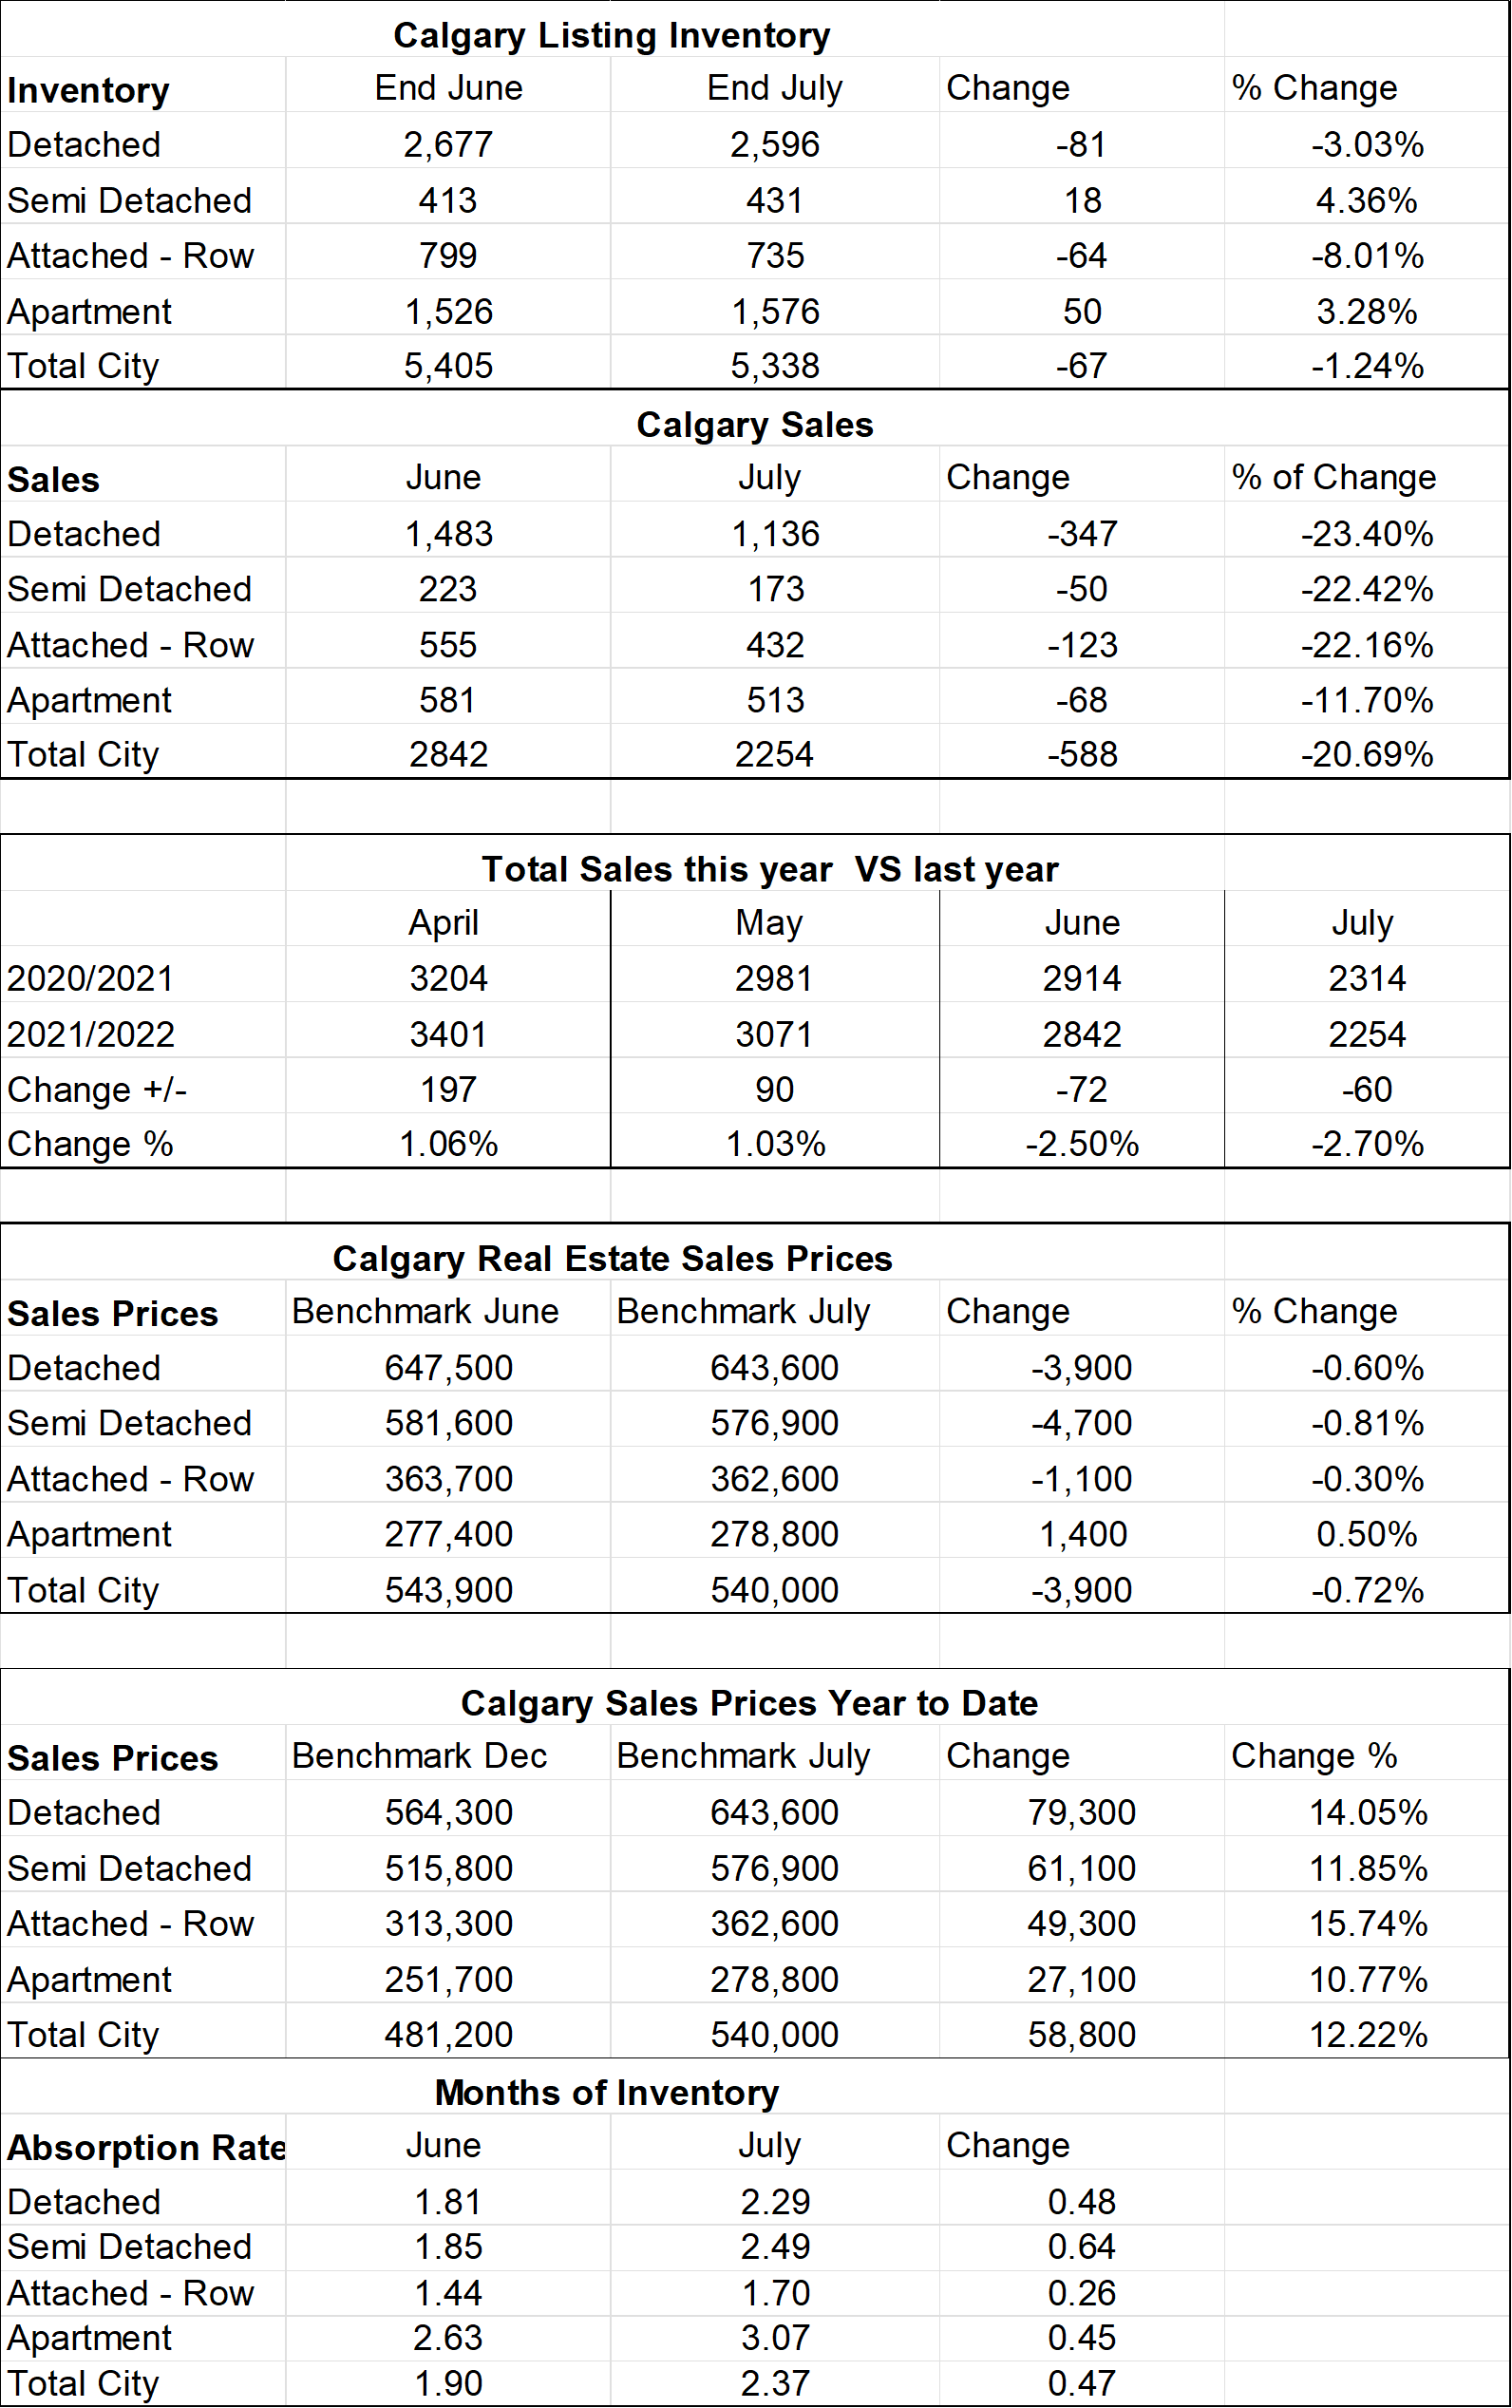
Below is a summary of numbers in chart form. All numbers are taken from the Calgary Real Estate Boards monthly Stats package.
All numbers vary by community and price ranges, if you would like stat specifically for your neighborhood, please contact us.
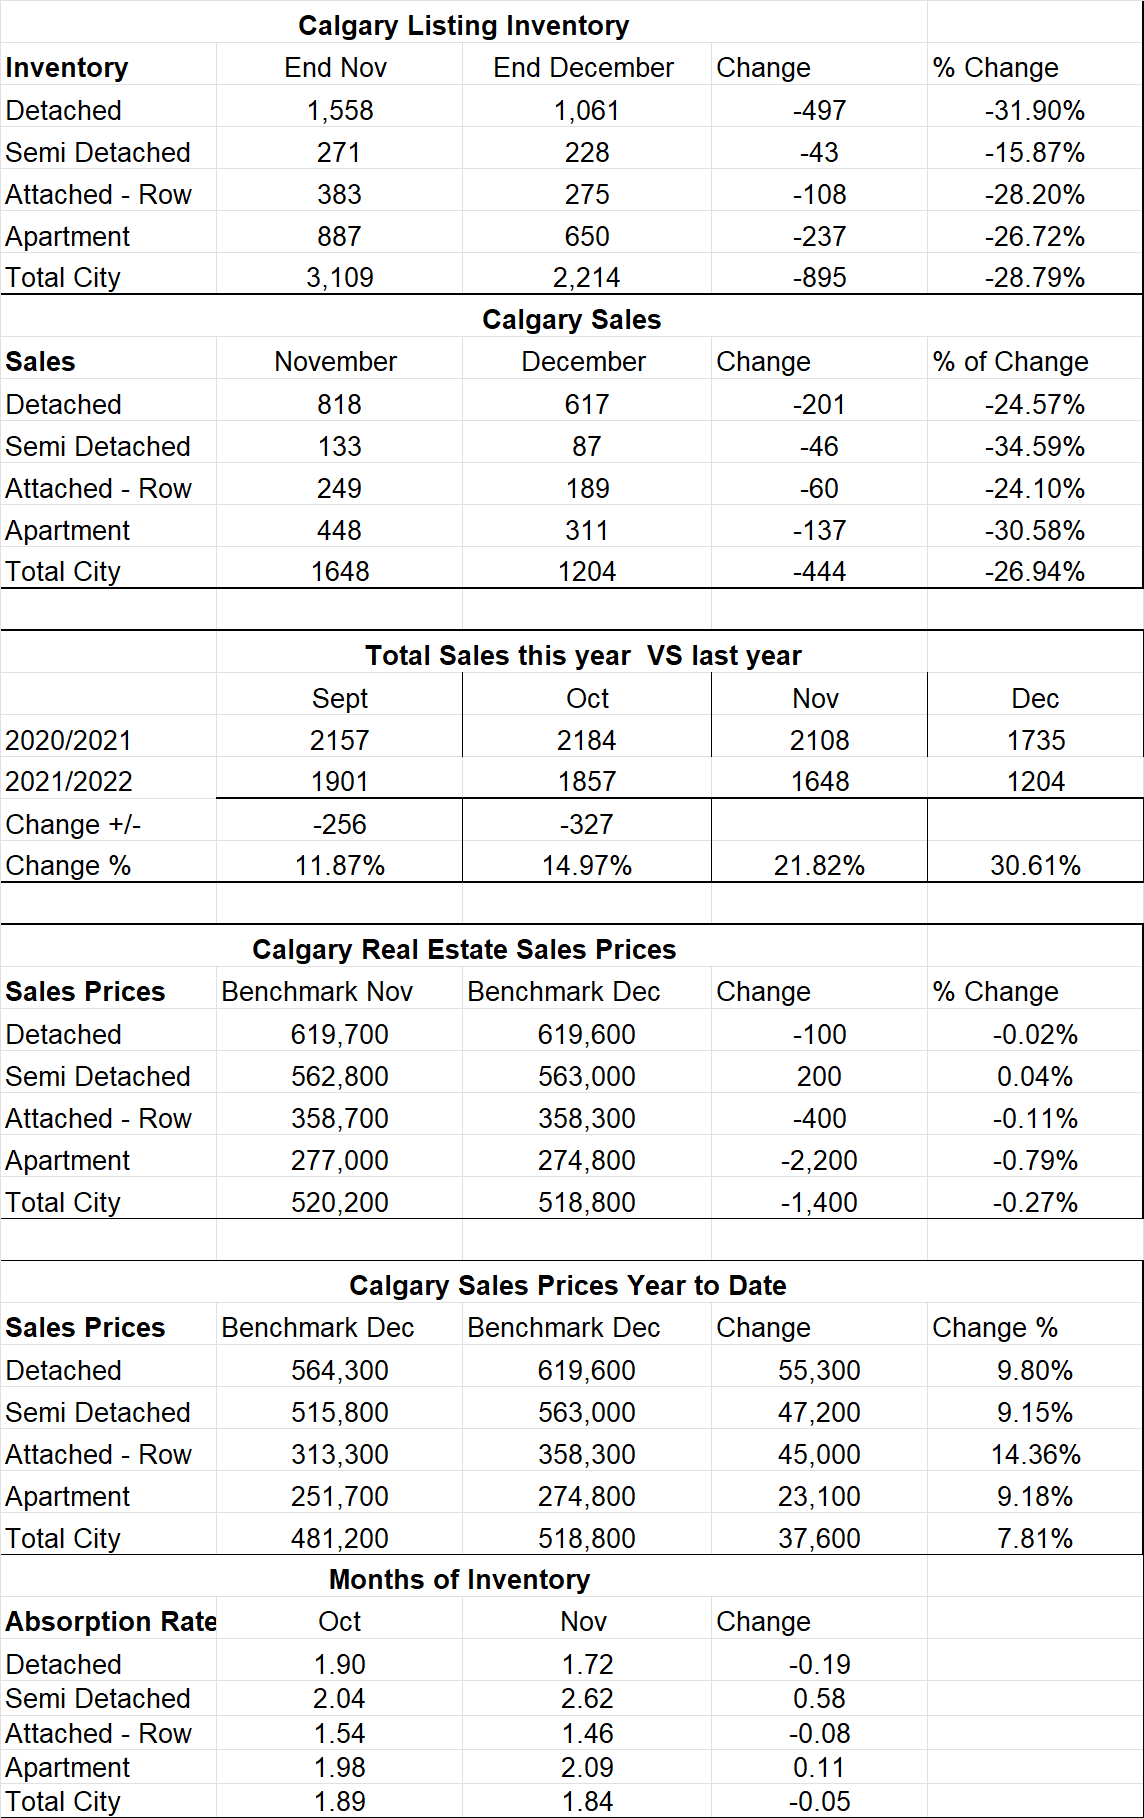
Shows the number of listings, sales, Benchmark Price and Months of Inventory for all sectors of the Calgary Real Estate Market for the last 2 months along with the change. Numbers are taken from the Calgary Real Estate Board Realtors Stats package.