Posts Tagged ‘Calgary Condo Prices’

Calgary Real Estate Market Snapshot for March 2021

Friday, April 2nd, 2021

What is really happening in the Calgary Real Estate Market?

The market is a result of Supply and Demand therefore we look at both Supply (inventory) and Demand (Sales) and the relationship between the two.  We also update you on the current benchmark price for all housing sectors.

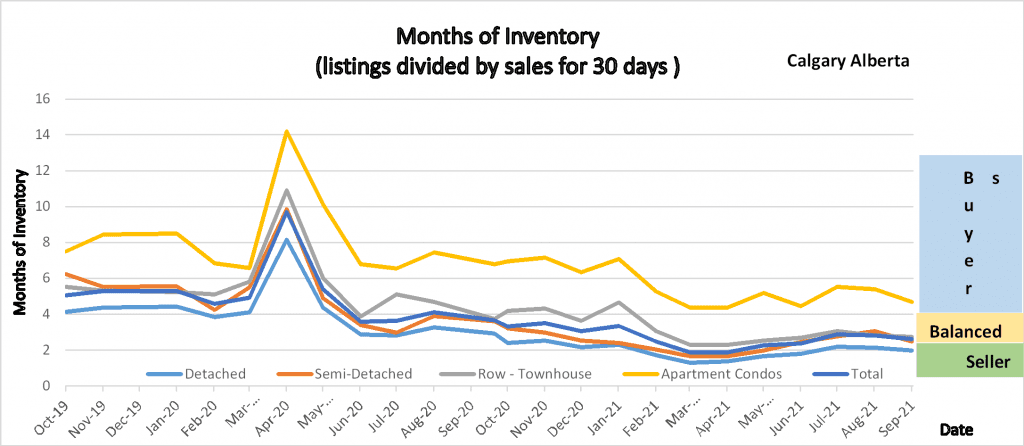
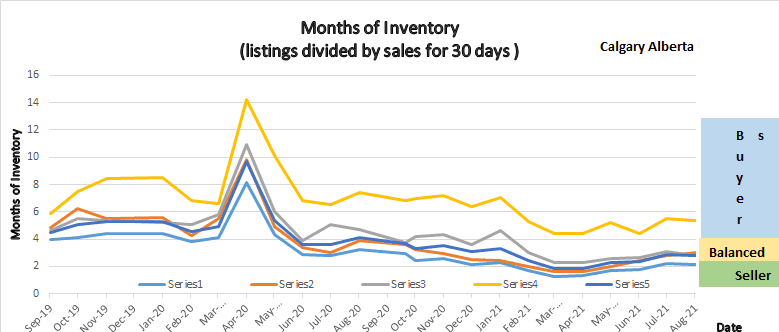
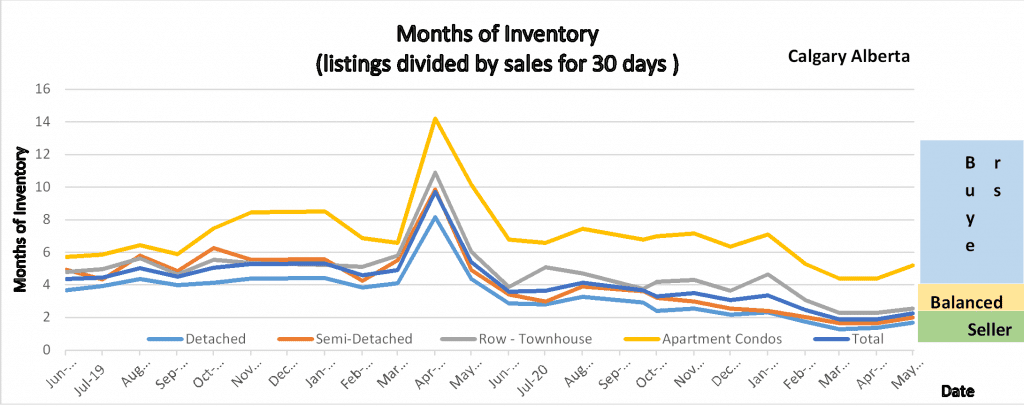
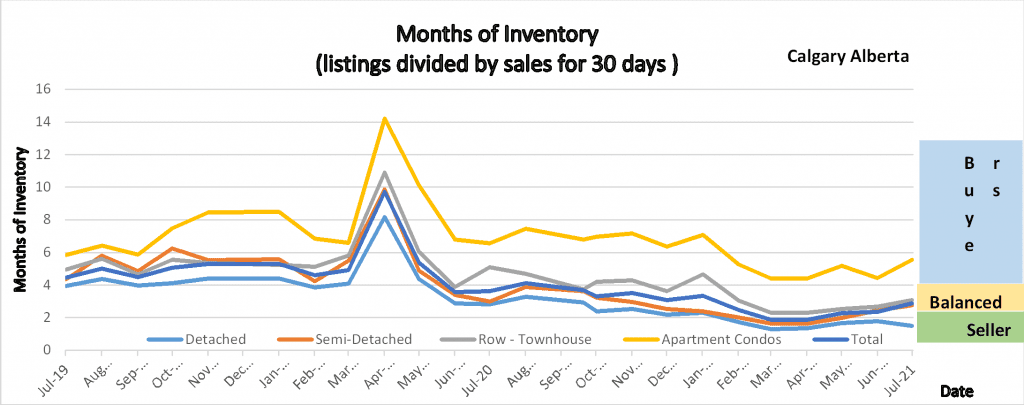
Following is a graph that shows the months of inventory for each housing sector.  Looking at a 2-year trendline gives you an indication of where things are really heading.  As you can see at a glance all sectors except apartment condos are in a Seller’s market position.
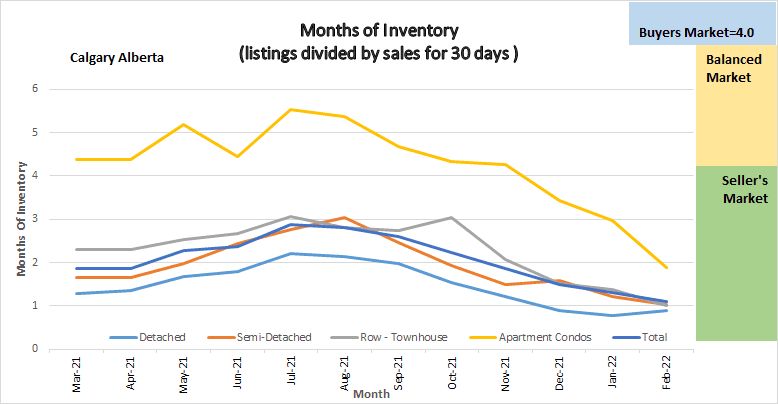
2 Year Trendline

Gord’s commentary for the month (just my opinion).

The Calgary Real Estate Market continues to outpace last month and last year by hugh numbers.  Up until March the sales increases were mostly in the detached sector but that is now creeping into other sectors as well.

Following are just my thoughts on the why:

  1. Low-Interest Rates According to Rate Hub a 5-year mortgage can be had at 1.74% – Crazy Low.
  2. According to data from ATB the Job losses have been in the lower wage groups. Higher wage jobs are in positive territory compared to a year ago.
  3. There has recently been some positive news in the Oil & Gas Sector.
  4. With Vaccine’s coming there is a little more of a positive vibe out there.

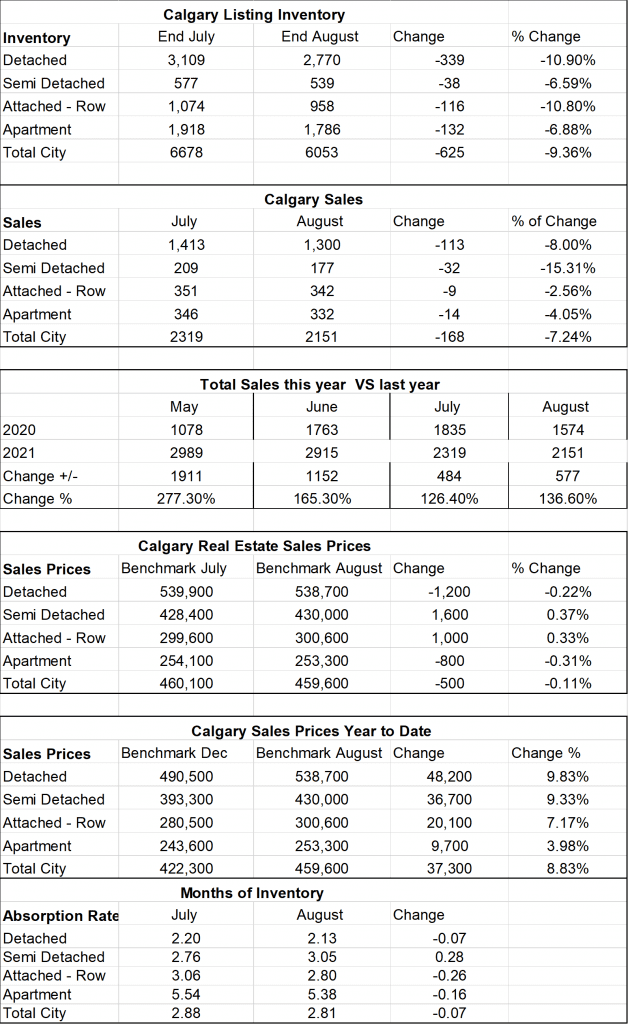
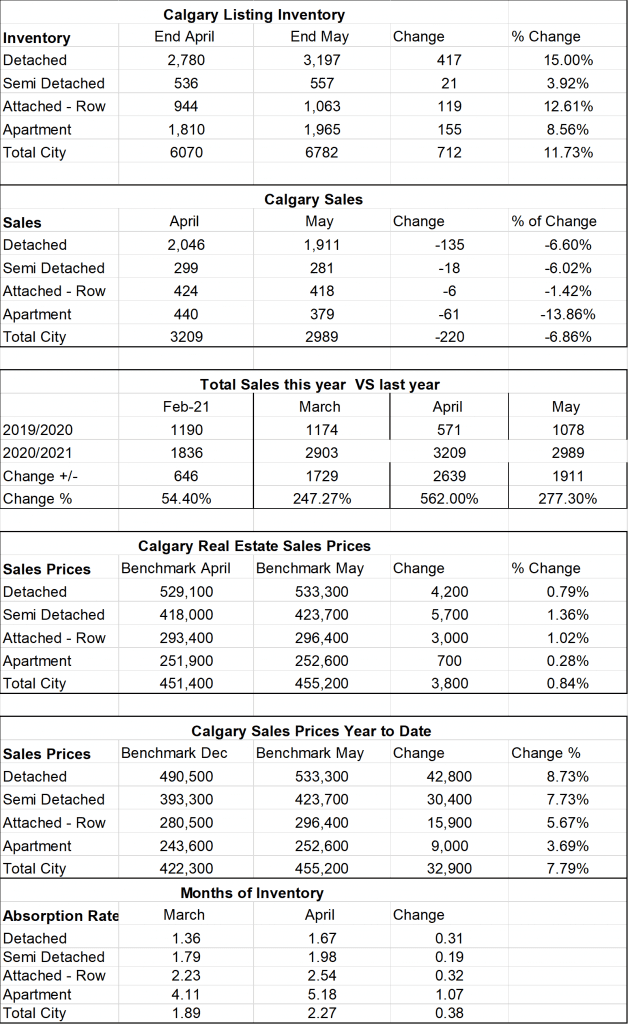
Calgary Listing Inventory

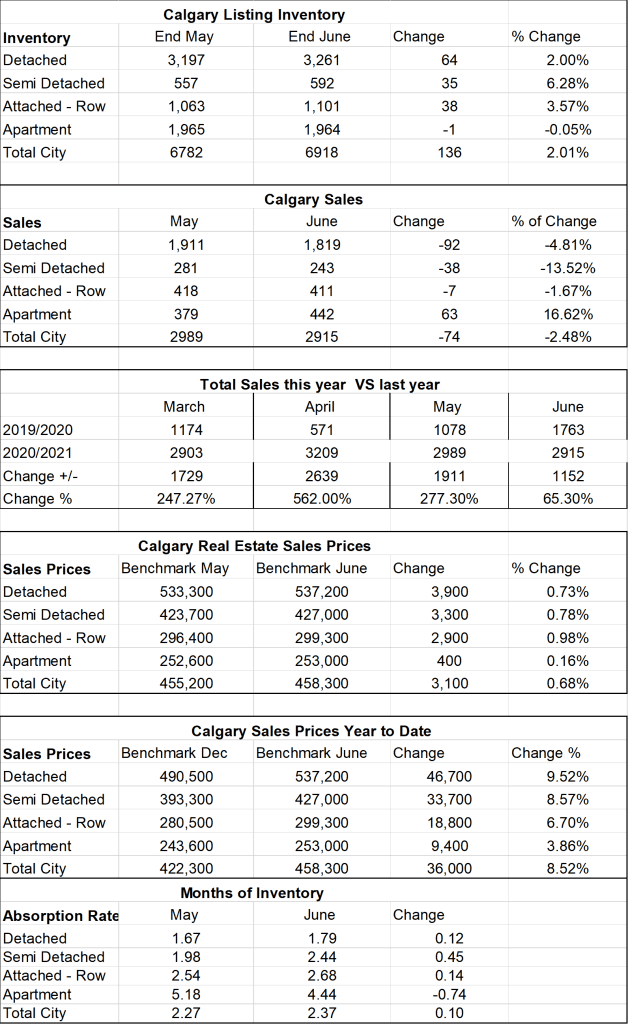
In March we saw the inventory for homes in all sectors increase marginally.

Calgary Sales:

Calgary Sales were the highest they have been since 2007.  When compared to last month all sectors were up with detached homes leading the way at 66.16% increase.  Semi-detached was 48.62%, Attached Row was 47.31% and Apartment Condos trailed at a 41.54%increase – which is still huge.

 Sales Compared to 2020:

This is where it gets interesting.  As you can see sales in March 2021 beat sales in March 2020 by 247.3%

Of course, we have to keep in mind that March 2020 we just started to see sales decreased due to covid.


  Jan Feb Mar Apr May June July Aug Sept Oct Nov Dec
2020 861 1190 1175 573 1080 1747 1835 80 1702 1764 1437 1199
2021 1208 1836 2903                  
Change +347 +646 +1729                  
% change +7.49 +54.4 247.3%                  


Calgary Real Estate Benchmark Sales Prices:

Overall, the Benchmark Price for all sectors increased by $10,800.  Detached homes increased by $13,800 (the largest) and the smallest which was Apartment Condos which still increased by $3,501.  Detached homes year to date increased by 25,800 or 5.26%


Current Months of Inventory (Absorption Rate): 

This is the key number, which determines what type of market we are currently in.

The months of inventory decreased in all housing sectors.   From the smallest to largest decrease the change was:

Semi-Detached   -.37   Sellers Market Territory

Detached – .42   Continues to be in Sellers Market Territory

Attached Row: -.76  Now in Sellers Market territory at 2.29 Months of Inventory

Apartment:  – .89  Still in Buyer’s market territory


With the months of Inventory where they are, I can only predict that prices will continue to increase with possibly the exception of Apartment Condos.

It is also important to note that these numbers vary by community, and by price range.  If you would like numbers for your community, or more specific numbers for your home please contact us.

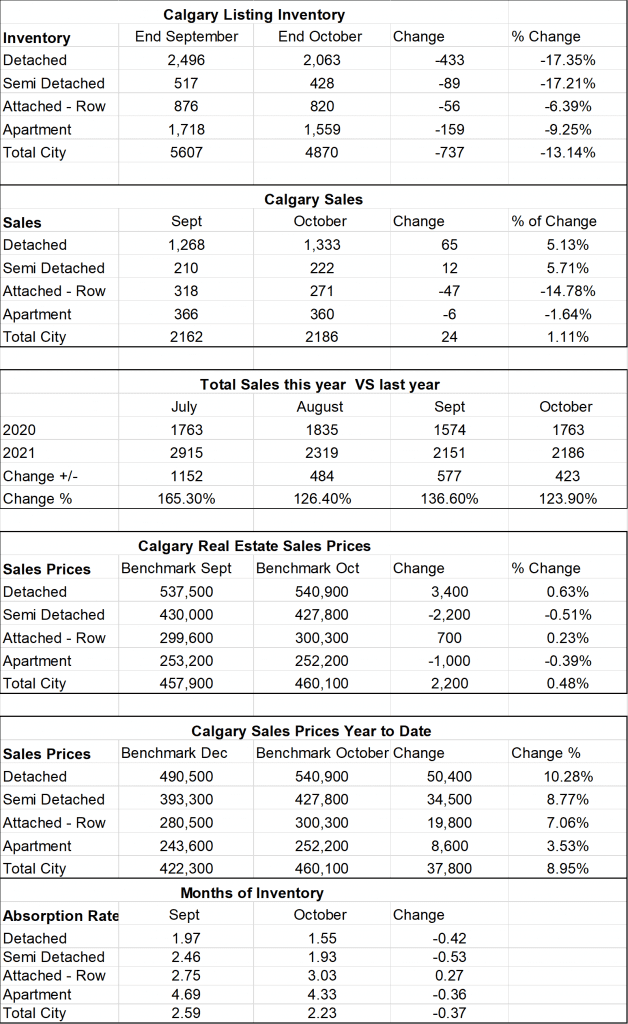
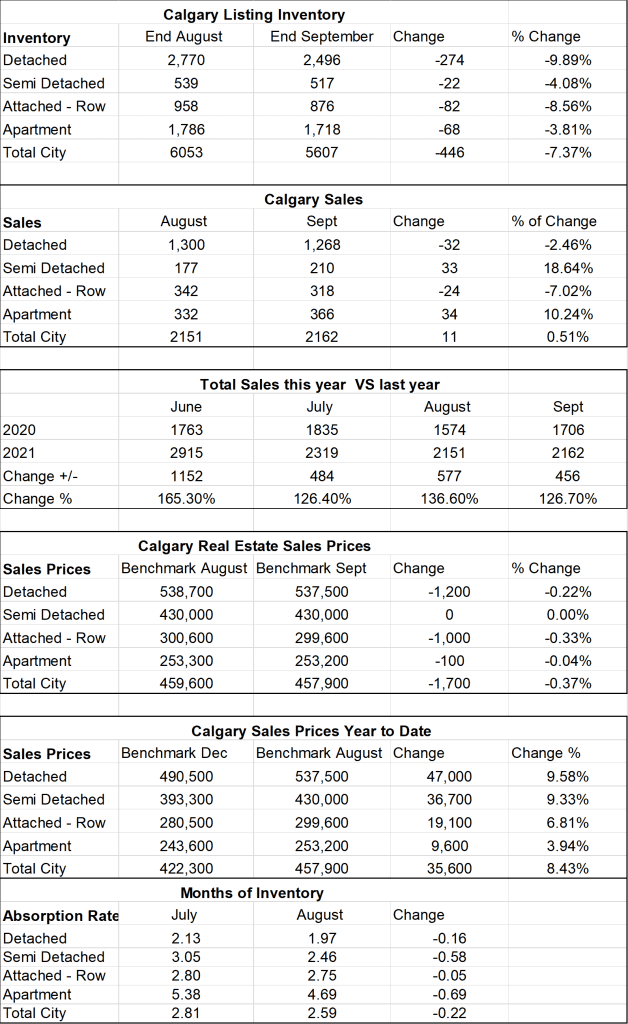
Below is a summary of numbers in chart form.  All numbers are taken from the Calgary Real Estate Boars monthly Stats package.
All numbers are taken from the Calgary Real Estate Boards monthly Stats package for Realtors.

Calgary Real Estate Market Snapshot for Feburary 2021

Monday, March 1st, 2021

 What is really happening in the Calgary Real Estate Market?

The market is a result of Supply and Demand therefore we look at both Supply (inventory) and Demand (Sales) and the relationship between the two.  We also update you on the current benchmark price for all housing sectors.

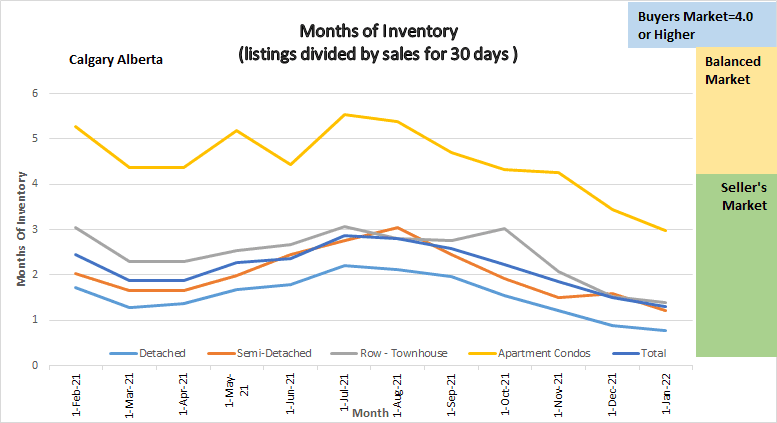
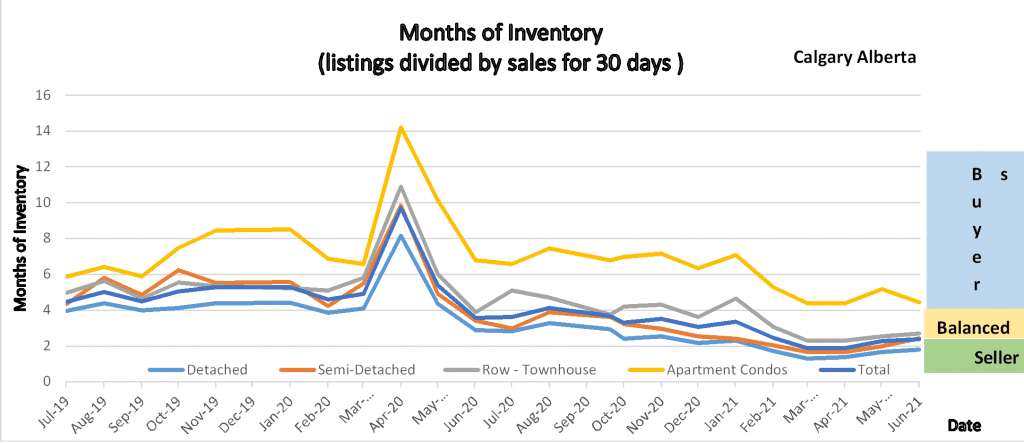
Following is a graph that shows the months of inventory for each housing sector.  Looking at a 2-year trendline gives you an indication of where things are really heading.

2 year trend of Months of Inventory for the Calgary Real Estate market for all Housing Sectors.

2 year trend of Months of Inventory for the Calgary Real Estate market for all Housing Sectors.

Gord’s commentary for the month (just my opinion).

With Detached homes setting the pace the Calgary Real Estate Market is seeing sales numbers we have not seen since 2014.  I have had a lot of people ask the question WHY?

Following are just my thoughts on the why:

  1. Low-Interest Rates According to Rate Hub a 5-year mortgage can be had at 1.64% – Crazy Low.
  2. According to data from ATB the Job losses Alberta has seen have been in the lower wage groups. Higher wage jobs are in positive territory compared to a year ago.
  3. There has recently been some positive news in the Oil & Gas Sector.
  4. With Vaccine’s coming there is a little more of a positive vibe out there.

Calgary Listing Inventory

We saw an increase in all Sectors in listing inventory.  This is very normal and as we approach spring the listing inventory will continue to rise.

Calgary Sales:

Calgary Sales were the highest they have been since 2014. The highest increases were in

Attached Rowhomes: 73.33% increase over last February.

Detached homes 53.63% increase over last February.

Apartment Condo:  46.24% Increase over last February

Sales Compared to 2020:

This is where it gets interesting.  As you can see sales in February 2021 beat sales in February 2020 by 54.4%


  Jan Feb Mar Apr May June July Aug Sept Oct Nov Dec
2020 861 1190 1175 573 1080 1747 1835 80 1702 1764 1437 1199
2021 1208 1836                    
Change +347 +646                    
% change +7.49 +54.4                    


 Calgary Real Estate Benchmark Sales Prices:

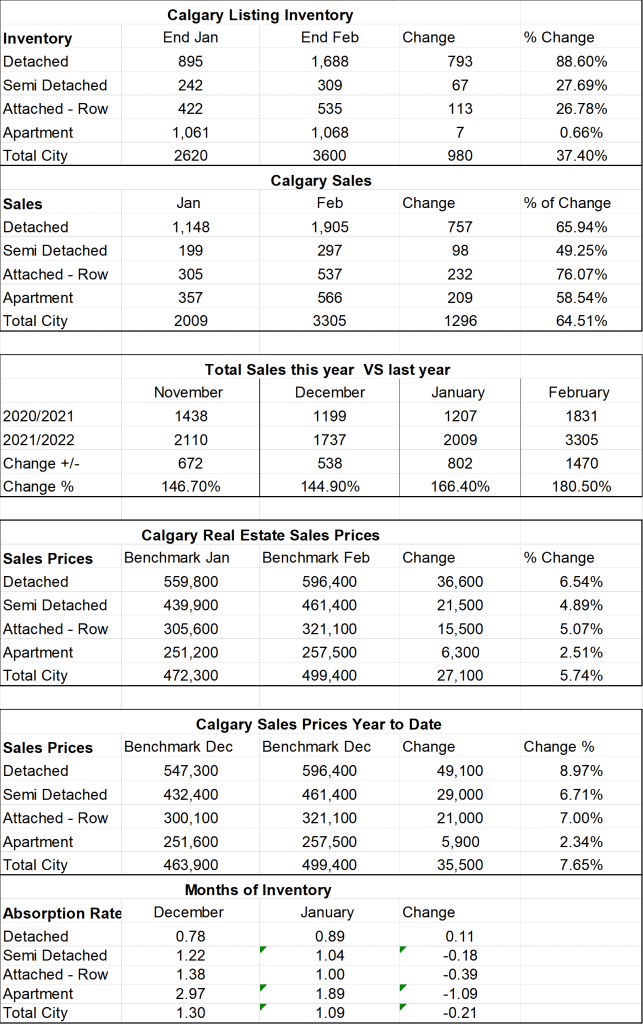
Overall, the Benchmark Price for all sectors increased by $8,800.  Detached homes increased by $12,000 (the largest) and the smallest which was Apartment Condos which still increased by $2,899.

 Current Months of Inventory (Absorption Rate): 

The months of inventory decreased in all housing sectors.   From the smallest to largest decrease the change was:

Semi-Detached   -.38 Now in Seller Market Territory

Detached -.59   Now in Seller Market Territory

Attached Row: -1.6 Now in Balanced market territory.

Apartment:  – 1.81 Still in Buyer’s market territory

Sales compared to last February are up by 54.4% so even though inventory is rising the increase in sales is much higher than the increase in listings pushing us to lower months of inventory and into a seller’s market for some sectors.

 It is also important to note that these numbers vary by community, and by price range.  If you would like numbers for your community contact us.

Below is a summary of numbers in chart form.  All numbers are taken from the Calgary Real Estate Boars monthly Stats package.
Stats from the Calgary Real Estate Board's Monthly Stats package for February 2021

Stats from the Calgary Real Estate Board’s Monthly Stats package for February 2021

Calgary Real Estate Market Snapshot Feb 1, 2021

Monday, February 1st, 2021

What is really happening in the Calgary Real Estate Market?

The market is a result of Supply and Demand therefore we look at both Supply (inventory) and Demand (Sales) and the relationship between the two.  We also update you on the current benchmark price for all housing sectors.

Following is a graph that shows the months of inventory for each housing sector.  Looking at a 2-year trendline gives you an indication of where things are really heading. On the right it indicates if we are in a sellers or buyers market in that sector.

Graph shows 2 years on Months of Inventory for all sectors within the Calgary Real Estate Market.


Gord’s commentary for the month (just my opinion).

Calgary had another very busy month in the Real Estate world.  It feels like we are in the spring market already. Sales of detached homes, especially in the lower price ranges are booming and we are seeing multiple offers. Currently in the single-family home sector what is holding people back from buying is the lack of inventory so they cannot find what they want.

 COVID-19: Even though we are in a similar lockdown situation as we were in March there does not seem to be the same result in the market falling.  I believe that the public is now aware of the many protocols Realtor’s have put in place to keep both Buyers and Sellers safe. On top of that, I believe people are seeing that there is a light at the end of the tunnel with the recent Vaccine announcements.

Calgary Listing Inventory

Every housing sector saw an increase in Inventory, and this is to be expectedin January.  In November/December people often hold off for the holiday season and are now listing.

Calgary Sales:

Overall Calgary sales increased in January over December but only by a small margin. The only sector that saw a decrease was the Attached-Row Sector and sales were only down by 19.

Sales Compared to 2020:

This is where it gets interesting.  January saw 347 more sales than in January of 2020.  This makes me believe that there is still a pent-up demand and with the interest rate so low we are going to see some higher numbers this year than we have seen in a while.


  Jan Feb Mar Apr May June July Aug Sept Oct Nov Dec
2020 861 1195 1175 573 1080 1747 1835 80 1702 1764 1437 1199
2021 1208
Change +347
% change +7.49


 Calgary Real Estate Benchmark Sales Prices:

Overall, the Benchmark Price for all sectors increased by $1500.   All sectors showed an increase except Semi-Detached which showed a small decrease of 2,000.


Current Months of Inventory (Absorption Rate): 

The months of Inventory increased marginally in all Sectors except the Semi-Detached sector where months of inventory declined by .13.

Detached homes at 2.17 put us solidly into a seller’s market.

Semi-Detached is at 2.53 so borderline between Sellers and Balanced market position.

Attached Row and Apartment sectors are both in Buyer’s Market positions with 4.65 and 7.08 Months of Inventory respectively.

It is also important to note that these numbers vary by community, and by price range.  If you would like numbers for your community contact us.

Below is a summary of numbers in chart form.  All numbers are taken from the Calgary Real Estate Boars monthly Stats package.
 

CREB Stats for January of 2021


Calgary Real Estate Market Snapshot: Jan 2021

Monday, January 4th, 2021

 What is really happening in the Calgary Real Estate Market?

The market is simply a result of Supply and Demand therefore we look at both Supply (inventory) and Demand (Sales) and the relationship between the two.  We also update you on the current benchmark price for all housing sectors.

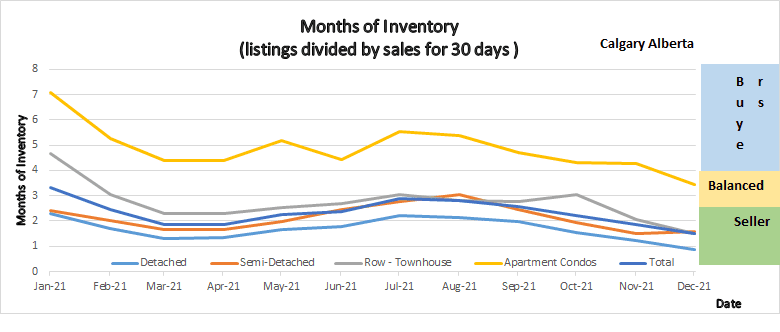
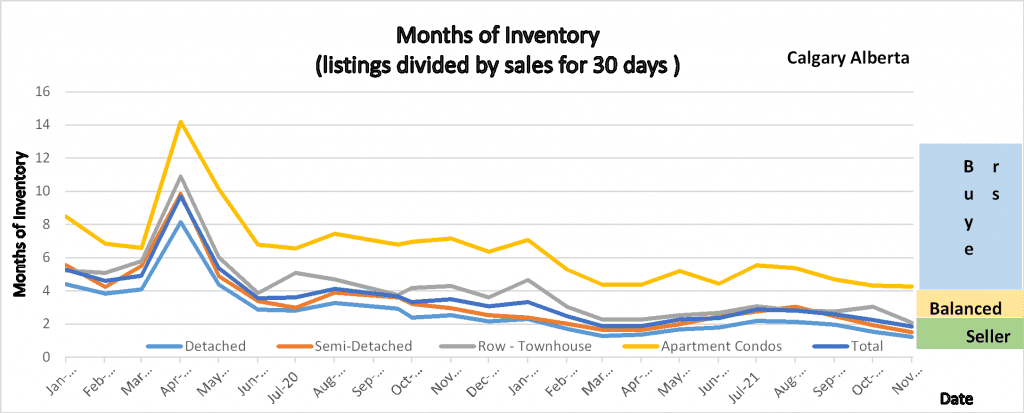
Following is a graph that shows the months of inventory for each housing sector.  Looking at a 2-year trendline gives you and indication of where things are really heading.

Months of Listing Inventory

Months of Listing Inventory


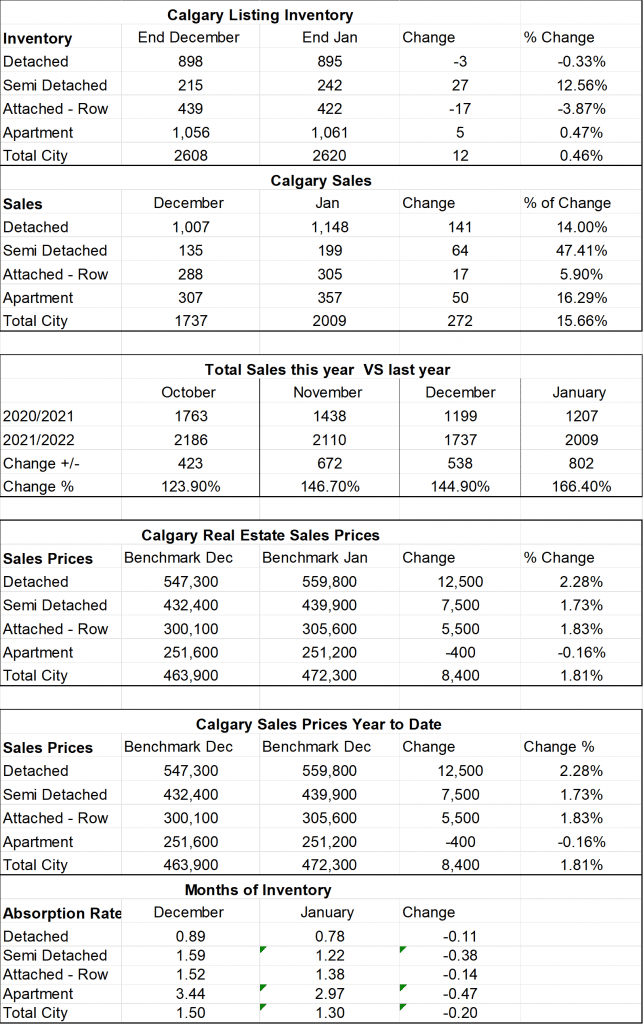
Following is a summary of what I deem to be the most important numbers.  Again, we look at Total Inventory, Sales for the past 30 days, Months of Inventory and of course the benchmark price.  All numbers are taken from the Calgary Real Estate boards monthly stats package.

Show Listing inventory, Sales, and Benchmark prices for all sectors of the Calgary Real Estate Market.

Gord’s commentary for the month (just my opinion).

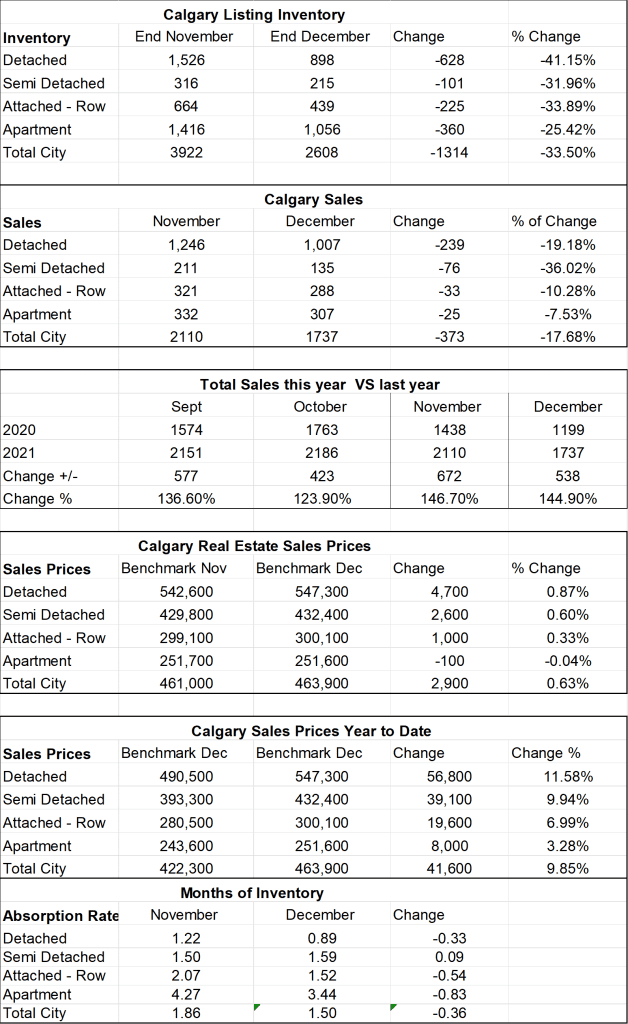
Listing inventory decreased by 27% in all Sectors combined while sales also decreased but by only 16.5% from November lowering our months of Inventory and putting Detached and Semi-Detached homes into a seller’s market position.

Covid: Even though we are in a similar lockdown situation as we were in March there does not seem to be the same result in the market falling.  I believe that the public is now aware of the many protocols Realtor’s have put in place to keep both Buyers and Sellers safe. On top of that I believe people are seeing that there is a light at the end of the tunnel with the recent Vaccine announcements.

Calgary Listing Inventory

Listing inventory decreased by 27% in all Sectors combined which is a normal trend for this time of year.  How many people really want their home listed during the holiday season.   by which is 100% normal for the Holiday Season.

 Calgary Sales:

Sales in all sectors dropped in December compared to November – again 100 % normal for December as peoples focus turns on Christmas and away from Real Estate.  It is worth noting that compared to last December sales are up by over 40%.

 Sales Compared to 2019:

It is critical to note that in all my other numbers I look at month over month.  This chart below shows us the numbers this year compared to last year.   Although December sales slowed, we were still 343 sales higher than last year or 40.7% higher.


  Jan Feb Mar Apr May June July Aug Sept Oct Nov Dec
2019 801 973 1327 1544 1915 1775 1642 1580 1365 1438 1146 858
2020 861 1195 1175 573 1080 1747 1835 80 1702 1764 1437 1199
Change +60 +222 -152 -971 -835 -28 +194 -7 337 +326 +327 +343
% change +7.49 +22.8 -11.4 -62.8 -45.5 -1.6 +11.82% N/A 24.87% +22.67% +25.4% =40.7


Calgary Year to Date Sales

2019:  16,344 Sales

2020:  16,152 Sales

Therefore, at the end of the Year sales are down only 1.17% from 2019.


Calgary Real Estate Benchmark Sales Prices:

All sectors decreased slightly from last month.  Decreases were from $1,300 to $1,800 so very marginal.


Calgary Real Estate Sales Prices Year to Date: 2020

Detached homes increased by $10,400

Semi-Detached homes decreased by $800

Attached Row houses decreased by $2,500

Apartment Condos decreased by $4,800


Current Months of Inventory (Absorption Rate): 

The months of Inventory decreased in all Sectors.  December saw a large decrease in listings and saw a small decrease in sales.  We are moving into Sellers Market territory in the Detached and Semi-Detached sectors.  Attached Row and Apartment Condo are still in strong Buyers Market Conditions.


It is also important to note that these numbers vary by community, and by price range.  If you would like numbers for your community contact us.


Calgary Real Estate Market Snapshot – Dec 1, 2020

Tuesday, December 1st, 2020

What is really happening in the Calgary Real Estate Market?

The market is simply a result of Supply and Demand therefore we look at both Supply (inventory) and Demand (Sales) and the relationship between the two.  We also update you on the current benchmark price for all housing sectors.

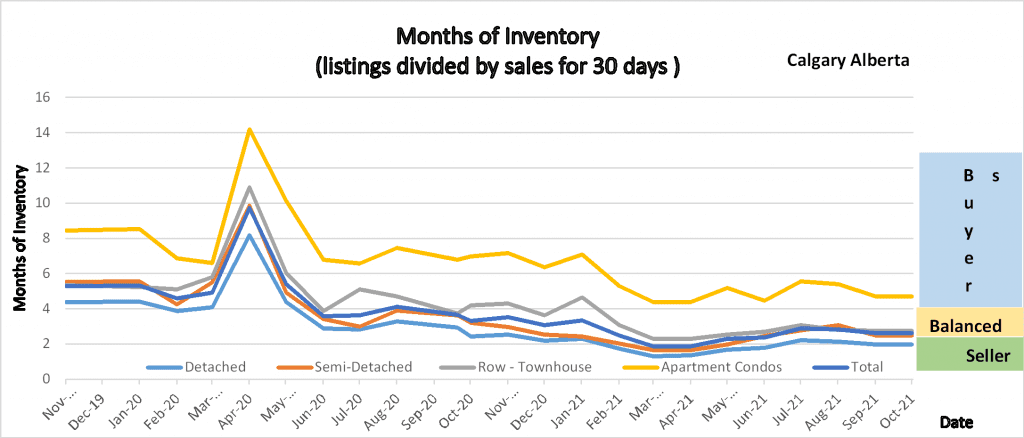
Following is a graph that shows the months of inventory for each housing sector.  Looking at a 2-year trendline gives you and indication of where things are really heading.

2 Year Graph showing months of Inventory.

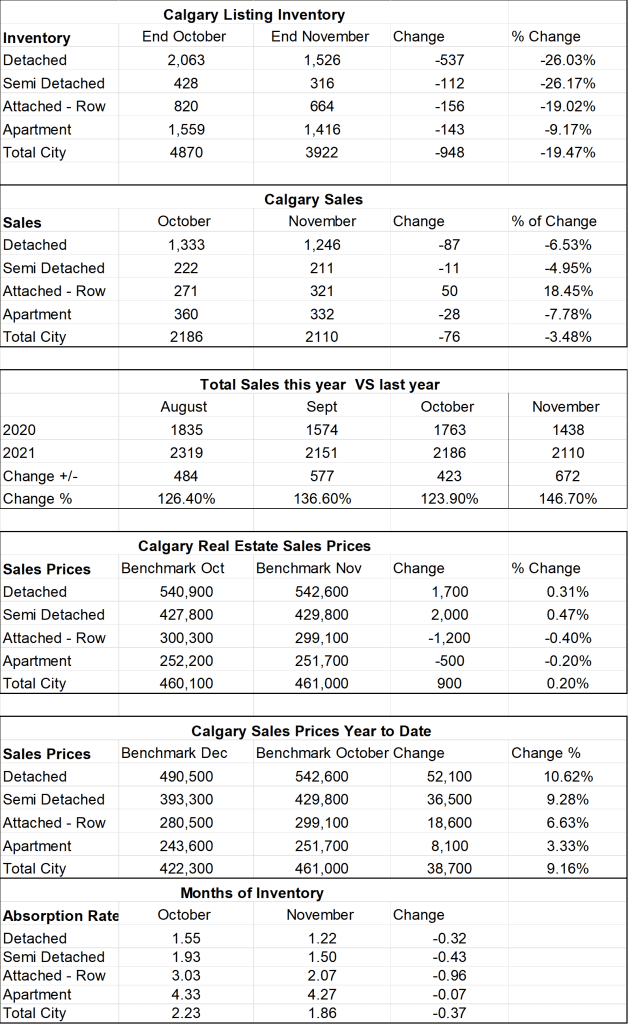
Following is a summary of what I deem to be the most important numbers.  Again, we look at Total Inventory, Sales for the past 30 days, Months of Inventory and of course the benchmark price.  All numbers are taken from the Calgary Real Estate boards monthly stats package.

Calgary Real Estate Board Stats


Gord’s commentary for the month (just my opinion).

Calgary Listing Inventory

Our total listing inventory dropped in all sectors with inventory decreasing by 805 listings or a 13.8% drop from October. This is simply a normal seasonal adjustment and we can expect listings to drop further through December.

Calgary Sales:

November sales decreased in all sectors.  The largest drop was in detached homes and it dropped by 256 sales or 22.48% from October.  The total decrease was 327 sales less or a decrease of 18.54%.  As with inventory, sales declining in November is strictly a seasonal adjustment and we will see a further decline in December.

 Sales Compared to 2019:

It is critical to note that in all my other numbers I look at month over month.  This chart below shows us the numbers this year compared to last year.   Although November sales slowed, we were still 327 sales higher than last year or 25.4% higher.


  Jan Feb Mar Apr May June July Aug Sept Oct Nov Dec
2019 801 973 1327 1544 1915 1775 1642 1580 1365 1438 1146 858
2020 861 1195 1175 573 1080 1747 1835 80 1702 1764 1437  
Change +60 +222 -152 -971 -835 -28 +194 -7 337 +326 +327  
% change +7.49 +22.8 -11.4 -62.8 -45.5 -1.6 +11.82% N/A 24.87% +22.67% +25.4%  


Calgary Real Estate Benchmark Sales Prices:

For the 4th month in a row we saw the Benchmark Sales price in Calgary increase. The overall increase was $3,600.  All sectors except Apartment Condos increased.  Apartment Condo sector decreased by $3,200.


Calgary Real Estate Sales Prices Year to Date

Since the beginning of the year

Detached homes increased by $11,900

Semi-Detached homes increased by $1,000

Attached Row houses decreased by $800.

Apartment Condos decreased by $3,000


Current Months of Inventory (Absorption Rate): 

The months of Inventory decreased in Semi-detached homes by .24

Every other sector saw a small increase in the Months of Inventory.

It is also important to note that these numbers vary by community, and by price range.  If you would like numbers for your community contact us.   For example, many communities if I look at listings under $500,000. they are showing being in a Sellers Market position and are getting competing offers.

Calgary Real Estate Market Snapshot: Nov 1, 2020

Monday, November 2nd, 2020

 What is really happening in the Calgary Real Estate Market?

The market is simply a result of Supply and Demand therefore we look at both Supply (inventory) and Demand (Sales) and the relationship between the two.  We also update you on the current benchmark price for all housing sectors.

Following is a graph that shows the months of inventory for each housing sector.  Looking at a 2-year trendline gives you and indication of where things are really heading.

Months of Inventory


Following is a summary of what I deem to be the most important numbers.  Again, we look at Total Inventory, Sales for the past 30 days, Months of Inventory and of course the benchmark price.  All numbers are taken from the Calgary Real Estate boards monthly stats package.

Stats taken from the Calgary Real Estate Boards Stats Package.

Gord’s commentary for the month (just my opinion).

Another strong month in the Calgary Real Estate Market with sales up and inventory down.

Calgary Listing Inventory

Our total listing inventory dropped in all sectors with  a total decrease of 453 listings or 7.21%. Most of the decrease was in the detached home sector with a decrease of 340 listings.

 Calgary Sales:

October sales beat September sales by 58 sales or 3.4%.  The detached and semi-detached saw increases while the Attached-Row and apartment condo sector saw a slight decline.  This is opposite of the normal where in October we are seeing sales declining from the peak.

 Sales Compared to 2019:

It is critical to note that in all my other numbers I look at month over month.  This chart below shows us the numbers this year compared to last year.   October sales were 22.67% higher than last October.


Calgary Real Estate Benchmark Sales Prices:

For the third month in a row the Benchmark Price overall increased by $550. It is interesting that every sector’s benchmark price increased this month.


Calgary Real Estate Sales Prices Year to Date

Since the beginning of the year

Increases of $9,700 in Detached homes, and $600. In Semi Detached and $200. In Apartment condos.

Decreases of $8,600 in the Attached-Row sector.


Current Months of Inventory (Absorption Rate): 

The months of Inventory decreased in Detached homes and Semi-detached while the Attached-row and Apartment sectors both saw increases.


It is also important to note that these numbers vary by community, and by price range.  If you would like numbers for your community contact us.   For example, many communities if I look at listings under $500,000, they are showing being in a Sellers Market position and are getting competing offers.


Calgary Real Estate Market Snapshot – Oct 1, 2020

Saturday, October 3rd, 2020

What is really happening in the Calgary Real Estate Market?

The market is simply a result of Supply and Demand therefore we look at both Supply (inventory) and Demand (Sales) and the relationship between the two.  We also update you on the current benchmark price for all housing sectors.

Following is a graph that shows the months of inventory for each housing sector.  Looking at a 2-year trendline gives you and indication of where things are really heading.

Months of Inventory

Graph shows the 2 year trend of Months of Inventory for all housing sectors in the Calgary Real Estate Market.


Following is a summary of what I deem to be the most important numbers.  Again, we look at Total Inventory, Sales for the past 30 days, Months of Inventory and of course the benchmark price.  All numbers are taken from the Calgary Real Estate boards monthly stats package.


Gord’s commentary for the month (just my opinion).

Another extraordinarily strong month in the Calgary Real Estate Market.  Total sales were up 24.87% from Sept 2019.

 Calgary Listing Inventory

Our total listing inventory dropped in all sectors for a total decrease of 3.79%

 Calgary Sales:

September sales beat August sales by 8.2% and like inventory it was in all sectors.  This is unusual as September typically shows a decrease in sales.  It feels like we are now in the middle of the Spring Market.

Sales Compared to 2019:

It is critical to note that in all my other numbers I look at month over month.  This shows us the numbers this year compared to last year.


  Jan Feb Mar Apr May June July Aug Sept Oct Nov Dec
2019 801 973 1327 1544 1915 1775 1642 1580 1365 1440 1146 858
2020 861 1195 1175 573 1080 1747 1835 80 1702      
Change +60 +222 -152 -971 -835 -28 +194 -7 337      
% change +7.49 +22.8 -11.4 -62.8 -45.5 -1.6 +11.82% N/A 24.87%      


 Calgary Real Estate Benchmark Sales Prices:

For the second month in a row the Benchmark Sales Price increased overall and increased in all sectors except Semi Detached which remained the same.

 Calgary Real Estate Sales Prices Year to Date

Since the start of 2020 prices have increased for Detached homes, Semi-Detached, and overall.  Attached row are showing $9,300 less that the end of 2019 and apartment condos are down by only $400.

Current Months of Inventory (Absorption Rate): 

As inventory declined and sales increased our months of inventory decreased for all sectors.

All sectors are now sitting in a balanced market position with the exception of Apartment condos which are still very much in a buyers market with 6.76 Months of Inventory.

It is also important to note that these numbers vary by community, and by price range.  If you would like numbers for your community contact us.   For example, many communities if I look at listings under $500,000, they are showing being in a Sellers Market position and are getting competing offers.


Calgary Real Estate Market Snapshot for July 2020

Tuesday, August 4th, 2020

Amazingly the Calgary Real Estate Market has recovered from Covid.

What is really happening in the Calgary Real Estate Market?

The market is simply a result of Supply and Demand therefore we look at both Supply (inventory) and Demand (Sales) and the relationship between the two.  We also update you on the current benchmark price for all housing sectors.

Following is a graph that shows the months of inventory for each housing sector.  Looking at a 2-year trendline gives you and indication of where things are really heading.

Months of Inventory – Graph shows the 2 year trend of Months of Inventory for all housing categories in the Calgary Real Estate Market.

Following is a summary of what I deem to be the most important numbers.  Again, we look at Total Inventory, Sales for the past 30 days, Months of Inventory and of course the benchmark price.  All numbers are taken from the Calgary Real Estate boards monthly stats package.

Calgary Real Estate Stats


Gord’s commentary for the month (just my opinion).

Well, we seem to have returned to a more normal market.  July’s sales outpaced 2019 July Sales by 6.56% and that was after a slower start in July.

Calgary Listing Inventory

Inventory in all sectors except Semi-Attached increased this month. The largest increases were in the Detached and Apartment Sectors which each grew by 170 listing.  Listings in the Semi-Detached sector declined by 30 listings.

Calgary Sales:

July’s sales increased in all sectors except Attached Row homes where sales were 40 less.

Overall sales increased by 88 listings or 5.04%.  In my opinion this is very good as sales in the first few weeks were slower.

Sales Compared to 2019:

It is critical to note that in all my other numbers I look at month over month.  This shows us the numbers this year compared too last year.  As you can see July’s sales beat last year by 194 sales or 11.82%.  As a Realtor, it almost feels like July was the start of our Spring market even seeing lots of multiple offers. I will not predict how long this trend will last.


  Jan Feb Mar Apr May June July Aug Sept Oct Nov Dec
2019 801 973 1327 1544 1915 1775 1642 1574 1365 1440 1146 858
2020 861 1195 1175 573 1080 1747 1835
Change +60 +222 -152 -971 -835 -28 +194
% change +7.49 +22.8 -11.4 -62.8 -45.5 -1.6 +11.82%


Calgary Real Estate Benchmark Sales Prices: Some increases are nice to see.

Detached homes increased by $11,000

Semi-Detached Increased by $5,700

Attached Row decreased by $3,700

Apartment Condos Increased by $2,500

Total Market increased by $6,700

 Calgary Real Estate Sales Prices Year to Date

For the year Semi-Detached have now seen an increase of $3300.

All other sectors are still in negative territory with Attached Row homes seeing the largest decrease at $12,200.

Current Months of Inventory (Absorption Rate): 

Detached, Semi-Detached are both sitting in a balanced market position while Attached-Row and Apartment condos are both sitting in a buyer’s market position.


It is also important to note that these numbers vary by community, and by price range.  If you would like numbers for your community contact us.   For example, many communities if I look at listings under $500,000, they are showing being in a Sellers Market position.


Calgary Real Estate Market Snapshot for June 2020

Thursday, July 2nd, 2020

What is really happening in the Calgary Real Estate Market?  Everything you need to know at a glance.

What is really happening in the Calgary Real Estate Market?

The market is simply a result of Supply and Demand therefore we look at both Supply (inventory) and Demand (Sales) and the relationship between the two.  We also update you on the current benchmark price for all housing sectors.

Following is a graph that shows the months of inventory for each Sector.  Looking at a 2-year trendline gives you and indication of where things are really heading.

2 year Market Trend


Following is a summary of what I deem to be the most important numbers.  Again, we look at Total Inventory, Sales for the past 30 days, Months of Inventory and of course the benchmark price.  All numbers are taken from the Calgary Real Estate boards monthly stats package.

A quick look at key numbers in the Calgary Real Estate Market.


Gord’s commentary for the month (just my opinion).

Much to everyone’s surprise the Calgary Real Estate market has come back as quickly as it declined with Covid-19.

Calgary Listing Inventory

Our listing inventory increased in all sectors.  The good news is that inventory increase less than sales.  Keeping our inventory in check is important in keeping balance in the market.

Calgary Sales:

June’s sales increased by a whopping 61.76% over may sales.  Again, this increase was in all sectors.  All sectors increases were in the 60% range except Semi Detached where the increase was less at 47.24%

Sales Compared to 2019:

It is critical to note that in all my other numbers I look at month over month.  This shows us the numbers this year compared too last year.  In June, our sales ended at 1.6% less than last year.   It is important to note that total sales in the first week of June were only at 301.  By the last full week of June we 492 sales so if all weeks were as strong as the last week we would have blown out last years sales.  Another interesting note is 492 is the highest number of sales in a week since June 2017.

One last mote on sales:  CMHC ( the government’s mortgage insurance company) changed the qualifying rules and the change came into effect as of July 1, 2020 so some people may have jumped into the market before this change came in.

  Jan Feb Mar Apr May June July Aug Sept Oct Nov Dec
2019 801 973 1327 1544 1915 1775 1642 1574 1365 1440 1146 858
2020 861 1195 1175 573 1080 1747
Change +60 +222 -152 -971 -835 -28
% change +7.49 +22.8 -11.4 -62.8 -45.5 -1.6


Calgary Real Estate Sales Prices:  In my opinion fairly good considering Covid.

Detached homes increased by $500.

Semi-Detached decreased by $1,800

Attached Row increased by $100

Apartment Condos Decreased by $1,700

Total Market decreased by $300


Calgary Real Estate Sales Prices Year to Date

Sorry to report that all sectors have declined in year to date pricing. The lowest decline is in Semi-Detached at .62%  The largest decrease was in Apartment Condos and they lost 3.18%

 Current Months of Inventory (Absorption Rate): 

At the end of June all sectors except apartment condo are less than 4.0 months of Inventory so all are in a balanced market. Apartment condos were a 6.79 which is a good improvement from 10.13 at the end of May.

It is also important to note that these numbers vary by community, and by price range.  If you would like numbers for your community contact us.


Calgary Real Estate Market Snapshot June 1, 2020

Tuesday, June 2nd, 2020

The market is simply a result of Supply and Demand therefore we look at both Supply (inventory) and Demand (Sales) and the relationship between the two.  We also update you on the current benchmark price for all housing sectors.

Following is a graph that shows the months of inventory for each Sector.  Looking at a 2-year trendline gives you and indication of where things are really heading.

Shows the absorption rate for every sector in the Calgary Real Estate market for the last 2 years.

Absorption Rate Graph

Following is a summary of what I deem to be the most important numbers.  Again, we look at Total Inventory, Sales for the past 30 days, Months of Inventory and of course the benchmark price.  All numbers are taken from the Calgary Real Estate boards monthly stats package.

Key Stats from the Calgary Real Estate Board.


Gord’s commentary for the month (just my opinion).

Its been another interesting month in the Calgary market during this Covid 19 time.

An optimist would say we gained 88.5% on sales (from last month)

A pessimist would say were down 45.5% (from last year)

Calgary Listing Inventory

Typically, May is the start of the spring market and that means increased listings.  In May we increased our listing inventory from 5576 to 5813, only an increase of 237 listings.  This small increase is good news and is helping us hold the value of homes.

Calgary Sales:

Wow, what a change Sales in May increased by 88.5% over April.  All categories increased over 80% except apartment condos and they increased by 44.2%.

Sales Compared to 2019:

It is critical to note that in all my other numbers I look at month over month.  This shows us the numbers this year compared too last year.   So, although the market saw a huge improvement in May we are still down 45.5% from last year in May, meaning we have a long way to go.

Calgary Real Estate Sales Prices:

As one would expect we did see price decreases in all sectors of between $1,800 (Condos) To $4,800 (detached homes) except for Semi-Detached homes which increased by $2000

Calgary Real Estate Sales Prices Year to Date

Every sector has seen a decrease in Year to Date Benchmark price – the smallest decrease being in the Semi-Detached sector with a loss of $600.  All other sectors saw decreases of between $5,800 to $8,600. The Total decrease across all sectors is -$6,900  or 1.65

Current Months of Inventory (Absorption Rate): 

In May, all sectors decreased the absorption rate drastically.  This is mainly driven by our inventory holding, Decreases were between -3.8 to -4.95

It is also important to note that these numbers vary by community, and by price range.  If you would like numbers for your community contact us.