Posts Tagged ‘Northwest Calgary Real Estate Prices’

Calgary Real Estate Market Snapshot – June 1, 2023

Thursday, June 1st, 2023

What is really happening in the Calgary Real Estate Market?


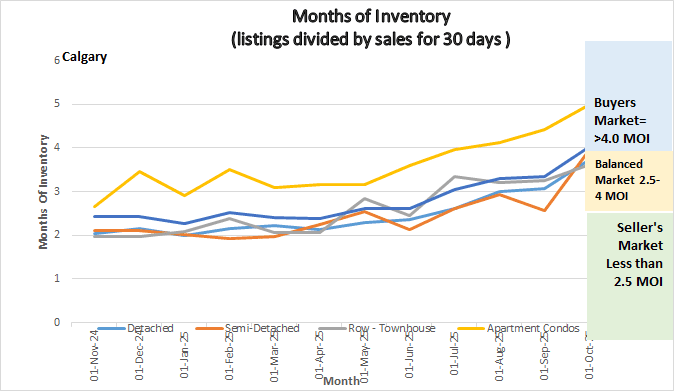
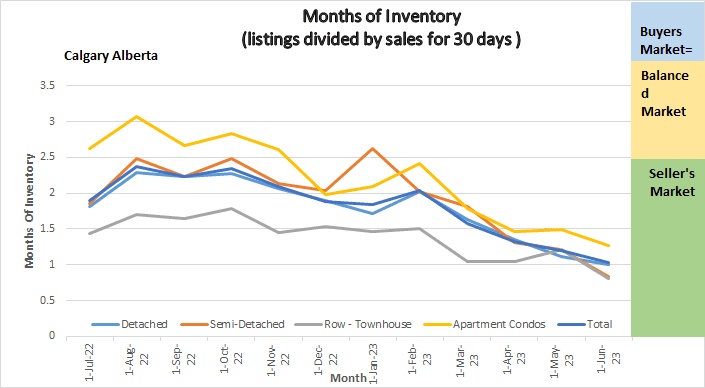
Following is a graph that shows the months of inventory for each housing sector. Looking at a one-year trendline gives you an indication of where things are really heading.

Months of Inventory

Months of Inventory


Gord’s commentary for the month (just my opinion).

May 2023 Highlights

The Calgary Market is continuing at a blistering pace!

  • Months of Inventory declines again
  • Prices continue the upward trend.
  • New listings increased resulting in a sale increase.


Calgary Listing Inventory

There were only small changes in the listing inventory for the month resulting in 31 less listings as of today compared to May 1, 2023


Calgary Sales:

Sales increased in all sectors this month.  The overall increase was 15.99% The different sectors ranged from 13.78% for detached homes to 19.47% for Attached-Row.  In my opinion the cause of the increase in sales is because we had substantially more new listings hit the market this month. New listings went from 3132 in April to 3652 in May.  Sales should continue to be strong as the demand seems to be much higher than the supply.


Sales Compared to 2022: 

It is also important to look at sales compared to the Previous year. Sales for April were 711 less than last year. Again, in my opinion this is simply due to not having enough Inventory on the market.

  Jan Feb Mar Apr May June July
2022 2004 3305 4091 3401 3071 2842 2254
2023 1199 1740 2432 2690 3120
Change -805 -1565 -1659 -711 +57
% Change -40.1% -47.4% -40.55% -20.9% +1.9%


 Calgary Real Estate Benchmark Sales Prices:

The overall benchmark price increased by $6,200 in May.  The largest increase was in the detached sector at $12,100 and the smallest increase was in the Apartment Condo sector at $4,500.  My predictions are that this trend will continue as the months of inventory is still very low putting us in deep seller’s market territory.

Calgary Real Estate Benchmark Year to Date Sales Price:  See chart below.

For all of Calgary we have so far seen an overall increase of 7.36% or $38,200. The lowest dollar increases so far has been apartment condos at $23,800 and the highest is Detached homes at $54,400.


Current Months of Inventory (Absorption Rate): 

Months of Inventory decreased again in all sectors making things even tighter.

My Prediction for what is ahead:  Being that we are in a deep Sellers Market, we will continue to see prices increasing. As we have seen all new inventory get sold right away and no net gain, I still have to say this trend is going to continue for the next several months.


Below is a summary of numbers in chart form. All numbers are taken from the Calgary Real Estate Boards monthly Stats package.


All numbers vary by community and price ranges, if you would like stats specifically for your neighbourhood, please contact us.


Calgary Real Estate Market Snapshot for Jan 1, 2023

Tuesday, January 3rd, 2023

What is really happening in the Calgary Real Estate Market?

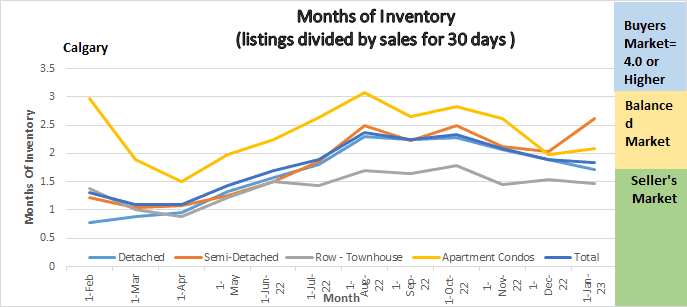
 Following is a graph that shows the months of inventory for each housing sector. Looking at a one-year trendline gives you an indication of where things are really heading.

Calgary Real Estate Market Trend

Graph shows the months of inventory for all sectors in the Calgary Real Estate Market. Also show for each sector it that sector is in a Buyers, Sellers or Balanced Market position.

Gord’s commentary for the month (just my opinion).

December 2022 Highlights

The Calgary Market continues to stay strong!

  • Our Inventory continues to decline, and we are well below normal levels of listings
  • Sales declined but not as much as Inventory
  • Months of Inventory declined again


2022 Summary at a Glance

The first half of the year sales were sky high and tapered off in the last half of the year.

  • Sales reached a record high in 2022 with 29,672 sales
  • As of January 1, there were 2214 listings on the market – the lowest level of Inventory for December in over a decade.
  • Calgary continues to report activity that is better than levels seen before the pandemic and higher than long term trends.
  • Benchmark Prices eased to $518,000 in December down 5% from the peak in May but are still almost 8% higher than December last year.


Calgary Listing Inventory

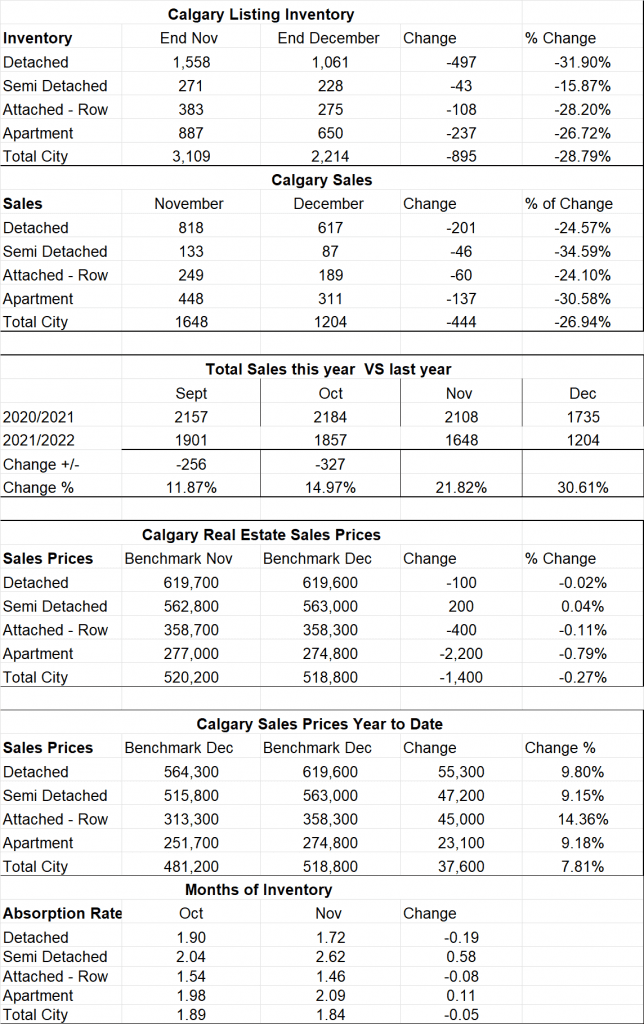
Listing Inventory declined again this month. In all sectors combined we are down 28.79% in listings from December 1st. While declining numbers of listings are normal for this time of year this is a steeper decline than what I would like to see. Although this is good for sellers, I think this could be another tough year for buyers.


Calgary Sales:

All sectors saw a decrease of sales in December, overall sectors the decline was 26.94% putting the decline of sales less than the decline of inventory (listings).


Sales Compared to 2021: 

It is also important to look at sales compared to the Previous year. Sales for December were down 30.61% when compared to last December of 2021. Although this looks like a substantial number, we also need to consider that last December is when things in the Calgary Real Estate Market started getting heated so not meeting last years sales does not concern me at all. Overall sales in December were still above the long-term average.


  Jan Feb Mar Apr May June July
2021 1207 1831 2903 3204 2981 2914 2314
2022 2009 3305 4107 3401 3071 2842 2254
Change + 802 1474 +1204 +197 90 -72 -60
% Change + 66.4% +180.5% +141.5% +1.06 +1.03% 2.5% 2.7%


  Aug Sept Oct Nov Dec
2021 2146 2157 2184 2108 1735
2022 2136 1901 1857 1648 1204
Change -10 -256 -327 -460 -531
% Change -.5% -11.9% -17.6% -21.8% 30.61%


Calgary Real Estate Benchmark Sales Prices:

The benchmark price for all sectors combined declined by $1,400 in December. All sectors saw a decline except the Semi-Detached Sector that increased by $200.


Calgary Real Estate Benchmark Year to Date Sales Price:  See chart below.

Year to date the Calgary Benchmark Price increased by 7.81% in 2022. All the increases were between 7.8% to 9.8% except the Attached Row Sector which increased by 14.36%. See stats below for sector breakdowns.


Current Months of Inventory (Absorption Rate): 

The Detached and Attached Row houses both saw a small decline in the months of inventory.

The apartment condo market saw a slight increase of .11 while the Semi-Detached market saw a significant increase of .58 months of Inventory.


What might the first quarter of 2023 bring: (again just my opinion)

Based on what I am seeing, I believe that for the first half of the year we will continue to see a low inventory of listings. This is going to push sales numbers down as buyers are just not finding what they are looking for so are waiting. Depending what the Federal bank does with interest rates, but I speculate that we will see another 1 or 2 increases in the interest rate which will put more downward pressure on demand.


Below is a summary of numbers in chart form. All numbers are taken from the Calgary Real Estate Boards monthly Stats package.

All numbers vary by community and price ranges, if you would like stat specifically for your neighborhood, please contact us.

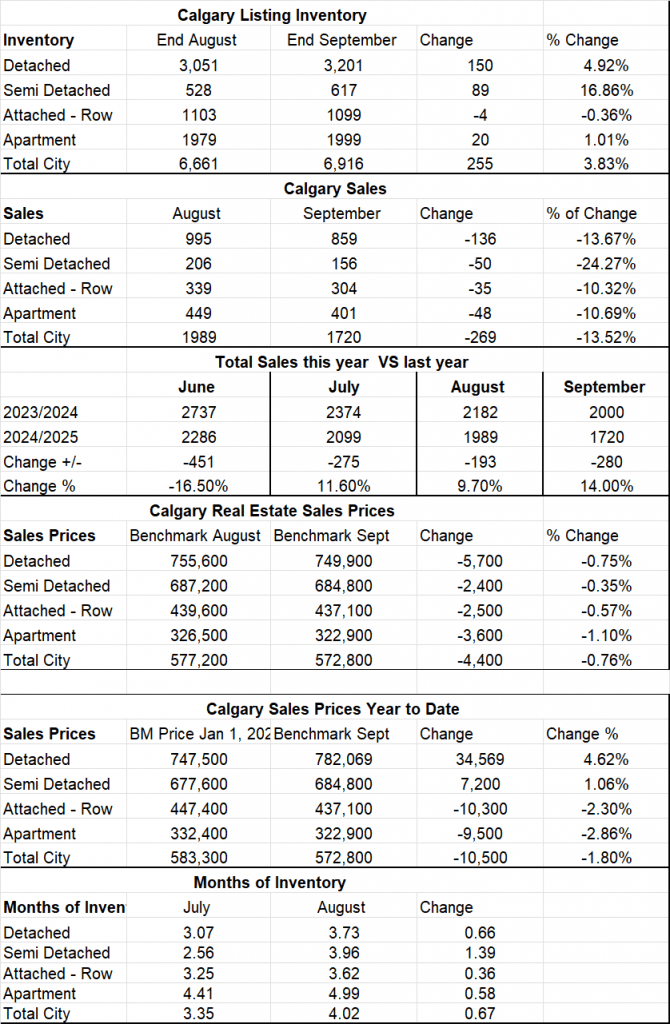
Stats from the Calgary Real Estate Board

Shows the number of listings, sales, Benchmark Price and Months of Inventory for all sectors of the Calgary Real Estate Market for the last 2 months along with the change. Numbers are taken from the Calgary Real Estate Board Realtors Stats package.
Calgary Real Estate Market Snapshot: Jan 2021

Monday, January 4th, 2021

 What is really happening in the Calgary Real Estate Market?

The market is simply a result of Supply and Demand therefore we look at both Supply (inventory) and Demand (Sales) and the relationship between the two.  We also update you on the current benchmark price for all housing sectors.

Following is a graph that shows the months of inventory for each housing sector.  Looking at a 2-year trendline gives you and indication of where things are really heading.

Months of Listing Inventory

Months of Listing Inventory


Following is a summary of what I deem to be the most important numbers.  Again, we look at Total Inventory, Sales for the past 30 days, Months of Inventory and of course the benchmark price.  All numbers are taken from the Calgary Real Estate boards monthly stats package.

Show Listing inventory, Sales, and Benchmark prices for all sectors of the Calgary Real Estate Market.

Gord’s commentary for the month (just my opinion).

Listing inventory decreased by 27% in all Sectors combined while sales also decreased but by only 16.5% from November lowering our months of Inventory and putting Detached and Semi-Detached homes into a seller’s market position.

Covid: Even though we are in a similar lockdown situation as we were in March there does not seem to be the same result in the market falling.  I believe that the public is now aware of the many protocols Realtor’s have put in place to keep both Buyers and Sellers safe. On top of that I believe people are seeing that there is a light at the end of the tunnel with the recent Vaccine announcements.

Calgary Listing Inventory

Listing inventory decreased by 27% in all Sectors combined which is a normal trend for this time of year.  How many people really want their home listed during the holiday season.   by which is 100% normal for the Holiday Season.

 Calgary Sales:

Sales in all sectors dropped in December compared to November – again 100 % normal for December as peoples focus turns on Christmas and away from Real Estate.  It is worth noting that compared to last December sales are up by over 40%.

 Sales Compared to 2019:

It is critical to note that in all my other numbers I look at month over month.  This chart below shows us the numbers this year compared to last year.   Although December sales slowed, we were still 343 sales higher than last year or 40.7% higher.


  Jan Feb Mar Apr May June July Aug Sept Oct Nov Dec
2019 801 973 1327 1544 1915 1775 1642 1580 1365 1438 1146 858
2020 861 1195 1175 573 1080 1747 1835 80 1702 1764 1437 1199
Change +60 +222 -152 -971 -835 -28 +194 -7 337 +326 +327 +343
% change +7.49 +22.8 -11.4 -62.8 -45.5 -1.6 +11.82% N/A 24.87% +22.67% +25.4% =40.7


Calgary Year to Date Sales

2019:  16,344 Sales

2020:  16,152 Sales

Therefore, at the end of the Year sales are down only 1.17% from 2019.


Calgary Real Estate Benchmark Sales Prices:

All sectors decreased slightly from last month.  Decreases were from $1,300 to $1,800 so very marginal.


Calgary Real Estate Sales Prices Year to Date: 2020

Detached homes increased by $10,400

Semi-Detached homes decreased by $800

Attached Row houses decreased by $2,500

Apartment Condos decreased by $4,800


Current Months of Inventory (Absorption Rate): 

The months of Inventory decreased in all Sectors.  December saw a large decrease in listings and saw a small decrease in sales.  We are moving into Sellers Market territory in the Detached and Semi-Detached sectors.  Attached Row and Apartment Condo are still in strong Buyers Market Conditions.


It is also important to note that these numbers vary by community, and by price range.  If you would like numbers for your community contact us.


Just Listed: 6 Chisholm Cres NW Calg, T2L 0Z1

Thursday, October 17th, 2019

Price Reduced – Just listed this Bright and Beautiful 4 level split with 4 bedrooms in sought after Charleswood.

MLS # C4282754

Virtual Tour:  https://youtu.be/7z5LTzfDOU8


Bright and Beautiful 4 level split with 4 bedrooms in sought after Charleswood.  Has seen substantial upgrades over the years including exterior Stucco, soffits & shingles. Interior has been freshly painted, and has an updated kitchen, baths, most windows & furnace. In 2015 sellers spent $68K on landscaping including a pad for a 24 x 24 garage.  This home offers a unique open floor plan with Vaulted ceilings on main.  Living room features an electric fireplace, gleaming hardwood and large windows bringing lots of natural light.  Kitchen offers plenty of cabinets & a large breakfast bar. Upper offers 2 bedrooms and a full bath.  3rd level offers a Walk Out, 2 more bedrooms and a 1/2 bath.  Basement if fully developed with Rec room and 3-piece bath.  Front carport, Huge yard was custom designed with a Paving stone patio, a 24 x 24 garage pad, rundle stone boulders, trees, shrubs and a sprinkler system.  All of this in the desirable community of Charleswood. Close to schools, public transportation.

For more information or a viewing contact me

Calgary Real Estate Market Snapshot for Jan 1, 2019

Wednesday, January 2nd, 2019

What is really happening in the Calgary Real Estate Market?

First Explaining my report: Stay ahead of everyone else by following our Monthly Market Snapshot of the Calgary Real Estate Market. This shows what’s really happening! The market is driven by supply and demand so here we show the inventory (supply) and sales (demand) and most importantly the relationship between the two and how it affects the price of Calgary Real Estate.  A simple way to keep up to date with how the market is trending and to stay ahead of most! All numbers are taken from the Calgary Real Estate Boards Stats package for Realtors. I have also included some general comments which are simply my opinion.

Months of Inventory:  If we did not list any more homes this is how many months it would take to deplete inventory.

Months of Inventory/Absorption Rate – the inventory divided by the number of sales in the last month). What does this mean you might ask?

Buyer’s Market >4.0 Drives prices down
Balanced Market Between 2.4 to 4.0 Prices typically remain stable
Seller’s Market <2.4 Drives prices up


Current Monthly Report 


Current Report

Current Months of Inventory: 

In December our months of inventory increased in all categories except Semi-Detached which decreased a little.  Of note is that apartment condos increased 4.15 months – this is important as last month condos decreased by 1.63 leaving a net 2 month gain of 2.54 months which is still substantial.  All housing categories are now in a “buyer’s market position”.


End of Nov 2018    Dec 2018    Change
Detached 5.16 5.23 0.07
Semi Detached 6.97 6.59 -0.39
Attached – Row 6.58 6.81 0.23
Apartment 5.51 9.66 4.15
Total City 5.57 6.18 0.60


Calgary Listing Inventory

In December, our inventory decreased in all sectors and overall, the highest decrease was in the Detached home sector followed by the Apartment Condo sector. This decrease is normal at this time of year as people often take their home off the market during the Holiday Season and many will relist in January.


Inventory Nov 2018    Dec 2018    Change
 Detached 3507 2592 -915
Semi Detached 753 573 -180
Attached – Row 948 715 -233
Apartment 1323 1024 -299
Total Calgary 6531 4904 -1627


Calgary Sales:

In December we saw a decrease in sales in all Categories.  Again, this is very normal as people are busy during the holidays and Real Estate moves often get put off until people are settled in after the holidays.  I speculate that in January these numbers will start to increase.


Calgary Sales  Nov 2018    Dec 2018    Change % Change
Detached 680 496 -184 -27.06%
Semi Detached 108 87 -21 -19.44%
Attached – Row 144 105 -39 -27.08%
Apartment 240 106 -134 -55.83%
Total City 1172 794 -378 -32.25%


***Sales Compared to last year***

As you can see from the chart below comparing sales to last year’s sales there have been some substantial changes.  In the first half of the year we were trending up and in the last 6 months we are trending down rather quickly.  My belief is that this is due to the Economic conditions in Calgary and declining consumer confidence.

Jan Feb Mar Apr May June July Aug Sept Oct Nov  Dec
102% 82% 72% 80% 82% 89% 95% 93% 85.9% 89.9% 83.0 78.6


Calgary Real Estate Sales Prices:

December saw prices decrease in all sectors with the largest decrease being in the Detached home sector.  This is expected with the high number of months of inventory on the market.  Unless something changes we can expect to see this trend for a few more months.

  Sales Prices Nov 2018     Benchmark Price   Dec 2018   Benchmark Price Change
Detached 486,000 481,400 -4,600
Semi Detached 400,700 397,500 -3,200
Attached – Row 292,900 288,400 -4,500
Apartment 252,800 251,500 -1,300
Total City 422,600 418,500 -4,100


Sales Prices “Year to Date”  

Well the numbers are finally in for 2018 with all categories showing a loss in the Benchmark price.

Sales Prices Jan 1, 2018    Benchmark Price  Dec 2018   Benchmark Price Change

$

% Change
Detached 498,700 481,400 -17,300 -3.47%
Semi Detached 412,500 397,500 -15,000 -3.64%
Attached – Row 296,700 288,400 -8,300 -2.80%
Apartment 256,400 251,500 -4,900 -1.91%
Total City 432,400 418,500 -13,900 -3.21%

 **Please note that these numbers include only Calgary and  change on a community basis and more so for towns.  This report does not include rural properties and does not take into account differences in different price ranges.  If you would like to find stats on your community contact us.  If you have any questions about this summary or about Real Estate in general, please feel free to contact us.


Calgary Real Estate Market -June 1, 2018

Saturday, June 2nd, 2018

What is really happening in the Calgary Real Estate Market? 

What is really happening in the Calgary Real estate Market

What is really happening in the Calgary Real estate Market

What is really happening in the Calgary Real Estate Market?

Stay ahead of everyone else by following our Monthly Market Snapshot of the Calgary Real Estate Market. This shows what’s really happening! The market is driven by supply and demand so here we show the inventory (supply) and sales (demand) and most importantly the relationship between the two and how it affects the price of Calgary Real Estate.  A simple way to keep up to date with how the market is trending and to stay ahead of most! All numbers are taken from the Calgary Real Estate Boards Stats package for Realtors. I have also included some general comments which are simply my opinion.

Absorption Rate (Months of Inventory) – the inventory divided by the number of sales in the last month). What does this mean you might ask?

Buyer’s Market >4.0 Drives prices down
Balanced Market Between 2.4 to 4.0 Prices typically remain stable
Seller’s Market <2.4 Drives prices up


Current Absorption Rate

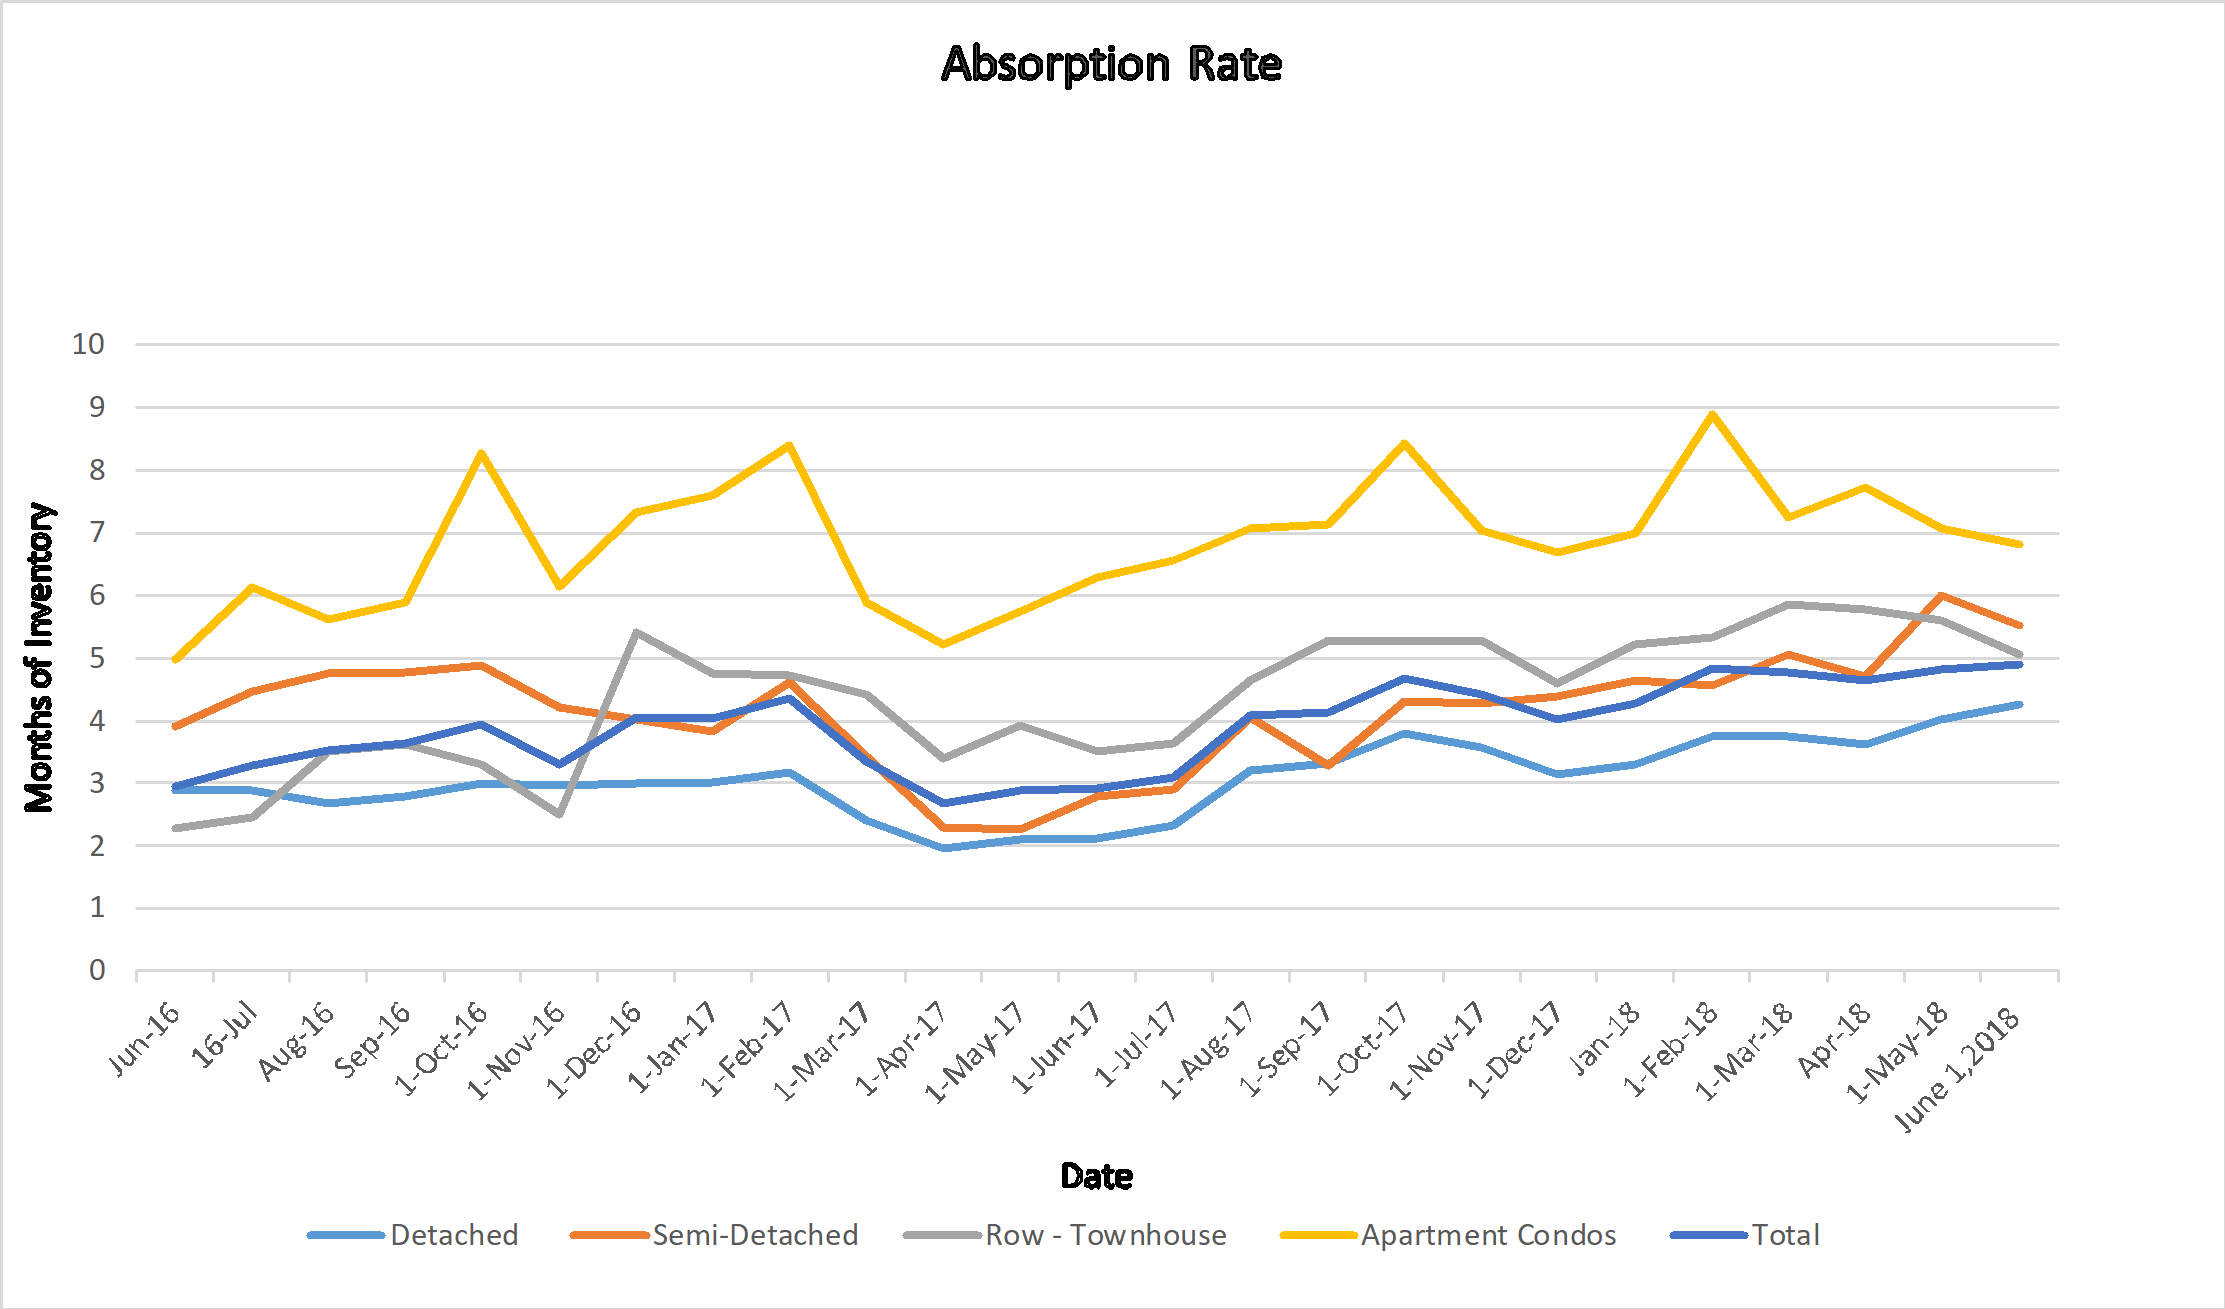
No major fluctuations here this month.  Detached homes went up a little while all other categories went down between .25 and .54

End of Apr 2018    May 2018    Change
Detached 4.01 4.26 0.25
Semi Detached 6.00 5.53 -0.47
Attached – Row 5.60 5.06 -0.54
Apartment 7.06 6.81 -0.25
Total City 4.82 4.90 0.07


 Calgary Listing Inventory

In April, our inventory increased in all Sectors. This is totally expected at this time of year and we should expect this trend to continue for another month anyways.

Inventory Apr 2018    May 2018    Change
Detached 3642 4504 862
Semi Detached 756 862 106
Attached – Row 1075 1163 88
Apartment 1851 1921 70
Total City 7324 8450 1126


Calgary Sales:

The good news is that sales are up from last month in all categories.  Looking at the bigger picture we are still substantially down from last year’s  sales.  May showed 18.4% less sales than May 2017.   This however is an improvement as April sales were down 20.3% from last April.

Calgary Sales  Apr 2018    May 2018    Change % Change
Detached 908 1058 150 16.52%
Semi Detached 126 156 30 23.81%
Attached – Row 192 230 38 19.79%
Apartment 262 282 20 7.63%
Total City 1518 1726 208 13.70%


Calgary Real Estate Sales Prices:

Prices in April showed very little change.  Attached-Row houses showed the largest gain of $3,200. while Semi-Detached homes showed the largest decrease of $1,000.

  Sales Prices Apr 2018   Benchmark Price   May 2018   Benchmark Price Change
Detached 504,500 504,500 0
Semi Detached 420,000 419,000 -1,000
Attached – Row 300,000 303,200 3,200
Apartment 256,700 256,200 -500
Total City 436,500 436,900 400


Sales Prices “Year to Date”  

Same as monthly number

Sales Prices Jan 1, 2018    Benchmark Price  May 2018   Benchmark Price Change

$

% Change
Detached 499,600 504,500 4,900 0.98%
Semi Detached 416,600 419,000 2,400 0.58%
Attached – Row 299,500 303,200 3,700 1.24%
Apartment 257,700 256,200 -1,500 -0.58%
Total City 433,200 436,900 3,700 0.85%


**Please note that these numbers include only Calgary homes and do change on a community basis and more so for towns.  This report does not include rural properties.  If you would like to find stats on your community just let me know.  If you have any questions about this summary or about Real Estate in general, please feel free to contact us.

Feb 1, 2017 Calgary Real Estate Market Snapshot

Wednesday, February 1st, 2017

What is really happening in the Calgary Real Estate market?

Feb 2017

Stay ahead of everyone else by following our Monthly Market Snapshot of the Calgary Real Estate Market This shows what’s really happening! The market is driven by supply and demand so here we show the inventory (supply) and sales (demand) and most importantly the relationship between the two and how it affects the price of Calgary Real Estate.  A simple way to keep up to date with how the market is trending and to stay ahead of most! All numbers are taken from the Calgary Real Estate Boards Stats package for Realtors. I have also included some general comments which are simply my opinion.

Absorption Rate (Months of Inventory)   (the inventory divided by the number of sales in the last month). What does this mean you might ask?

Buyer’s Market >4.0 Drives prices down
Balanced Market Between 2.4 to 4.0 Prices typically remain stable
Seller’s Market <2.4 Drives prices up


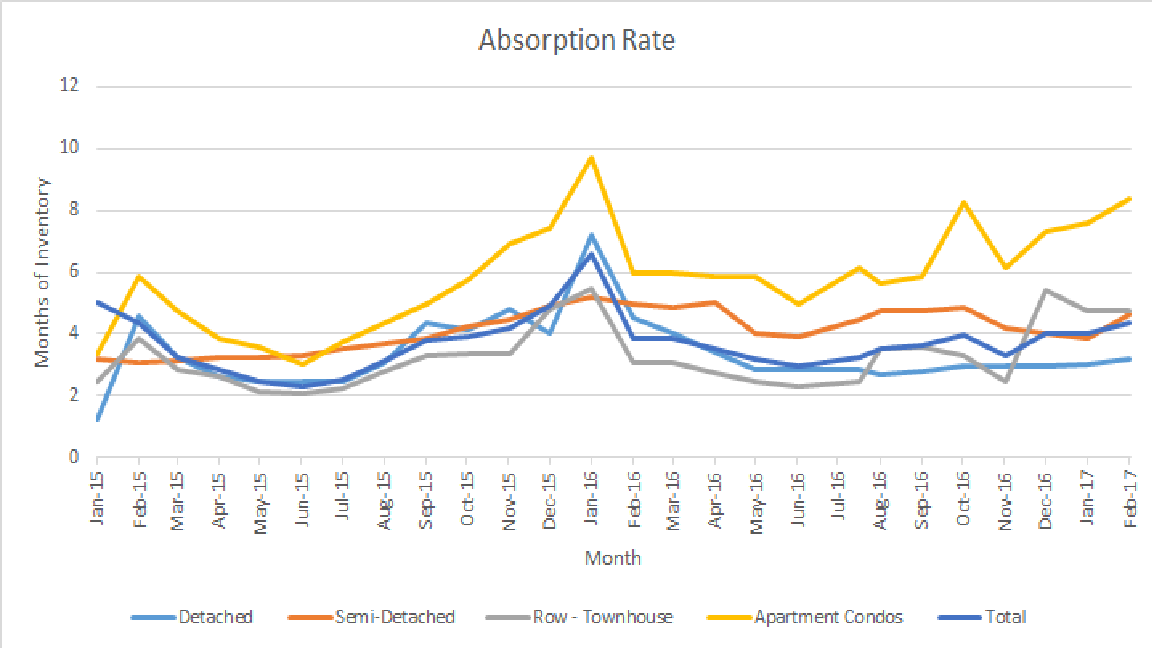
*** Absorption Rate***  

The absorption rate for all of Calgary increased this month meaning listings outpaced sales.   Detached Homes and Row Homes (Townhouses) increased marginally and we saw larger increases in Semi-Detached and apartment condos.

December   2016 January  2017 Change
Detached 3.01 3.17 0.16
Semi Detached 3.83 4.61 0.78
Attached – Row 4.75 4.73 -0.02
Apartment 7.59 8.40 0.81
Total City 4.04 4.34 0.31


Calgary Listing Inventory

January saw an increase of listings over December and this is to be expected as very few people want to list during the holidays.  Normal trends would predict that over the next few months we will continue to see more listings so a further increase in inventory.

Inventory December   2016 January  2017 Change
Detached 1719 1849 130
Semi Detached 368 383 15
Attached – Row 570 610 40
Apartment 1108 1269 161
Total City 3765 4112 347


Calgary Sales:

January saw an increase in sales in all categories except Semi Detached which is down by 13 sales.  This increase is fully expected as there are always more people buying in January than in December. What comes as a surprise to me is that the increase over December is only 14 more sales.  Personally I thought the increase would be more substantial.  The interesting and possibly good news here is that our sales were up 24% from January of 2016.

Calgary Sales   December   2016 January  2017 Change % Change
Detached 571 584 13 2.28%
Semi Detached 96 83 -13 -13.54%
Attached – Row 120 129 9 7.50%
Apartment 146 151 5 3.42%
Total City 933 947 14 1.50%


Calgary Real Estate Sales Prices: 

Prices did not change substantially this month.   Detached homes made the largest gain.  I find it surprising that Apartment Condos gained a little this month.  With such a high absorption rate I would predict apartment condos will lose more in the upcoming months.

  Sales Prices December   2016 Benchmark Price  January  2017 Benchmark Price Change
Detached 498,300 500,400 +2,100
Semi Detached 385,400 384,600 -800
Attached – Row 307,900 307,100 -800
Apartment 269,200 269,900 +700
Total City 435,400 437,400 2,000


Sales Prices “Year to Date”   – Same as Above 


 **Please note that these numbers include on Calgary homes and do change on a community basis and more so for towns.  This report does not include rural properties.  If you would like to find stats on your community just let me know.  If you have any questions about this summary or Real Estate questions please feel free to contact us.


February Calgary Real Estate Market Snapshot

Tuesday, March 1st, 2016

Find out what is really happening in the Real Estate Market. Stay ahead of everyone else by following our Monthly Market Snapshot of the Calgary Real Estate Market. This shows what’s really happening! The market is driven by supply and demand so here we show the inventory (supply) and sales (demand) and most importantly the relationship between the two and how it affects the price of Calgary Real Estate.  A simple way to keep up to date and ahead of most!

Below are the details along with a few comments, all numbers were taken from the Calgary Real Estate Boards Stats package for Realtors.

Calgary Listing Inventory

In February our total inventory of listings in Calgary increased in all 3 categories.  This is very typical for this time of year as many sellers wait until after the holiday season to list their homes.  This seasonal trend should continue for the next few months.

Inventory Jan 2016 Feb 2016 Change
Detached 2546 2943 397
Attached 1223 1336 113
Apartment 1253 1402 149
Total City of Calgary 5022 5681 659


Calgary Sales:

Sales in all categories Increased in February.   This again is seasonal and it’s important to note that this Feb we are 6.63% under sales for Feb 2015.

Sales Jan 2016 Feb 2016 Change % of Change
Detached 465 691 226 48.60%
Attached 170 268 98 57.65%
Apartment 129 168 39 30.23%
Total City of Calgary 764 1127 363 47.51%


Calgary Real Estate Sales Prices:  

Prices for all detached and attached homes showed decreases in February.  Apartment Condos showed a slight increase in price.  This may be because apartment condos have been showing price decreases for several months.


  Sales Prices Jan   2015

Benchmark Price 

Feb  2016

Benchmark Price

Change
Detached 509300 504400 -4900
Attached 345600 338900 -6700
Apartment 281900 283600 1700
Total City of Calgary 447300 445000 -2300


Sales Prices “Year to Date”   

Year to date prices

Sales Prices Dec 31, 2015   Benchmark Price  Feb  2016

Benchmark Price

Change

$

% Change
Detached 508700 504400 -4300 -0.85%
Attached 351400 338900 -12500 -3.56%
Apartment 285500 283,600 -1,900 -0.67%
Total City of Calgary 448800 445000 -3800 -0.85%


Absorption Rate (Months of Inventory)   (the inventory divided by the number of sales in the last month). What does this mean you might ask?

Buyer’s Market >4.0 Drives prices down
Balanced Market Between 2.8 to 4.0 Prices typically remain stable
Seller’s Market <2.8 Drives prices up


*** Absorption Rate***   

In my opinion this is the most critical number to look at.  Of interest the trend reversed this month.  The last several months our Absorption rate has been increasing and this is the first time in several months that it decreased.  Does this mean the market has changed – I would not be so quick and would suggest that one month does not make a trend so let’s watch.

Absorption Rate   Jan   2015 Feb  2016 Change
Detached 5.48 4.26 -1.22
Attached 7.19 4.99 -2.21
Apartment 9.71 8.35 -1.37
Total City of Calgary 6.57 5.04 -1.53


Price Sensitivity

It is also important to note that homes in the lower price ranges are still moving much quicker than homes in the higher price ranges.

**Please note that these numbers do change on a community basis and more so for towns.  This report does not include rural properties.  If you would like to find stats on your community just let me know.  If you have any questions about this summary or Real Estate questions please feel free to contact us.

If you know anyone else who might enjoy seeing our monthly summary please share.

TSW Real Estate Group

Calgary Real Estate Market Snapshot Sept 2014

Friday, October 3rd, 2014

Stay ahead of the curve by following our Monthly Market Snapshot of the Calgary Real Estate Market.  This shows what’s really happening in the Calgary Real Estate Market.  The market is driven by supply and demand so here we show the inventory (supply) and sales (demand) and the effect on the price of Calgary Real Estate.   A simple way to keep up to date and ahead of most!  The Calgary housing market is deeply  entrenched is a Sellers Market however is slowly changing and is moving toward a balanced market.

Below are the details along with a few comments, all numbers were taken  from the Calgary Real Estate Boards Stats package for Realtors.

Want to see stats specific to your Community?  Register for our Market Report at http://www.calgaryareasolds.com/


Calgary Listing Inventory: Inventory levels for Single Family homes decreased while everything else increased this month. Typically this time of year we show increases in inventory. Single family home inventory went down which is not normal. I believe the reason is that we still have a large backlog of buyers waiting for the perfect home to come on the market, especially in the starter home price range.


Inventory Aug 2014 Sept 2014     Change
Single Family Home 3021 2961 -60
Condo Townhouse 437 552 +115
Condo Apartment 1056 1081 +25
Total 4514 4594 +80


Calgary Sales:

Sales in September decreased marginally in all categories. Sales numbers decreasing is very normal at this time of year.  It is critical to note that even though the sales are decreasing we are still substantially above our sales for 2013.

Sales Aug 2014 Sept 2014     Change % Change
Single Family Home 1477 1398 -79 -5.3
Condo Townhouse 338 318 -20 -5.9
Condo Apartment 452 432 -20 -4.4
Total 2267 2148 -119 -5.2


Calgary Real Estate Sales Prices:

In September, the benchmark price increased for all categories. Based on the inventory change, prices are likely to increase moderately for a few more months as we move from a seller’s market to a more balanced market. If you have been following my reports you will notice the increases are continuing to get smaller every month.

Sales Prices Aug 2014 Benchmark Price Sept   2014   Benchmark Price Change
Single Family Homes 512,300 512,800 +500
Condo Townhouse 328,300 330,200 +1900
Condo Apartment 298,200 298,800 +600


Sales Prices “Year to Date”

Year to date prices – Prices have increased in all categories. Good news if you are a homeowner.

Sales Prices Dec 31 2013 Benchmark Price Sept 2014 Benchmark Price Change$ % Change
Single Family Homes 472,200 512,800 +40,600 +8.6
Condo Townhouse 307,100 330,200 +23,100 +7.5
Condo Apartment 278,600 298,800 +20,200 +7.3


Absorption Rate (Months of Inventory)  (the inventory divided by the number of sales in the last month). What does this mean you might ask?

Buyer’s Market >4.0
Balanced Market Between 2.8 to 4.0
Seller’s Market <2.8


Absorption Rate:

This month the absorption rate increased in all categories. For Single Family homes the ratio went up even though our inventory decreased – this is because sales decreased more. Condo Townhouses took the largest jump of .45, I believe this is just catching up as last month it went opposite of everything else.

Absorption Rate Aug 2014 Sept 2014   Change
Single Family Homes 2.05 2.11 +.06
Condo Townhouse 1.29 1.74 +.45
Condo Apartment 2.33 2.50 +.17
Total Calgary 1.99 2.14 +.15


**Please note that these numbers do change on a community basis and more so for towns. If you would like to find stats on your community just let me know. If you have any questions about this summary, the attached stats package or any Real Estate questions please feel free to contact us.


If you know anyone else who might enjoy seeing our monthly summary please feel free to share

July 2014, Calgary Real Estate Market Snapshot

Monday, August 4th, 2014

Stay ahead of the curve by following our Monthly Market Snapshot of the Calgary Real Estate Market.  This shows what’s really happening in the Calgary Real Estate Market.  The market is driven by supply and demand so here we show the inventory (supply) and sales (demand) and the effect on the price of Calgary Real Estate.   A simple way to keep up to date and ahead of most!  The Calgary housing market is deeply  entrenched is a Sellers Market with very little supply and strong demand.  In July we started seeing a slight shift towards a buyers market but we have a long way to go.

Below are the details along with a few comments, all numbers were taken  from the Calgary Real Estate Boards Stats package for Realtors.

Want to see stats specific to your Community?  Register for our Market Report at http://www.calgaryareasolds.com/


Calgary Listing Inventory: Inventory levels decreased for single family homes and stayed flat for townhouses and condos. Normally our inventory would show a much higher increase in July. I speculate the reason is that we still have a large backlog of buyers waiting for the perfect home to come on the market. I am surprised that the levels did not increase more than they did.

Inventory June 2014 July 2014 Change
Single Family Home 3128 3056 -72
Condo Townhouse 523 536 +13
Condo Apartment 1071 1070 -1
Total 4722 4662 -60


Calgary Sales:

Sales in July decreased in all categories. Sales numbers decreasing is very normal at this time as people start to go on summer vacations and the city shuts down for the Stampede. No surprises here.

Sales June 2014     July 2014 Change % Change
Single Family Home 1769 1553 -216 -12.2
Condo Townhouse 427 339 -88 -20.6
Condo Apartment 474 444 -30 -6.3
Total 2670 2336 -334 -12.5


Calgary Real Estate Sales Prices:

In June, the benchmark price increased for all categories. Based on the inventory change, prices are likely to increase for a few more months as we move from a seller’s market to a more balanced market. If you have been following my reports monthly the increase is smaller than what we have been seeing.

Sales Prices June 2014     Benchmark Price July 2014

Benchmark Price

Change
Single Family Homes 509,700 511,600 +1900
Condo Townhouse 326,000 327,000 +1,000
Condo Apartment 299,700 298,100 -1,600


Sales Prices “Year to Date”

Year to date prices – same as above, Prices have increased in all categories. Good news if you are a homeowner.

Sales Prices Dec 31 2013 Benchmark Price July 2014     Benchmark Price Change

$

% Change
Single Family Homes 472,200 511,600 +39,400 +8.3
Condo Townhouse 307,100 327,000 +19,900 +6.5
Condo Apartment 278,600 298,100 +19,500 +7.00


Absorption Rate (Months of Inventory)  (the inventory divided by the number of sales in the last month). What does this mean you might ask?

Buyer’s Market >4.0
Balanced Market Between 2.8 to 4.0
Seller’s Market <2.8


Absorption Rate: For the fourth month in a row our absorption rate has increased. This indicates that the market is changing and we are moving towards a balanced market with apartment condos leading the way. Please note that we are so deep in a Seller’s market that it will take us a few more months of this trend to reach a balanced market. My prediction is that this trend will continue and by September or October we will be approaching a balanced market – sooner for apartment condos.

Absorption Rate June 2014   July 2014   Change
Single Family Homes 1.77 1.97 +.2
Condo Townhouse 1.22 1.58 +.36
Condo Apartment 2.26 2.40 +.14
Total Calgary 1.77 1.99 +.22

**Please note that these numbers do change on a community basis and more so for towns. If you would like to find stats on your community just let me know. If you have any questions about this summary, the attached stats package or any Real Estate questions please feel free to contact us.