What is really happening in the Calgary Real Estate Market?
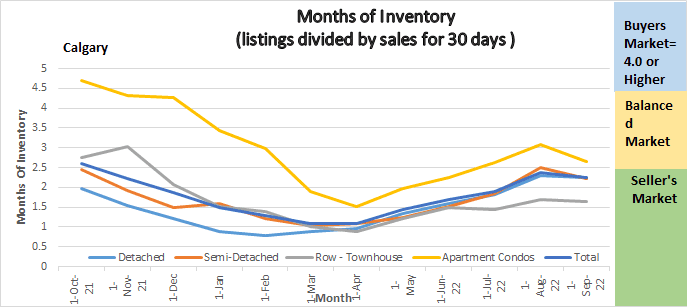
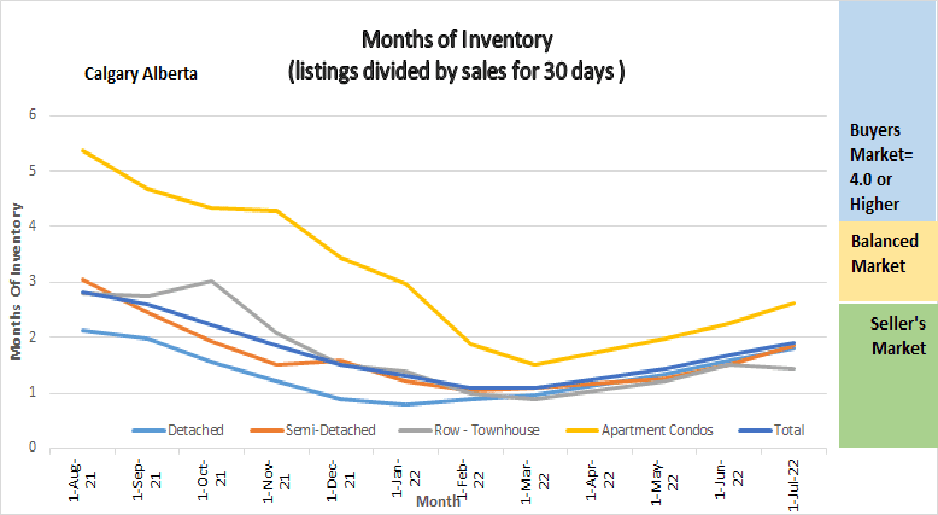
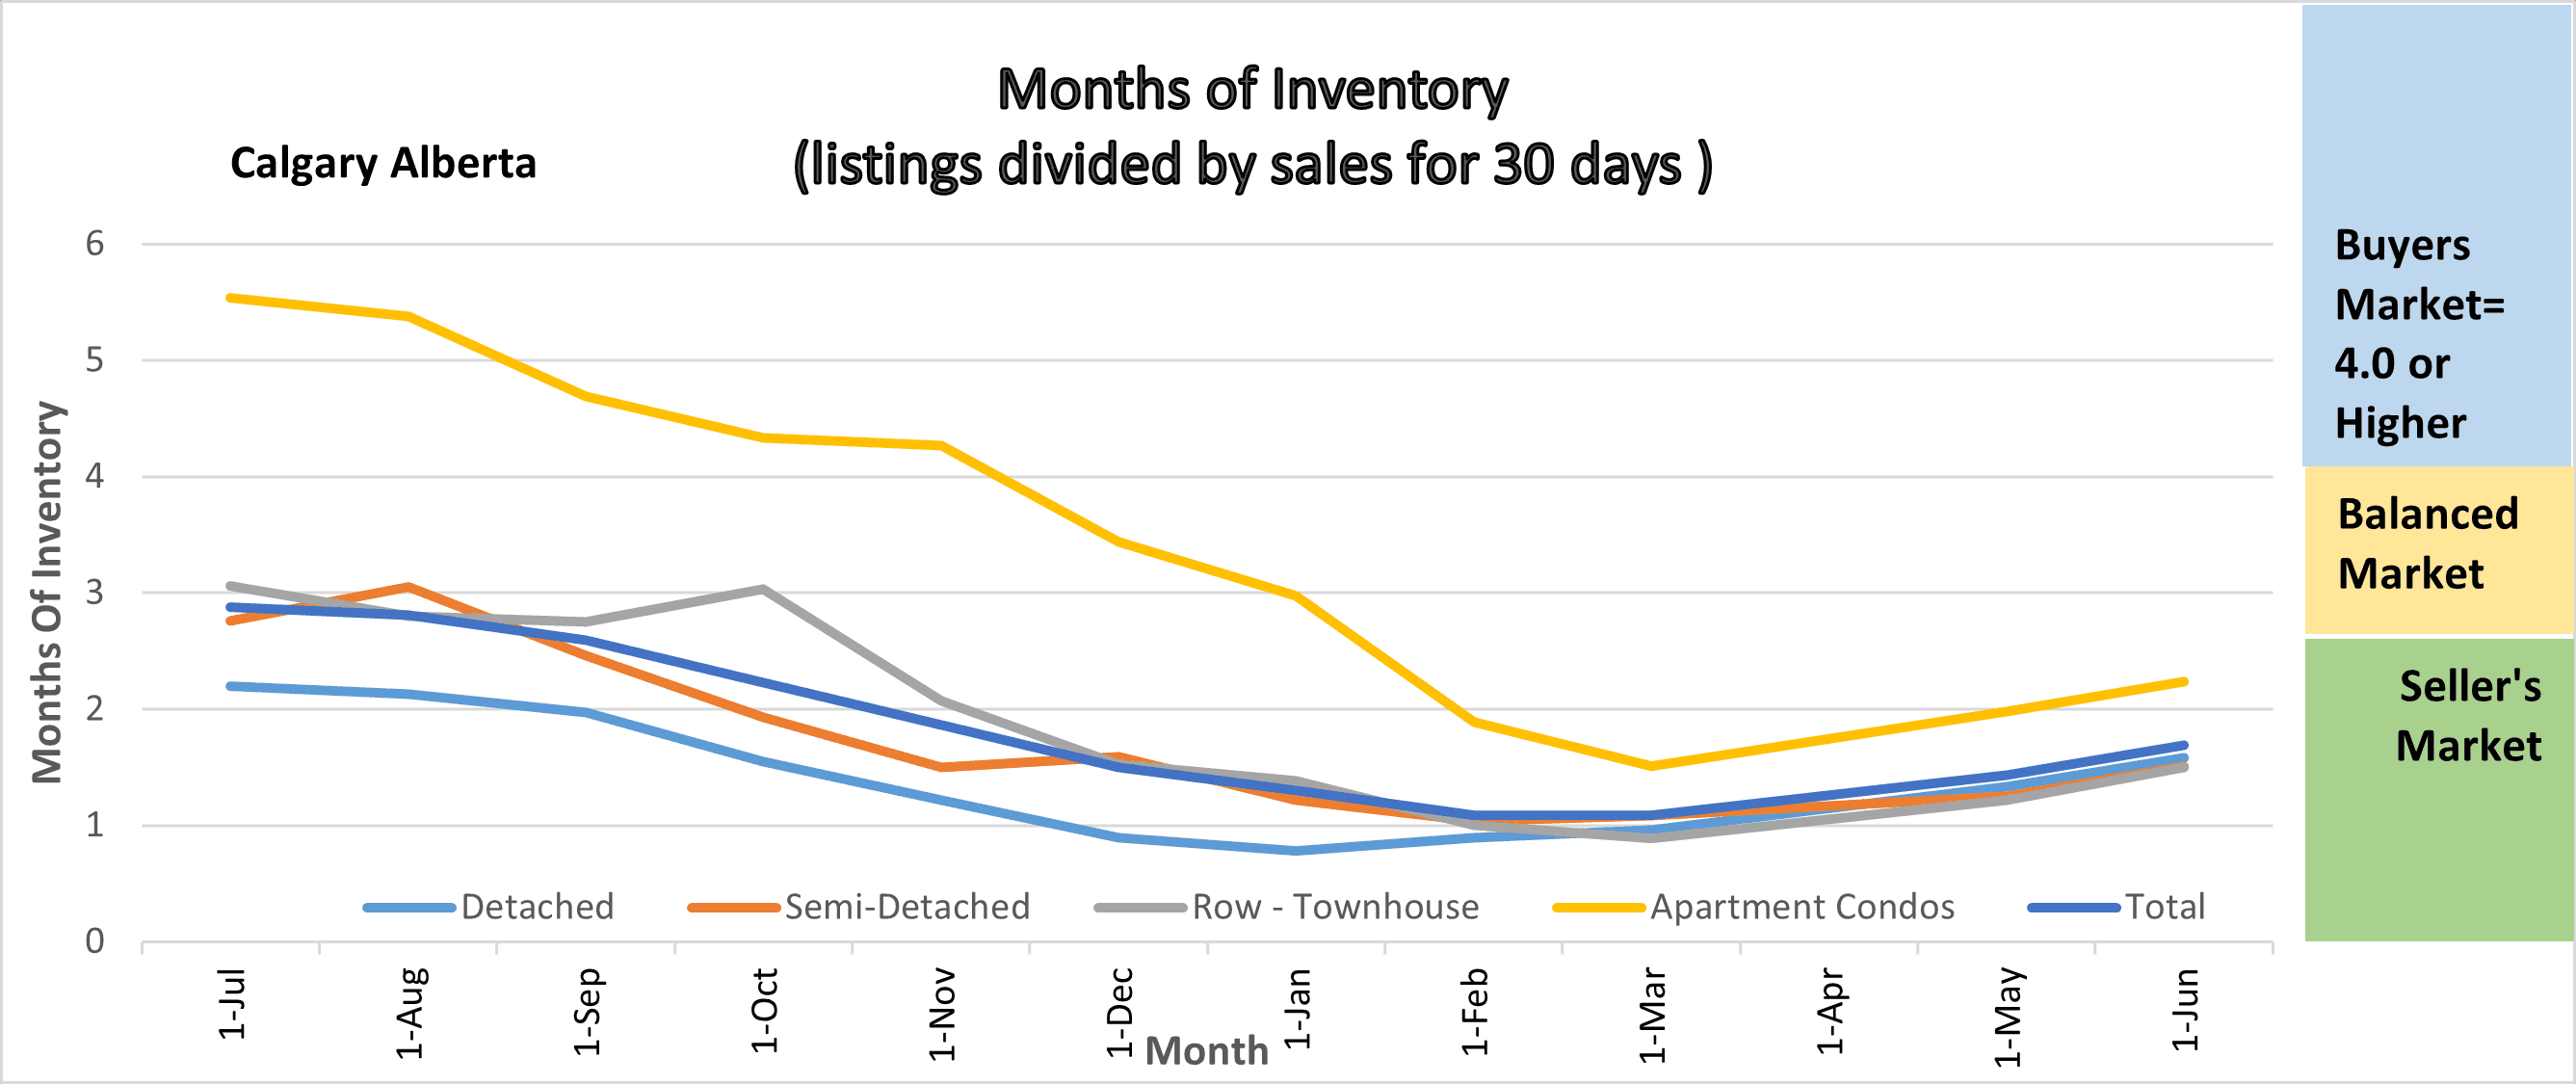
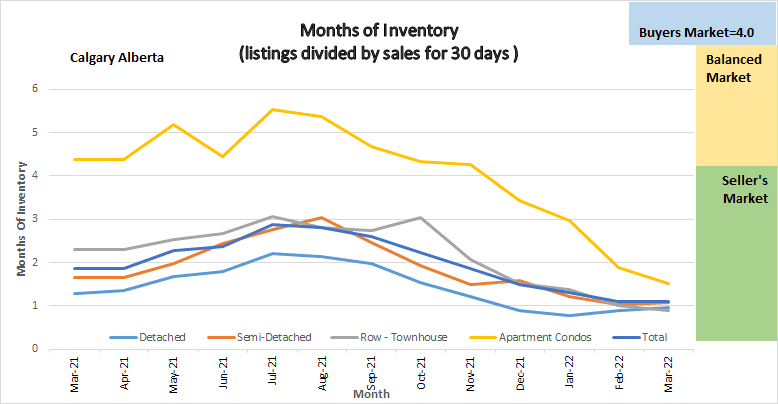
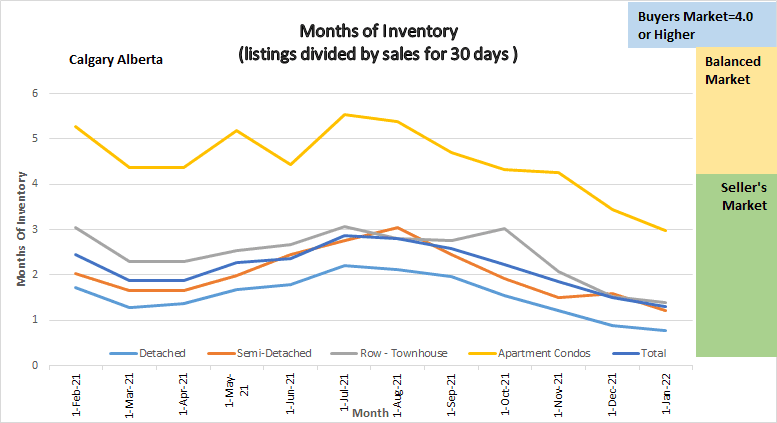
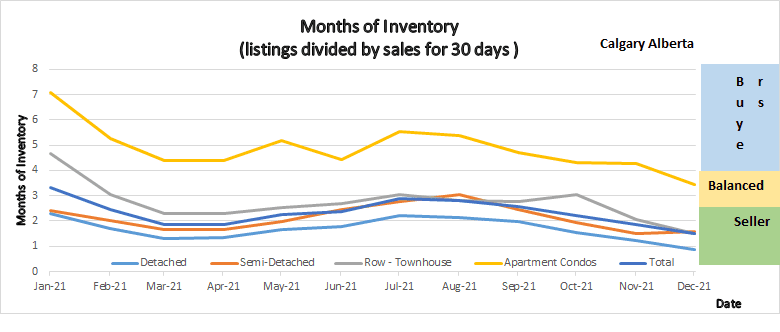
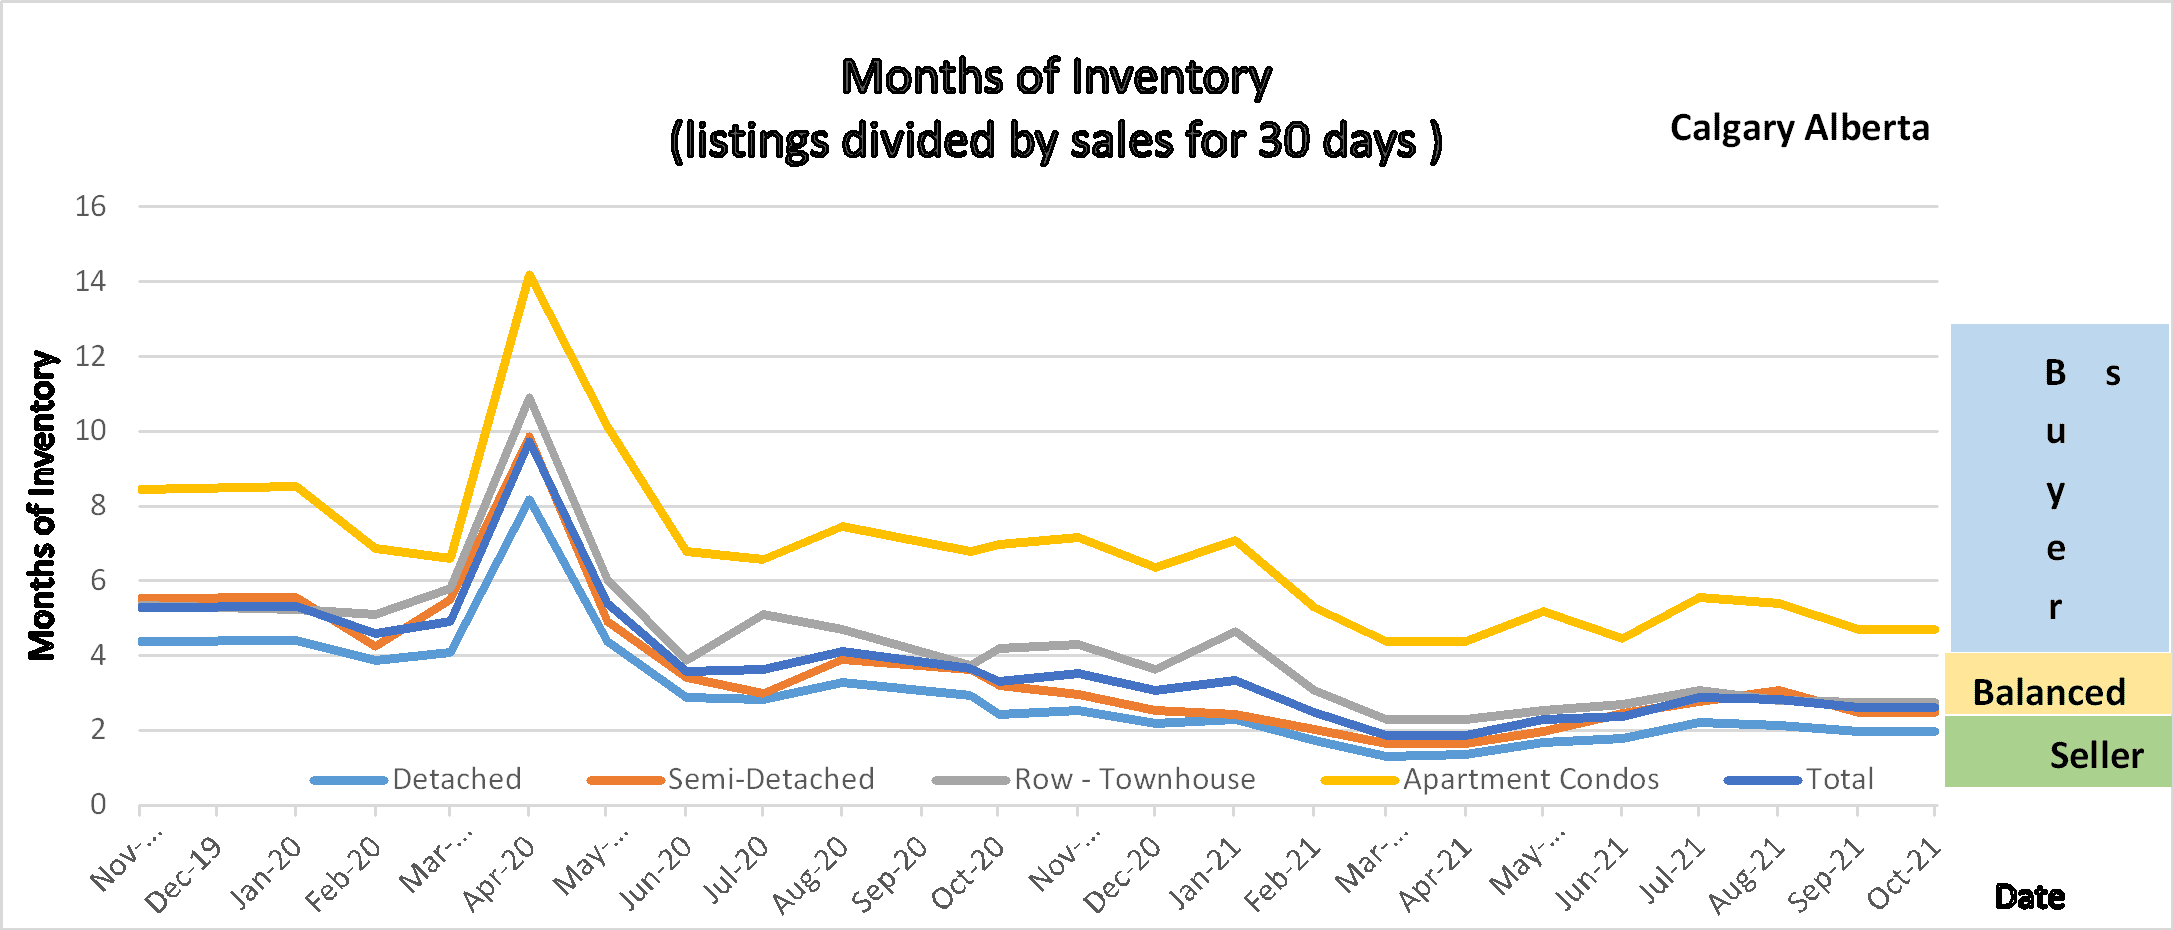
Following is a graph that shows the months of inventory for each housing sector. Looking at a one-year trendline gives you an indication of where things are really heading.
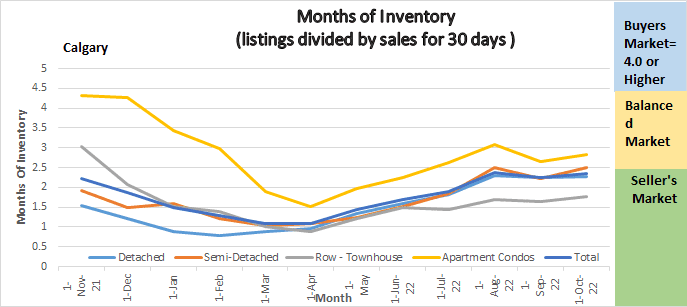
Months of Inventory Trendline
Gord’s commentary for the month (just my opinion).
August 2022 Highlights
I find it extremely interesting that while the numbers say we are clearly in a Sellers Market, on the street buyers are acting like we are in a Buyers market.
- Inventory and sales declined a little
- Benchmark price declined slightly
- Months of Inventory increased but by very little.
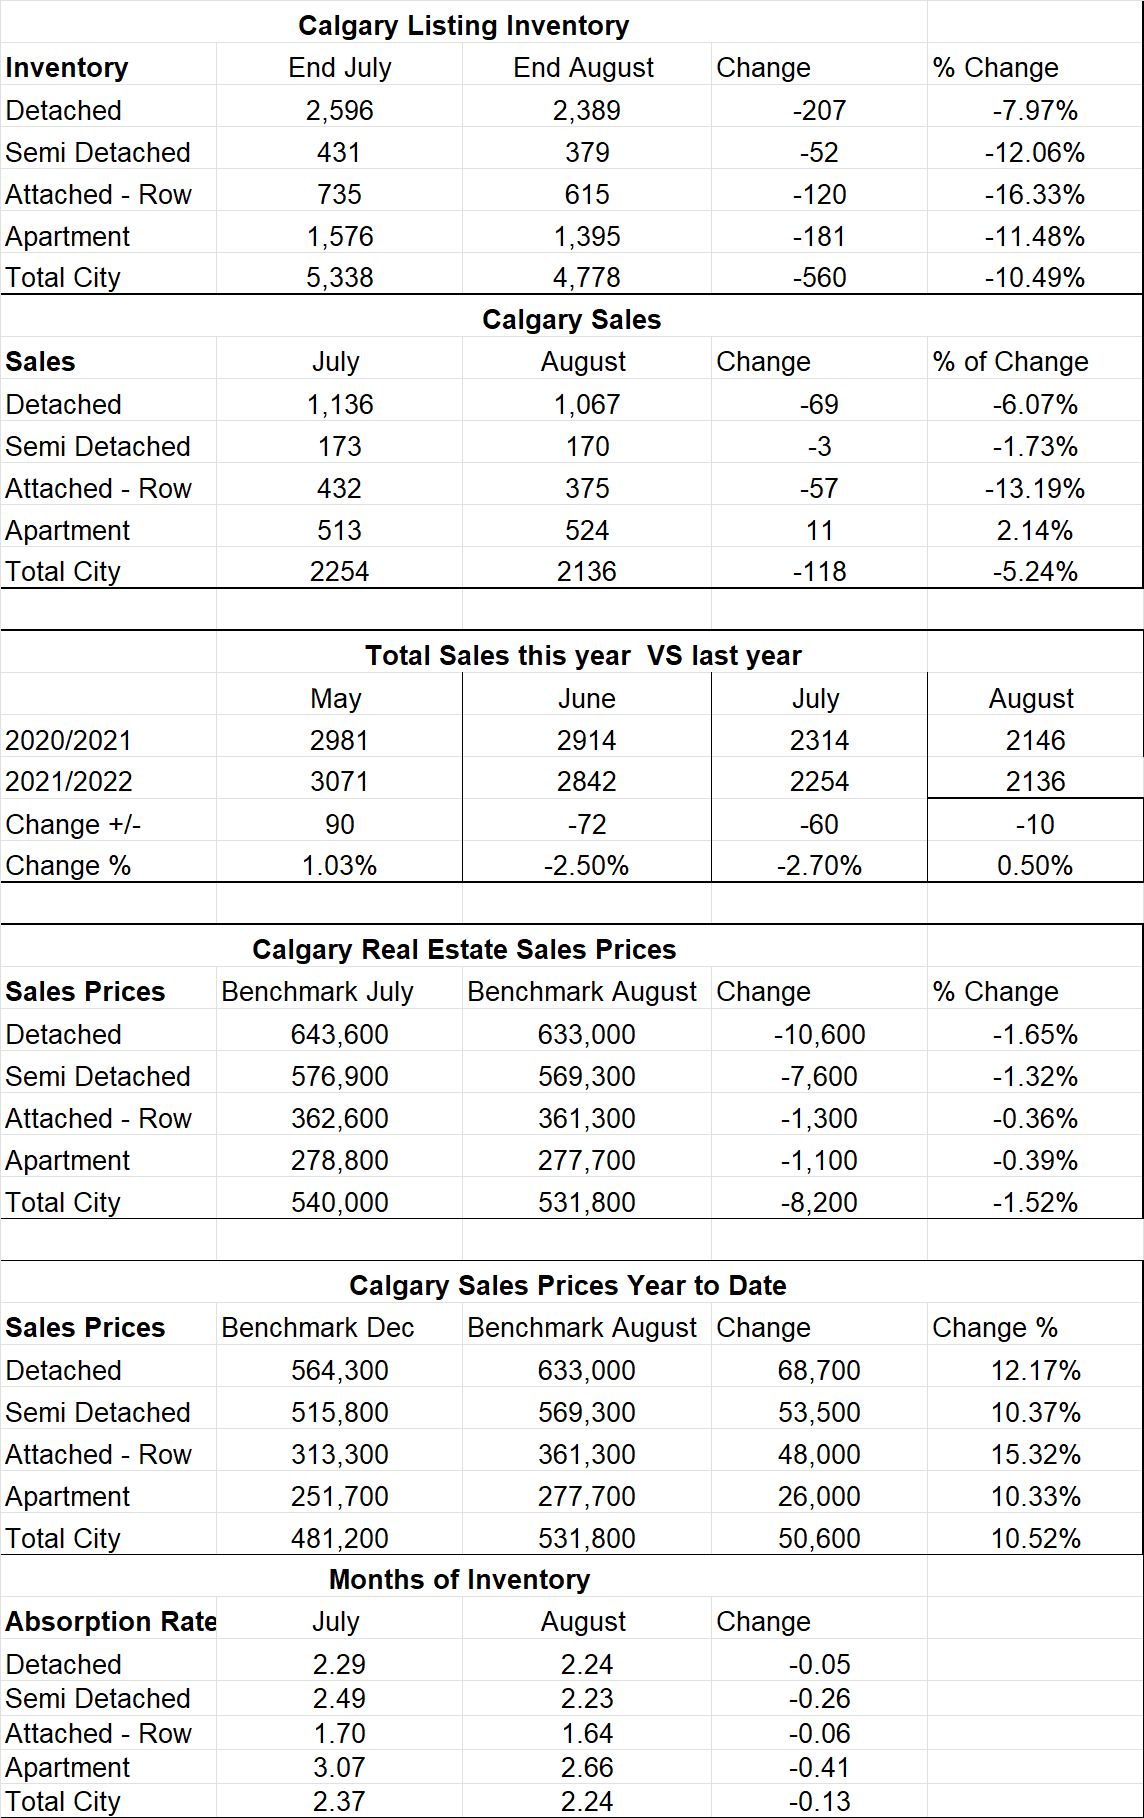
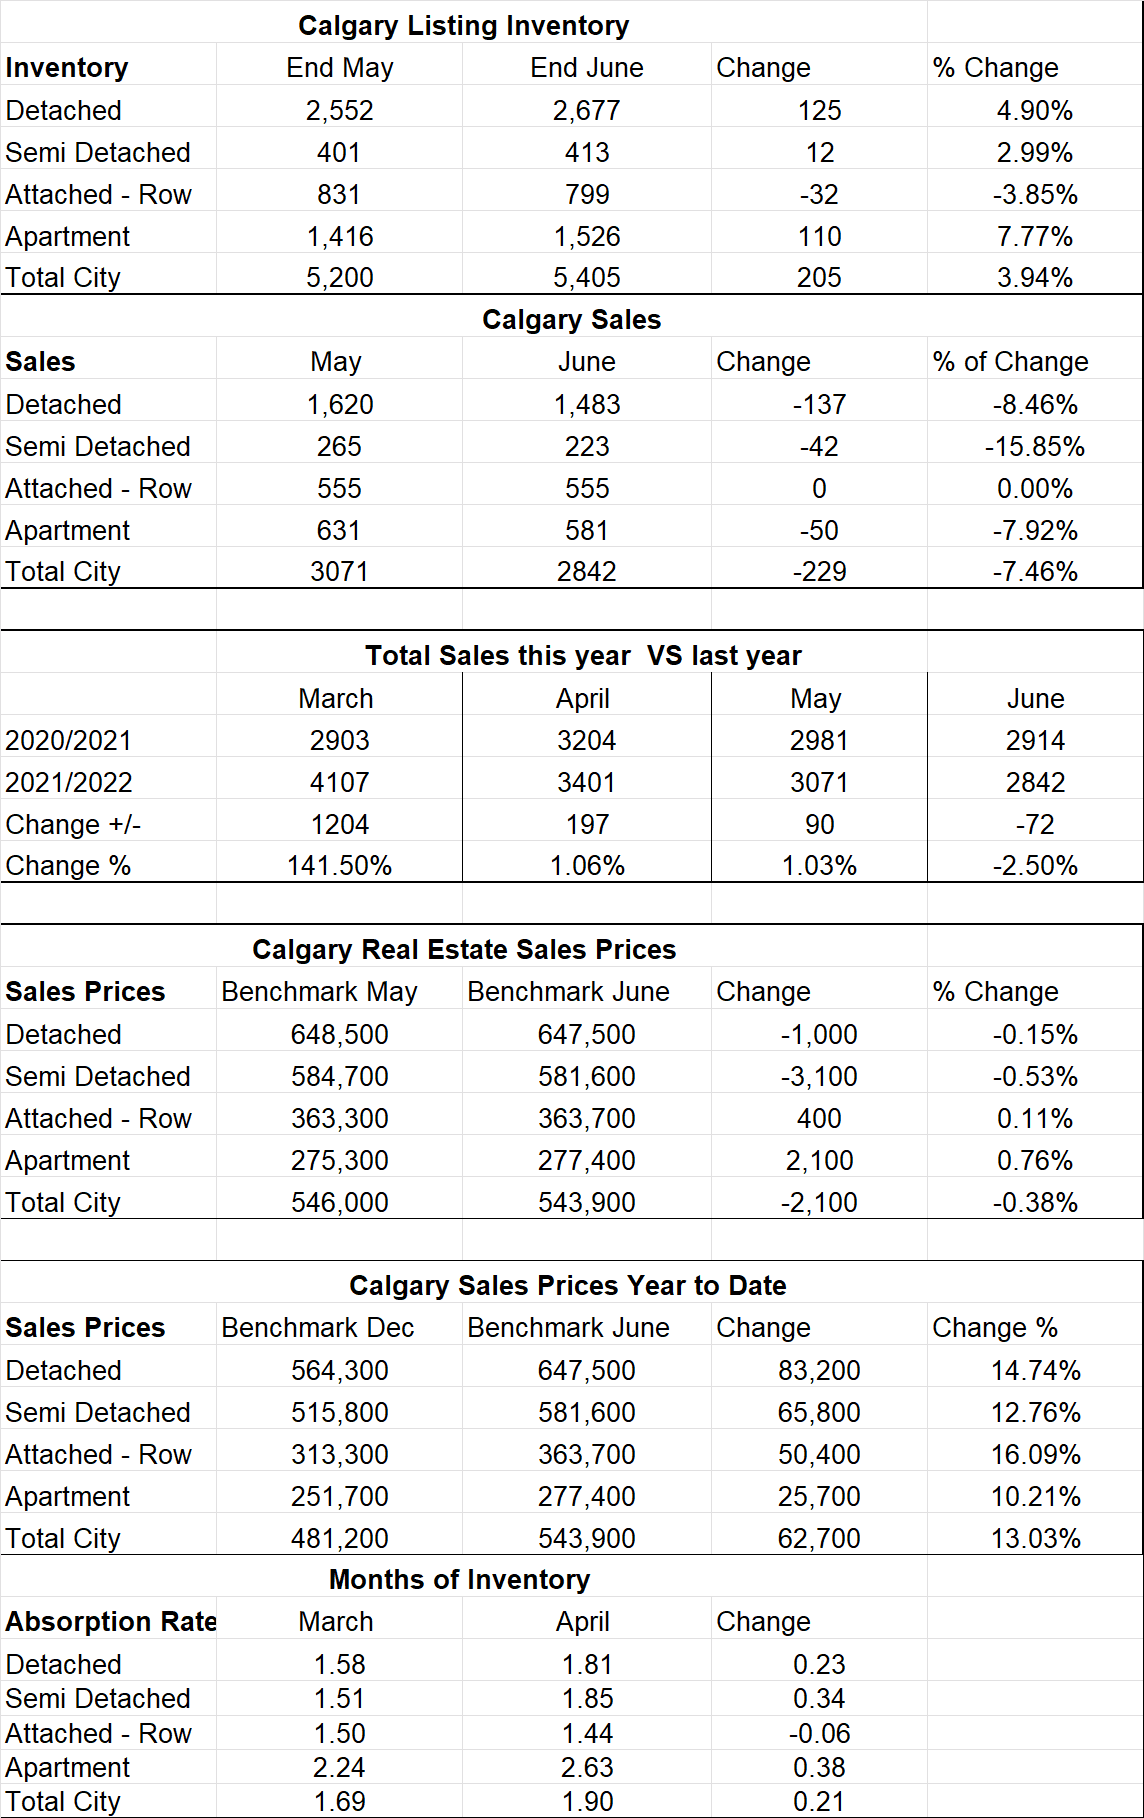
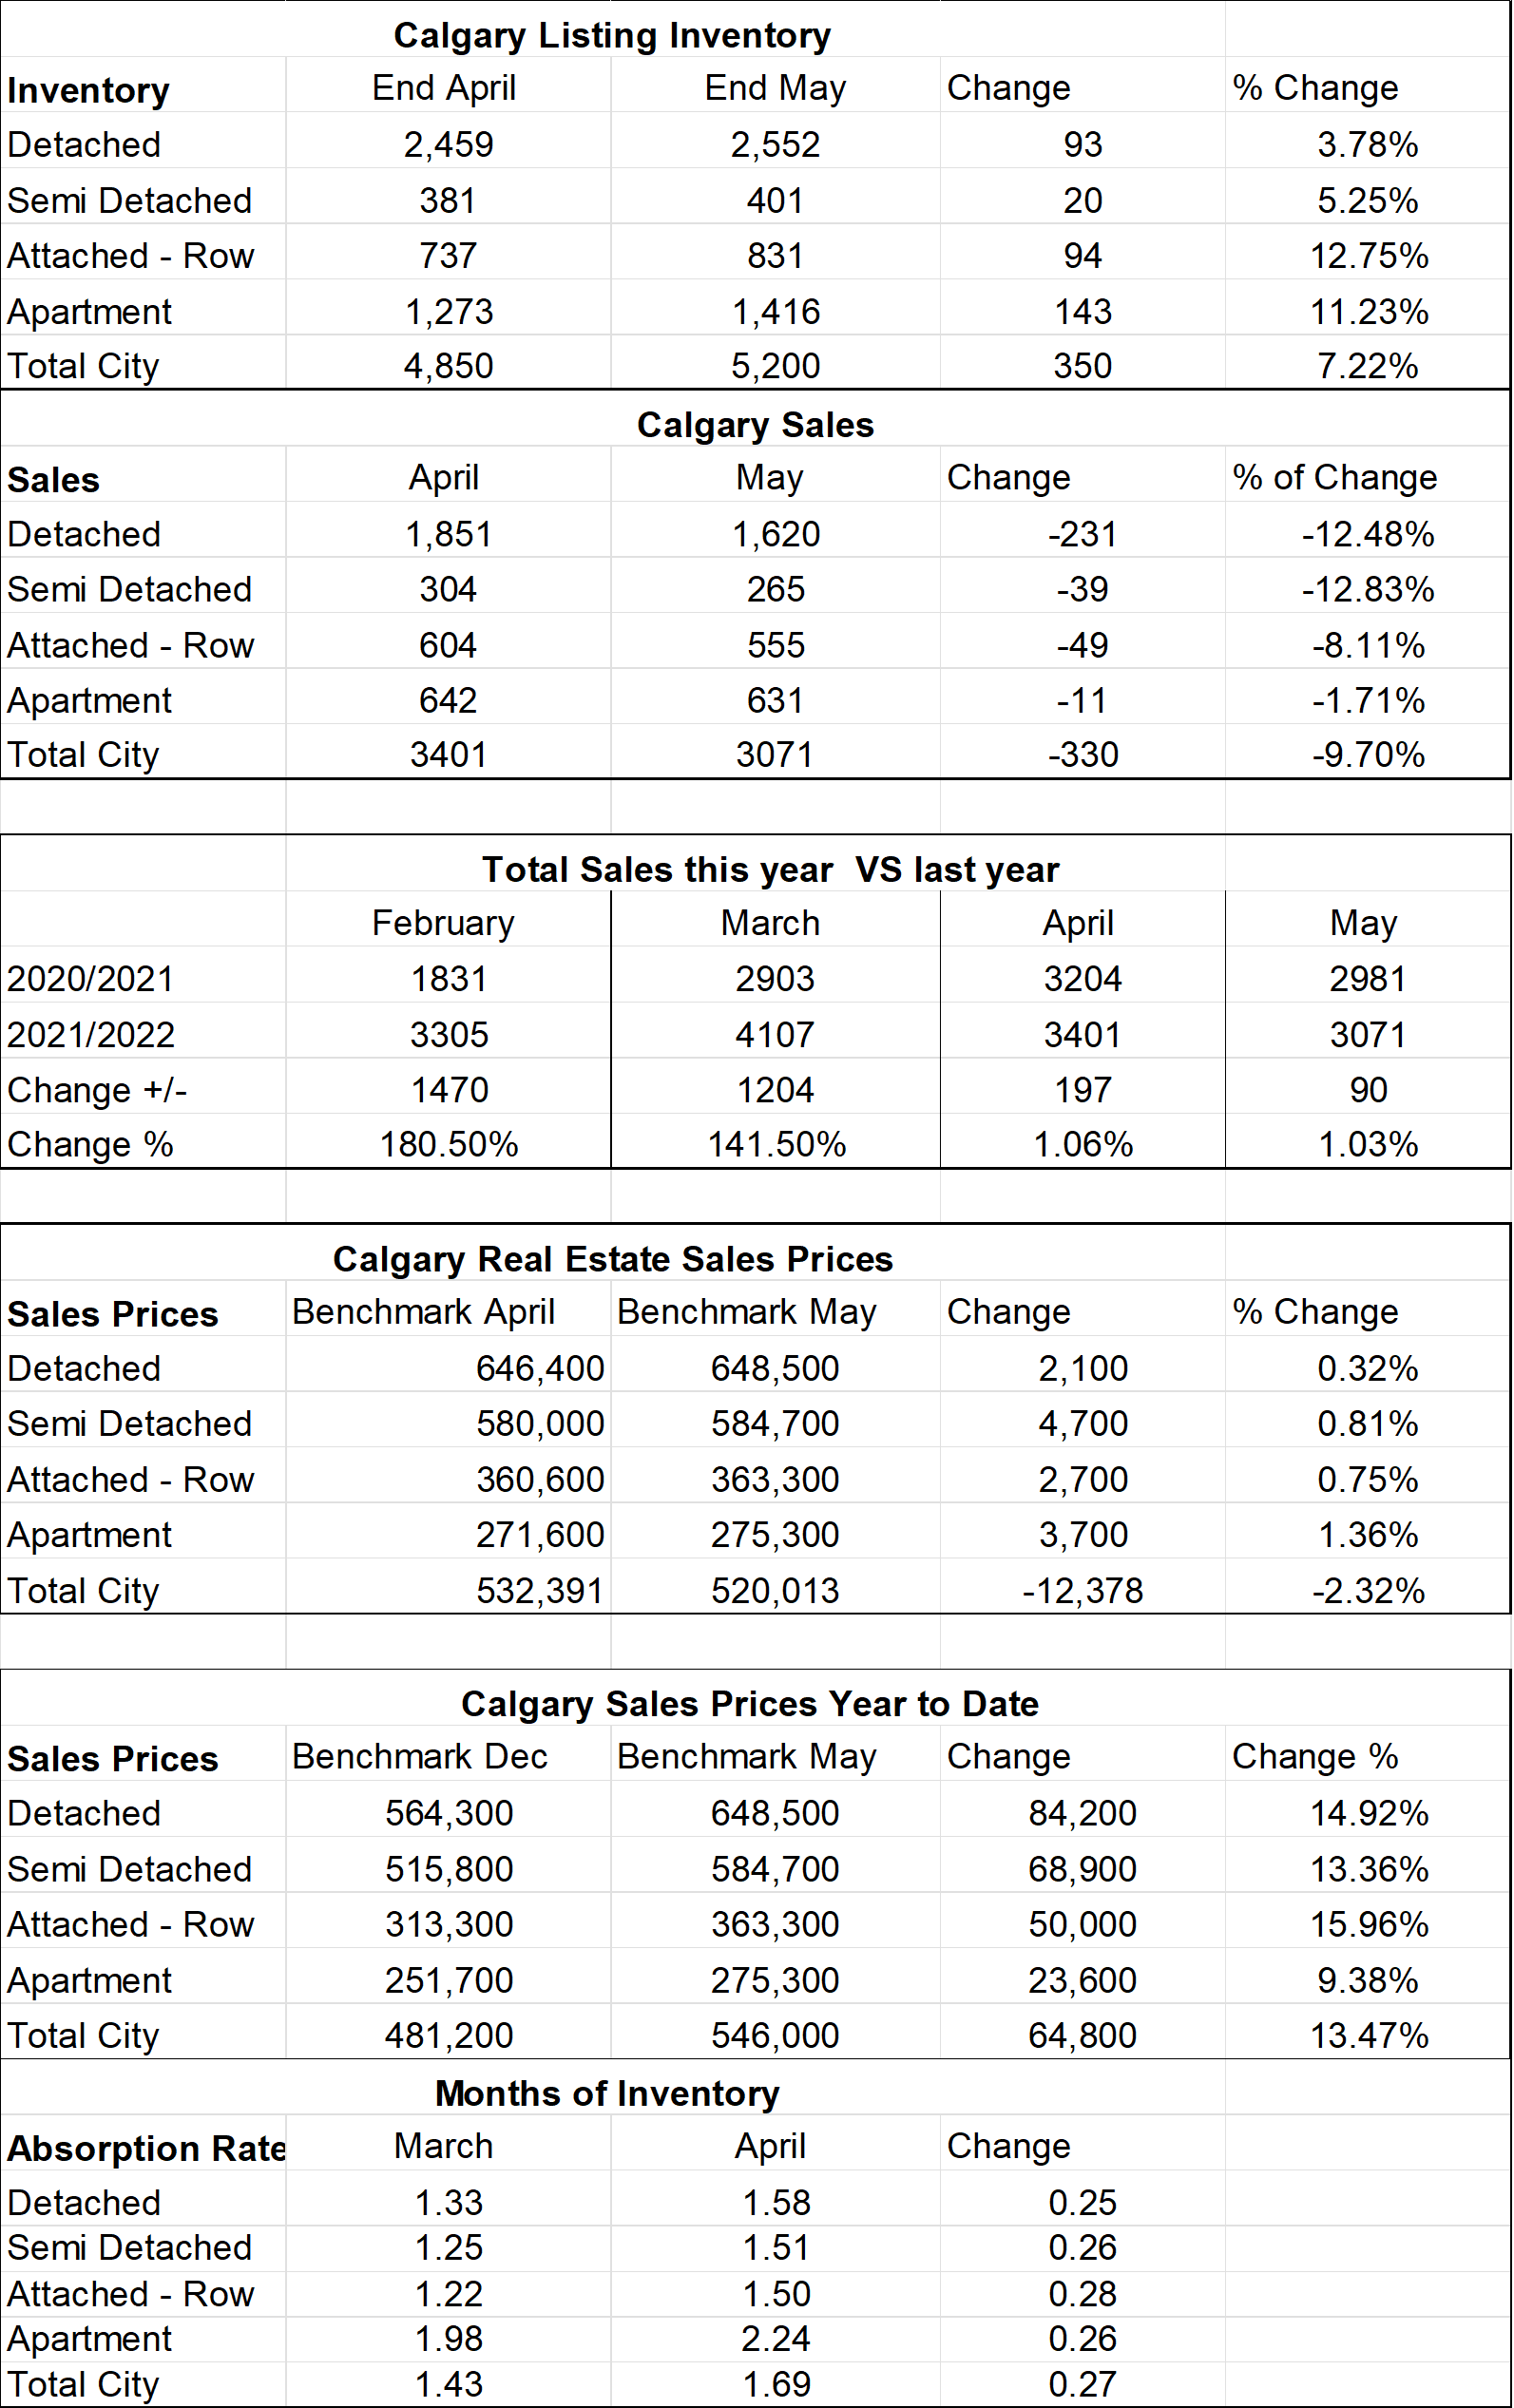
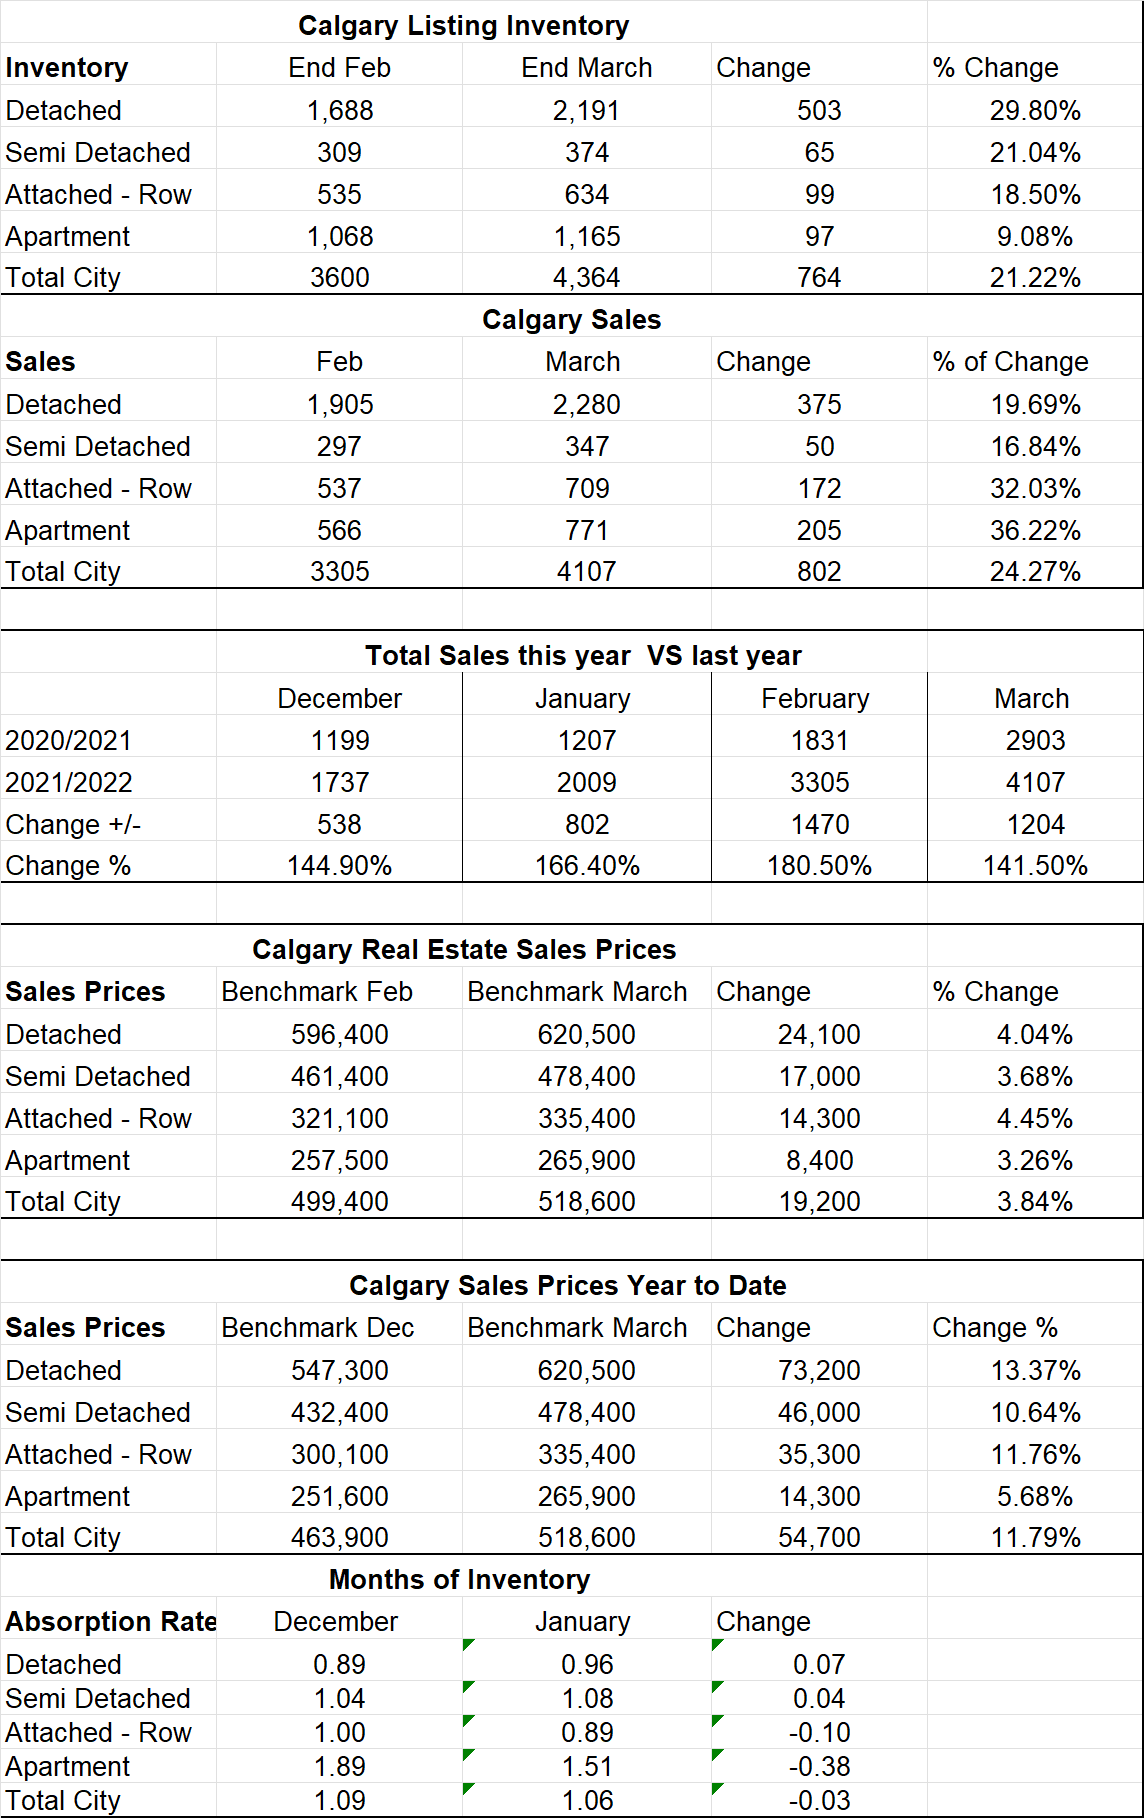
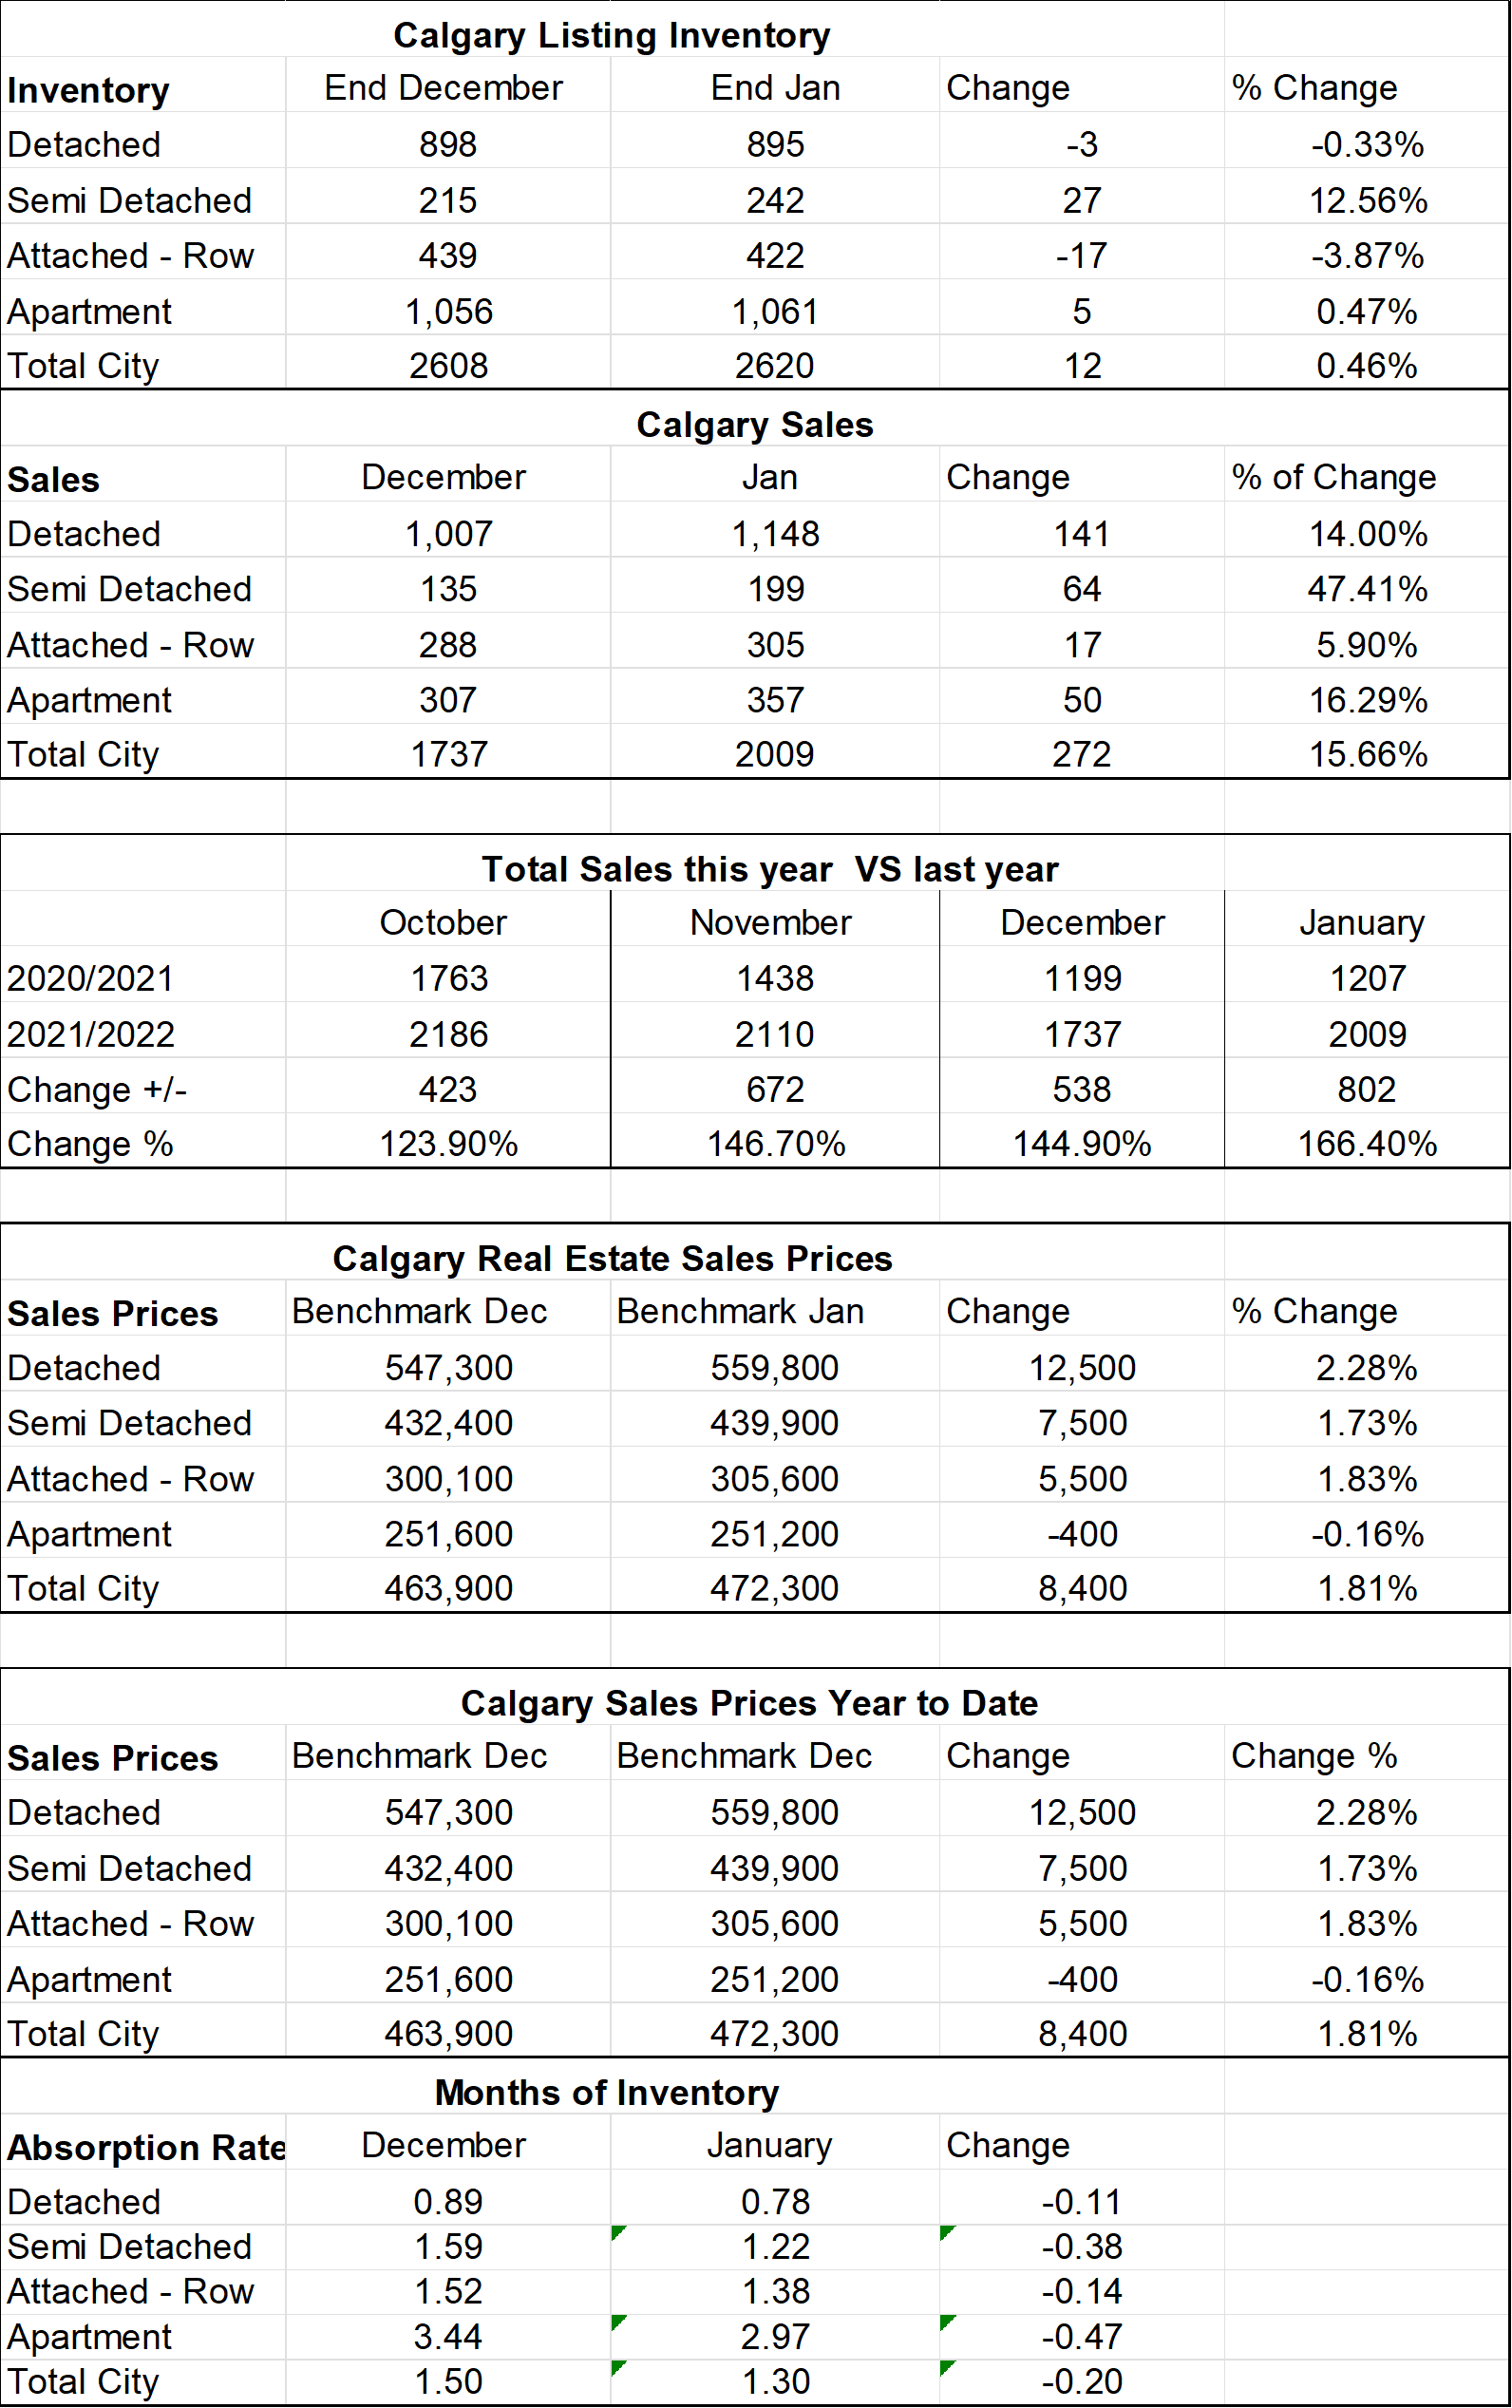
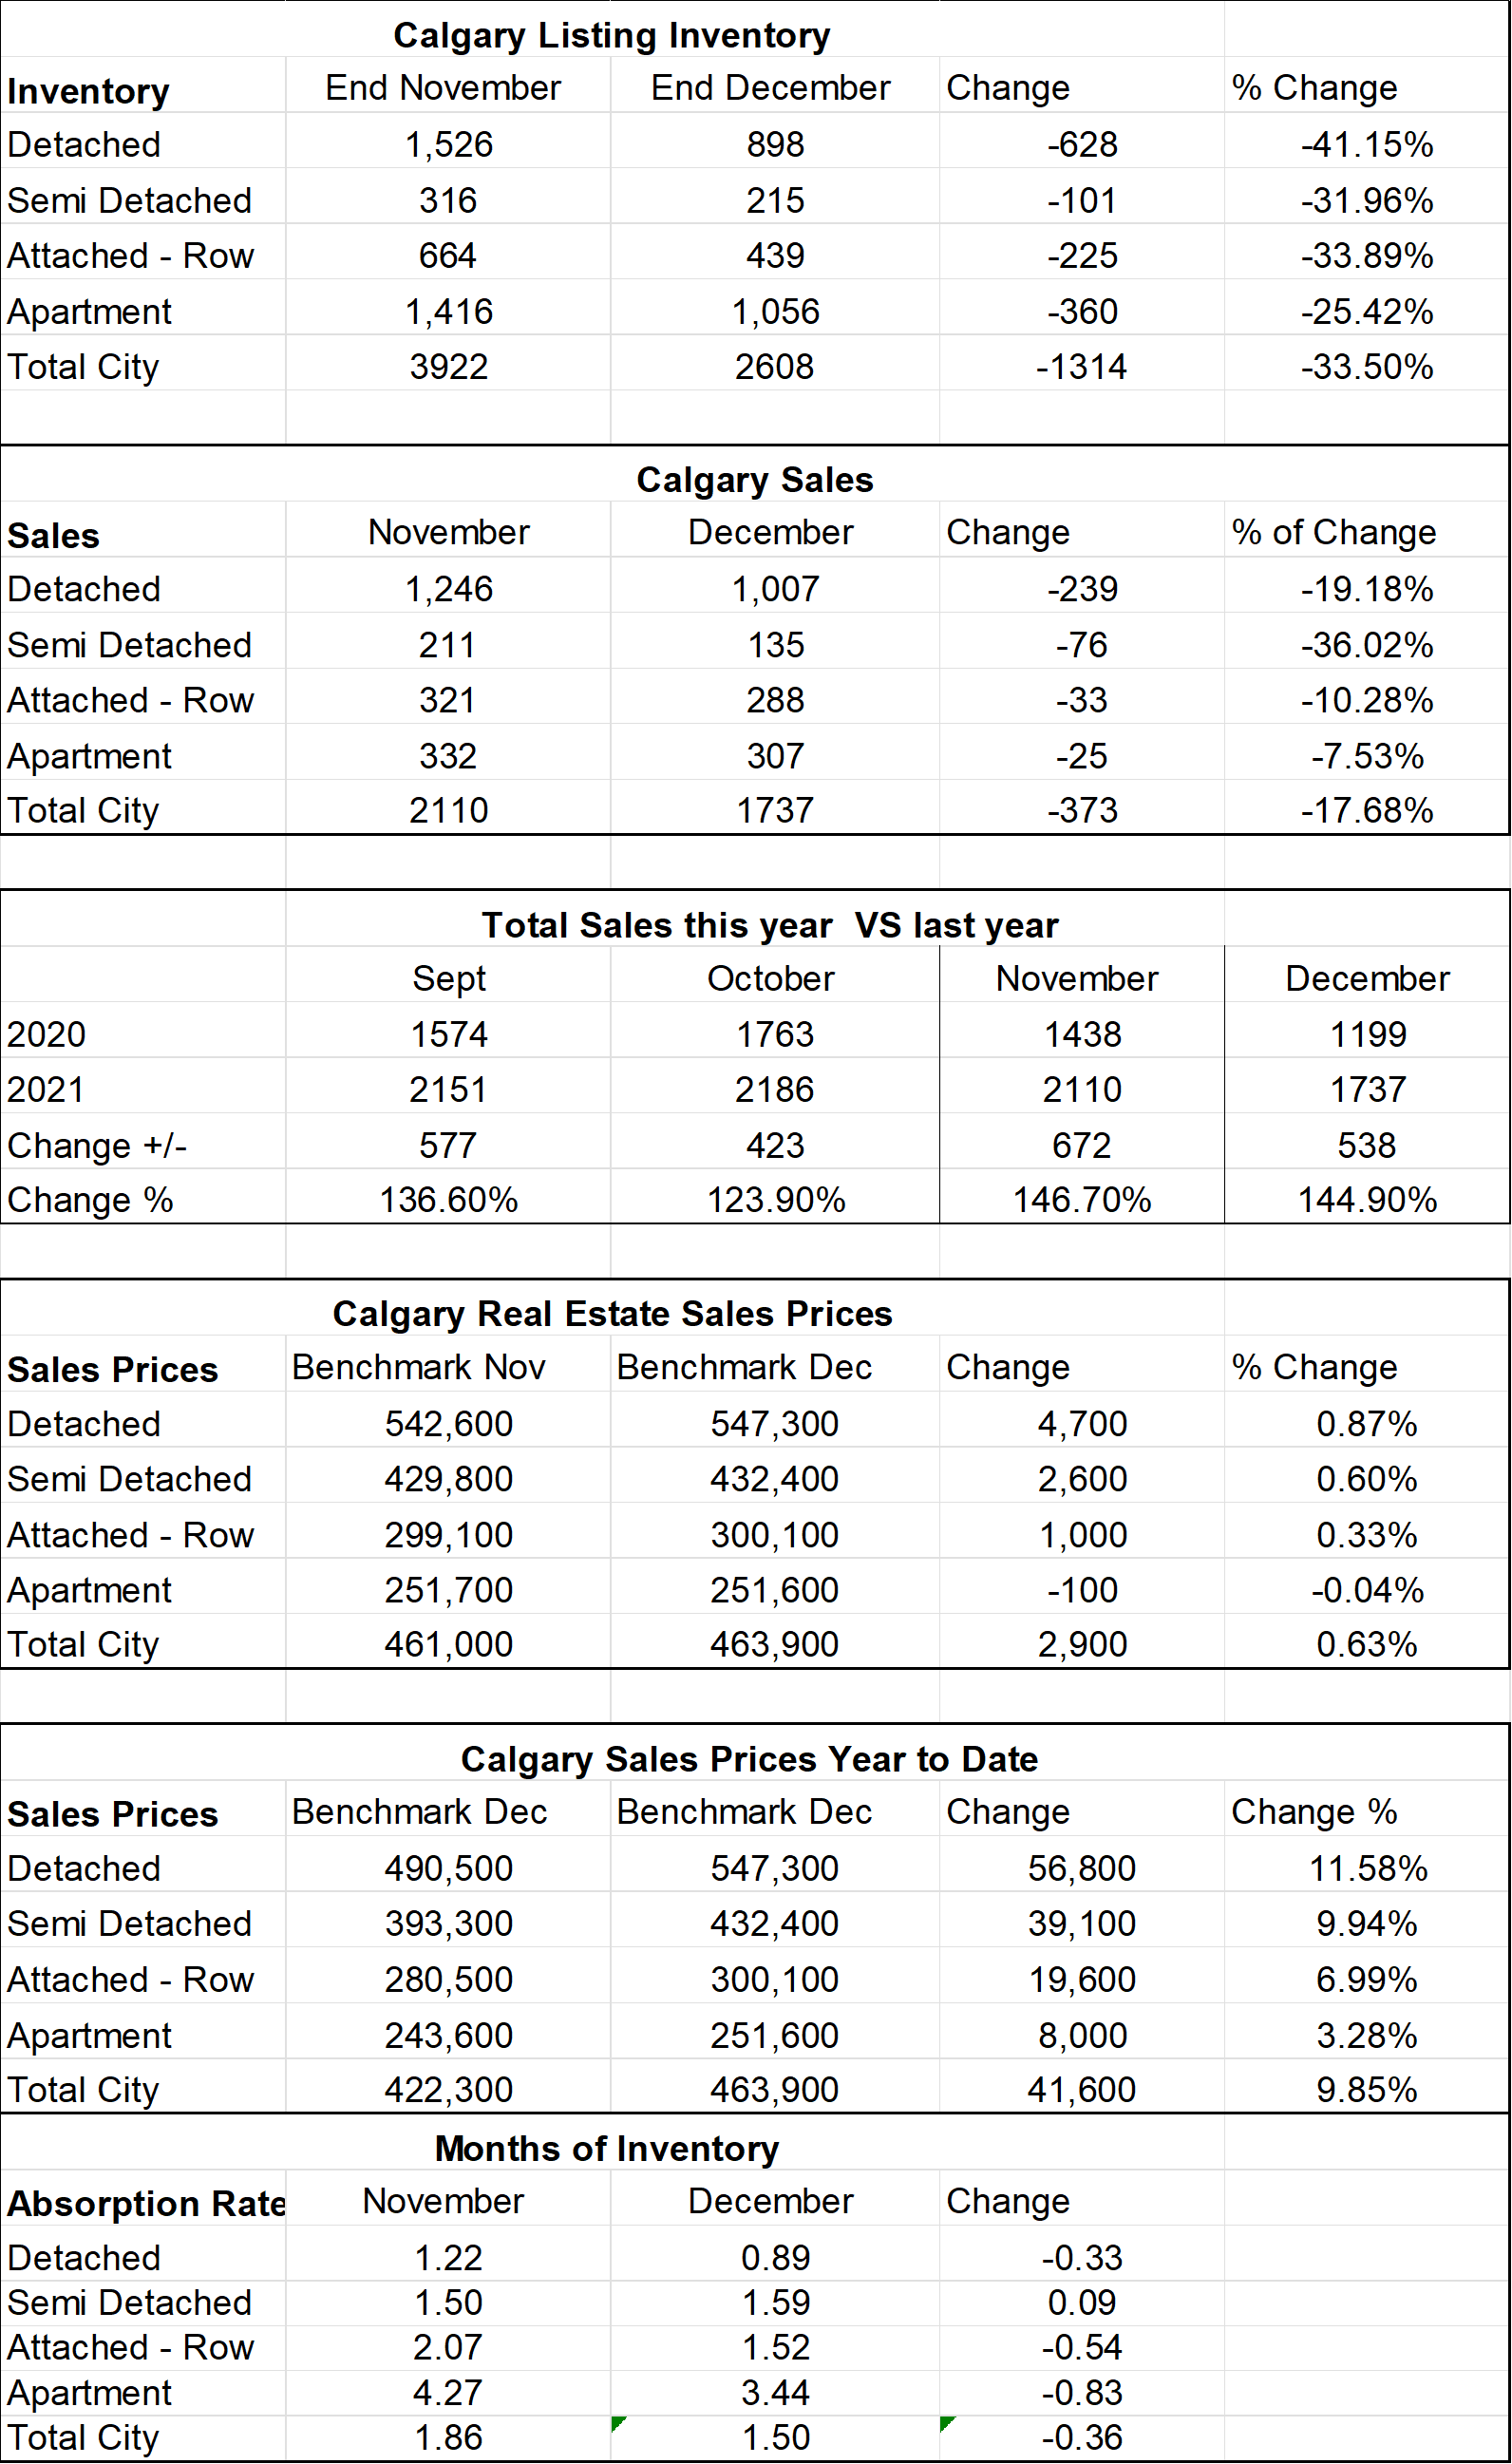
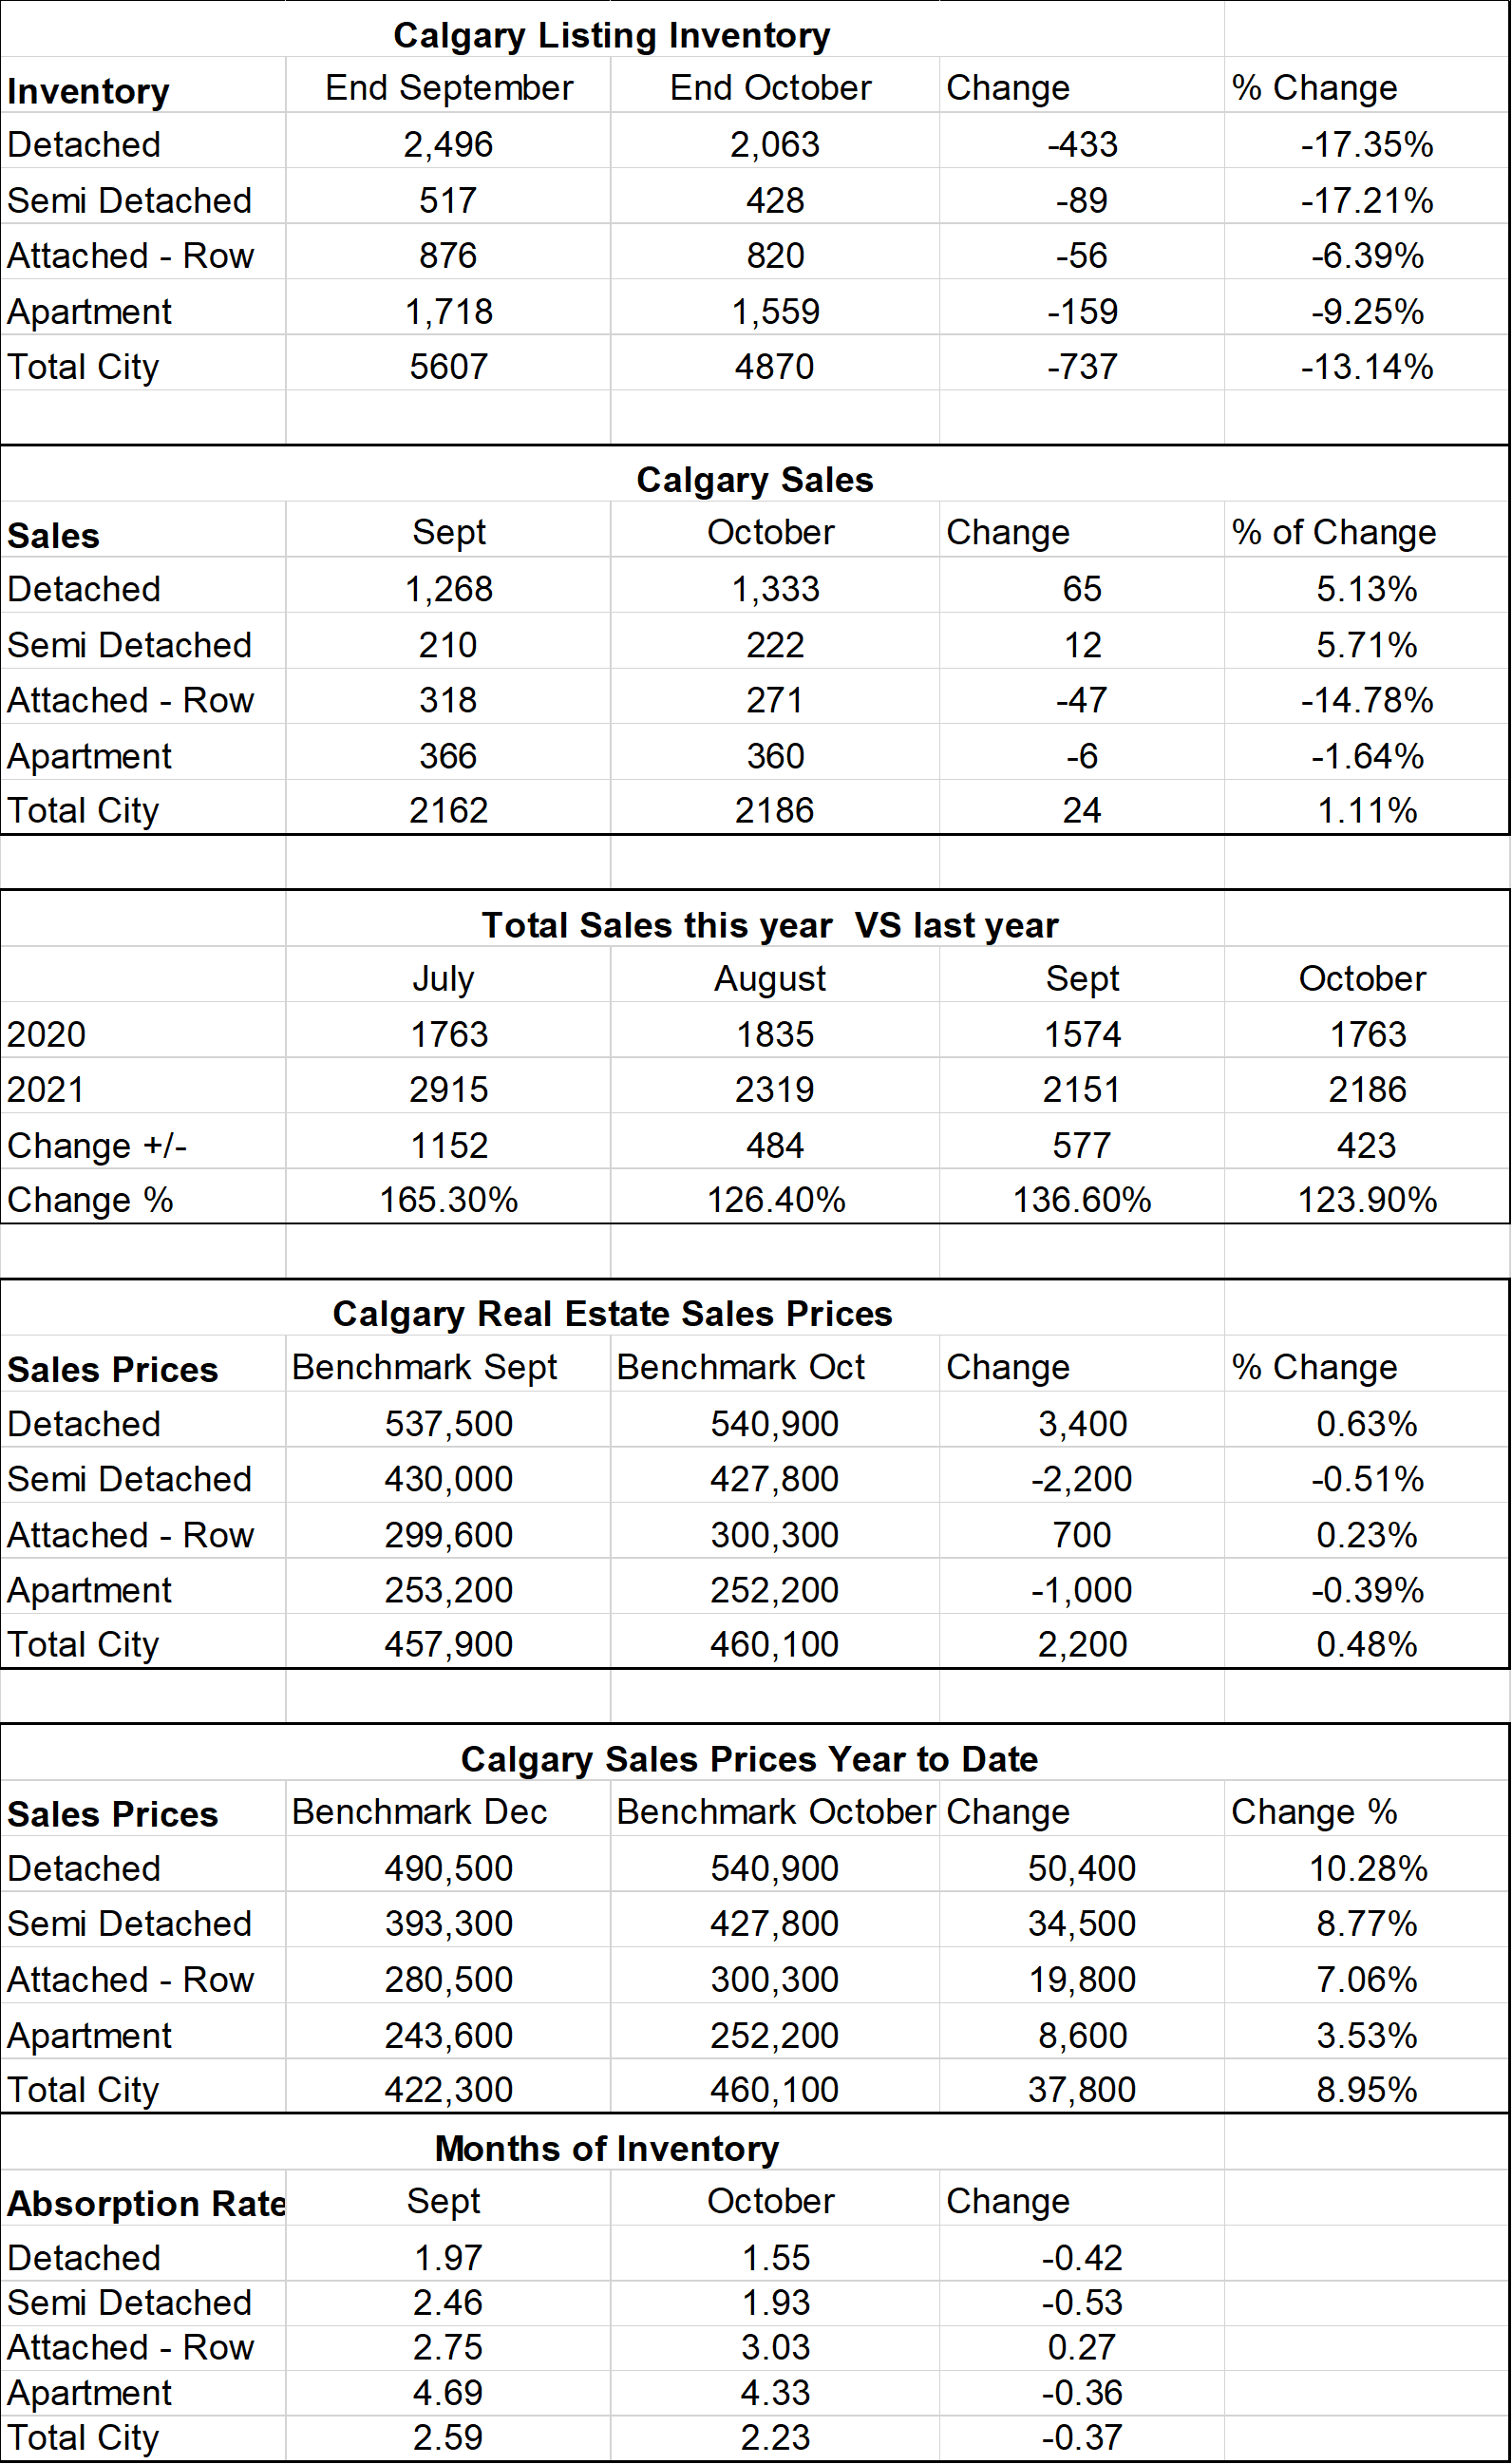
Calgary Listing Inventory
Listing Inventory in all sectors declined this month by 6.8% overall. The largest decline was in the detached sector (-171) followed by the Apartment Condo Sector (-123). The other sectors were almost flat. It is very normal for sales to decline in Oct and will continue to do so until the new year.
Calgary Sales:
All sectors saw a decrease of sales in September. The total decrease in sales was 11% and was spread equally between sectors. When I read the full Calgary Real Estate Boards Statistics package, they are saying that activity is still far stronger than levels achieved prior to the pandemic and is well above long term trends for September. My sense is most of the decrease is due to seasonal trends and the rising interest rates may have started to have a slight impact.
Sales Compared to 2021:
It is also important to look at sales compared to the Previous year. Sales for September were down 11.9% when compared to last September. This is the first time in months that we have seen a decrease from last years sales. When I read the full Calgary Real Estate Boards Statistics package they are saying that activity is still far stronger than levels achieved prior to the pandemic and is well above long term trends for September.
| Jan | Feb | Mar | Apr | May | June | July | |
| 2021 | 1207 | 1831 | 2903 | 3204 | 2981 | 2914 | 2314 |
| 2022 | 2009 | 3305 | 4107 | 3401 | 3071 | 2842 | 2254 |
| Change | + 802 | 1474 | +1204 | +197 | 90 | -72 | -60 |
| % Change | + 66.4% | +180.5% | +141.5% | +1.06 | +1.03% | 2.5% | 2.7% |
| Aug | Sept | Oct | Nov | Dec | |
| 2021 | 2146 | 2157 | |||
| 2022 | 2136 | 1901 | |||
| Change | -10 | -256 | |||
| % Change | -.5% | 11.9% |
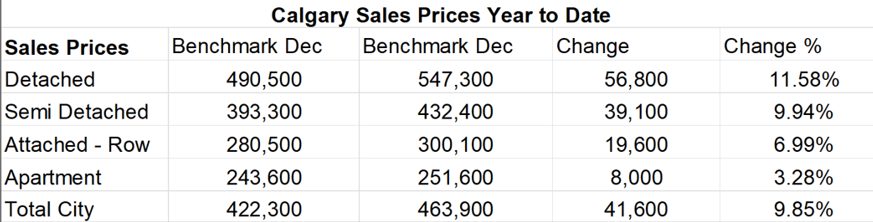
Calgary Real Estate Benchmark Sales Prices:
The benchmark price for all sectors combined decreased by $4,400 for the month. Detached and Semi-Detached homes lost $5,000 and $6,900 respectively. Attached row homes increased by $800 while apartment condos increased by $200 in September.
Calgary Real Estate Benchmark Year to Date Sales Price: See chart below.
Year to date the Calgary market has increased by 9.6%.
Current Months of Inventory (Absorption Rate):
The month of inventory is still trending upwards but by much smaller numbers than we have seen in past months. Detached, Semi-Detached and Row homes are still sitting in a Sellers market position while Apartment condos are in a balanced market position.
What might the last quarter of 2022 bring: (again just my opinion)
Based on what I am seeing we are still trending towards a more balanced market however the move is getting slower. I believe after the surge we had in the early part of the year the market is just trying to figure out our new normal and since the amount the market is changing is decreasing, we might be at our new normal.
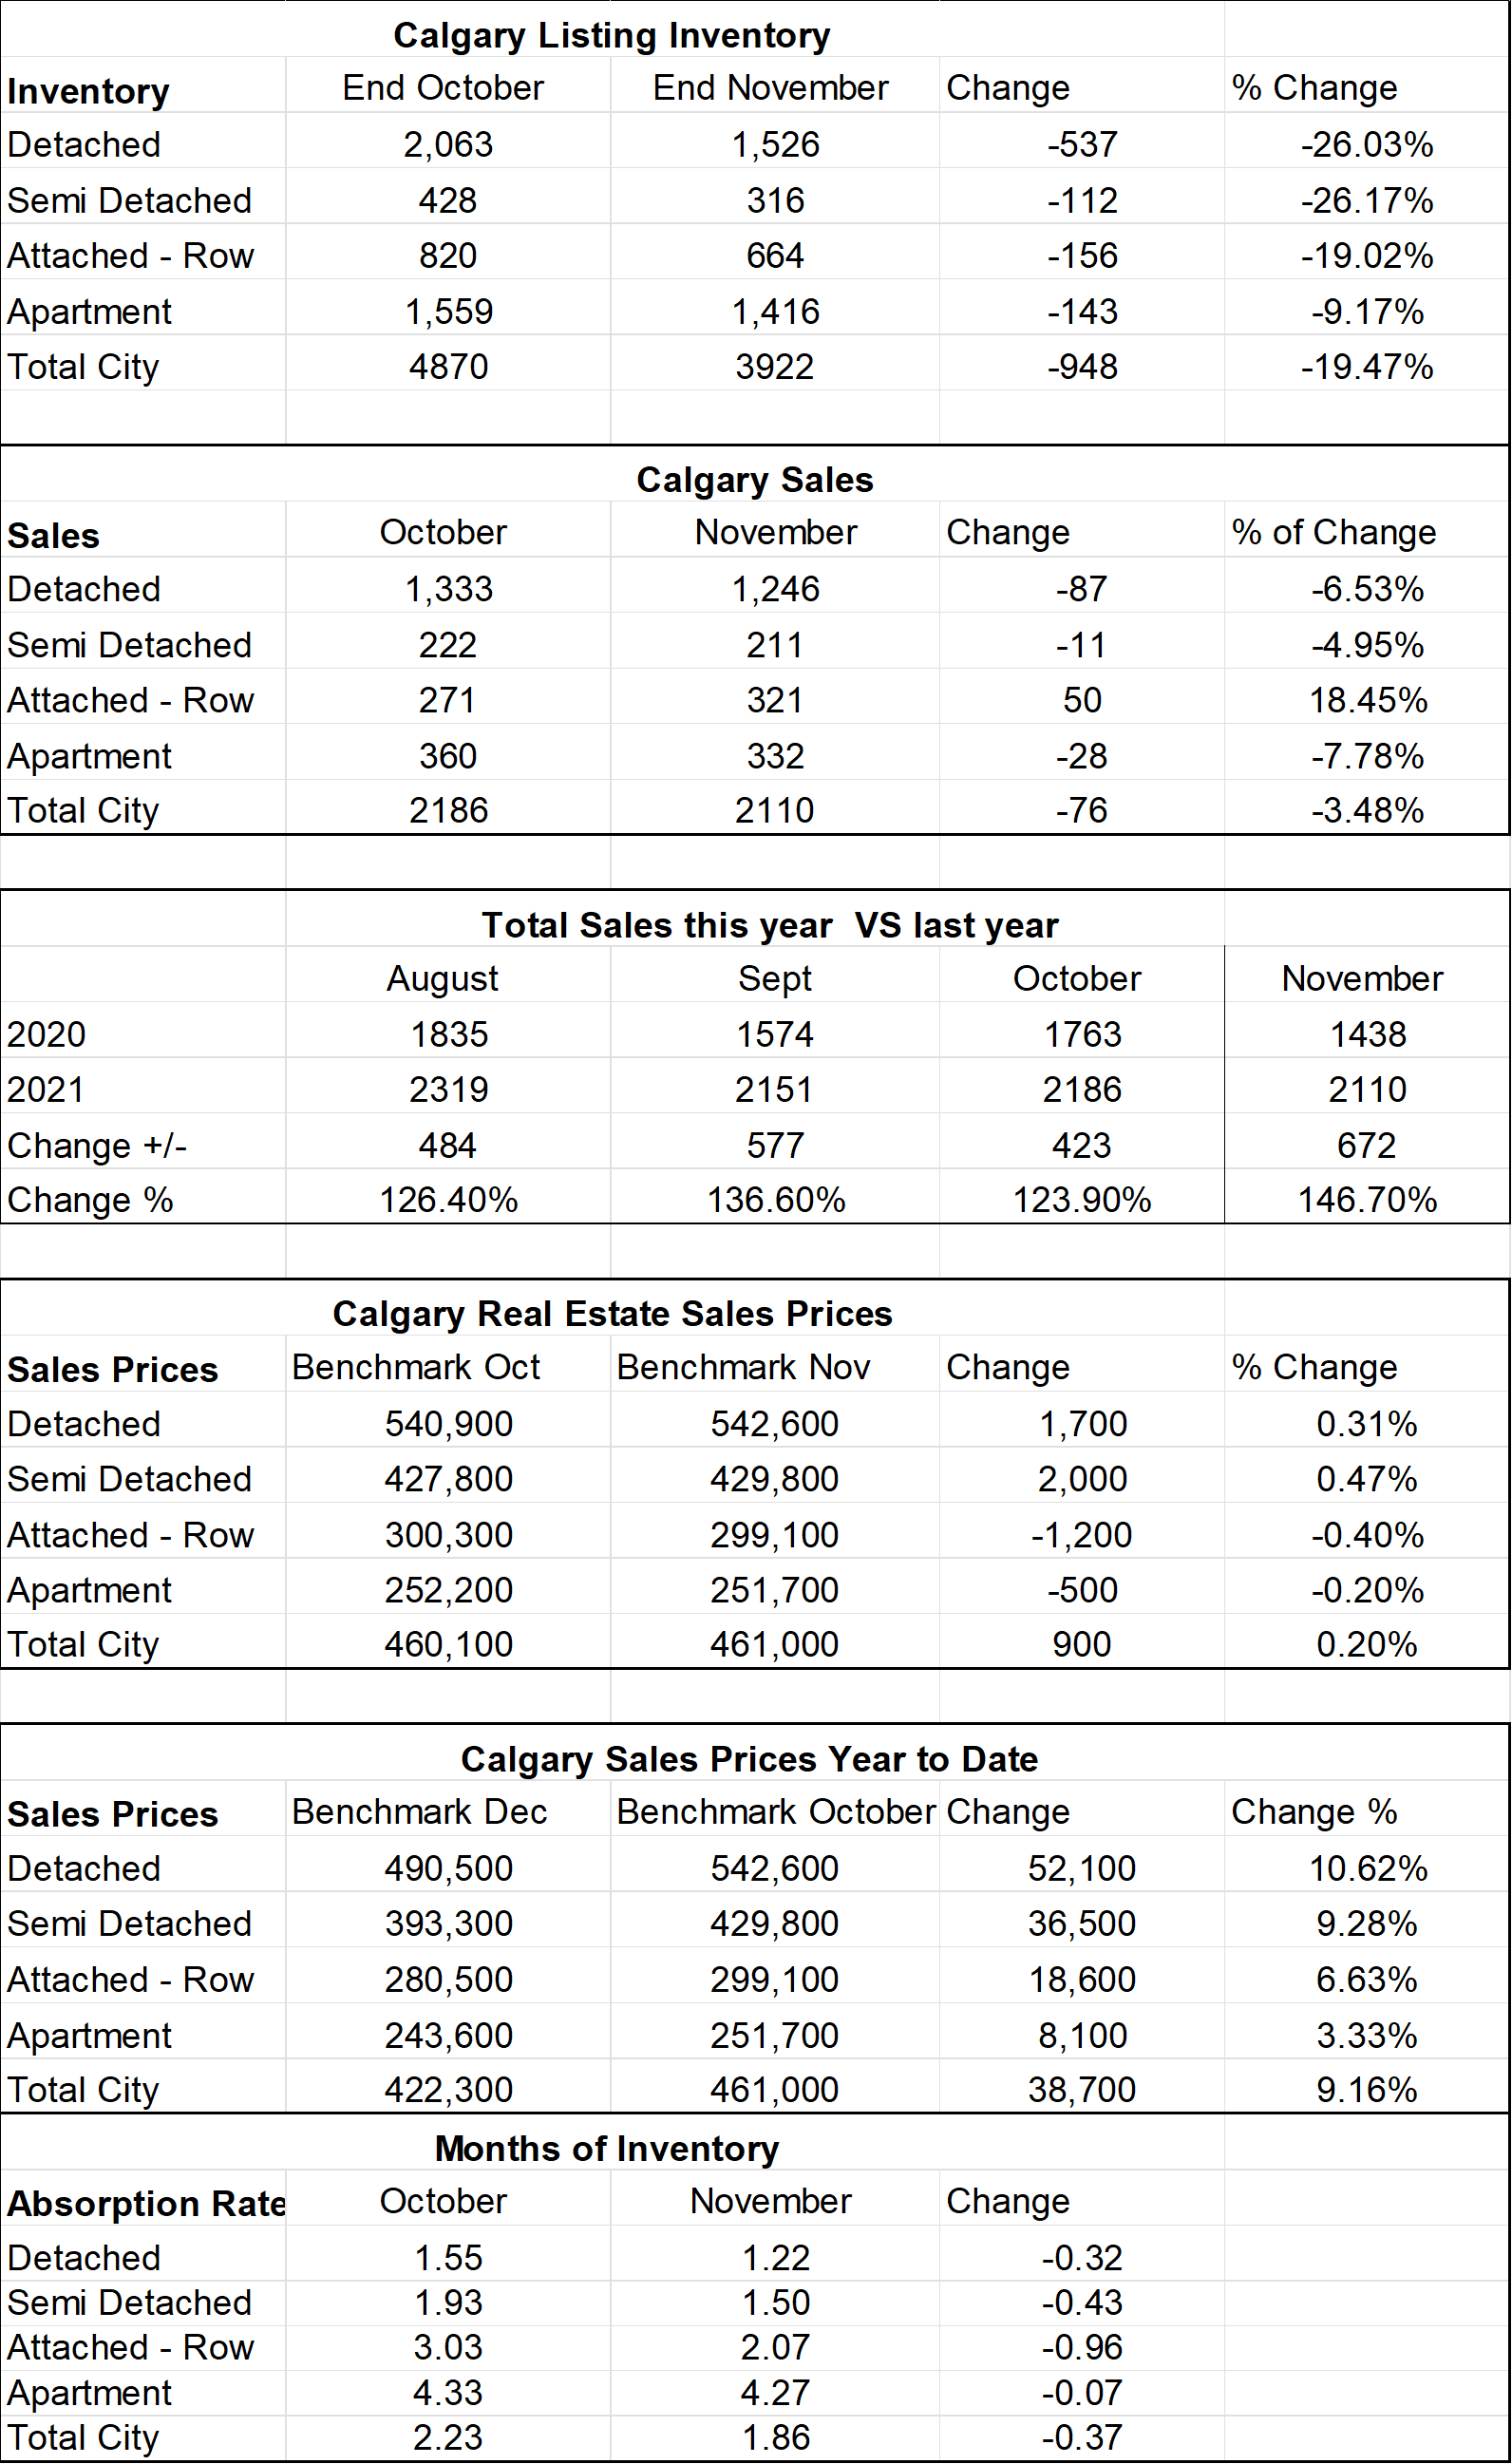
Below is a summary of numbers in chart form. All numbers are taken from the Calgary Real Estate Boards monthly Stats package.
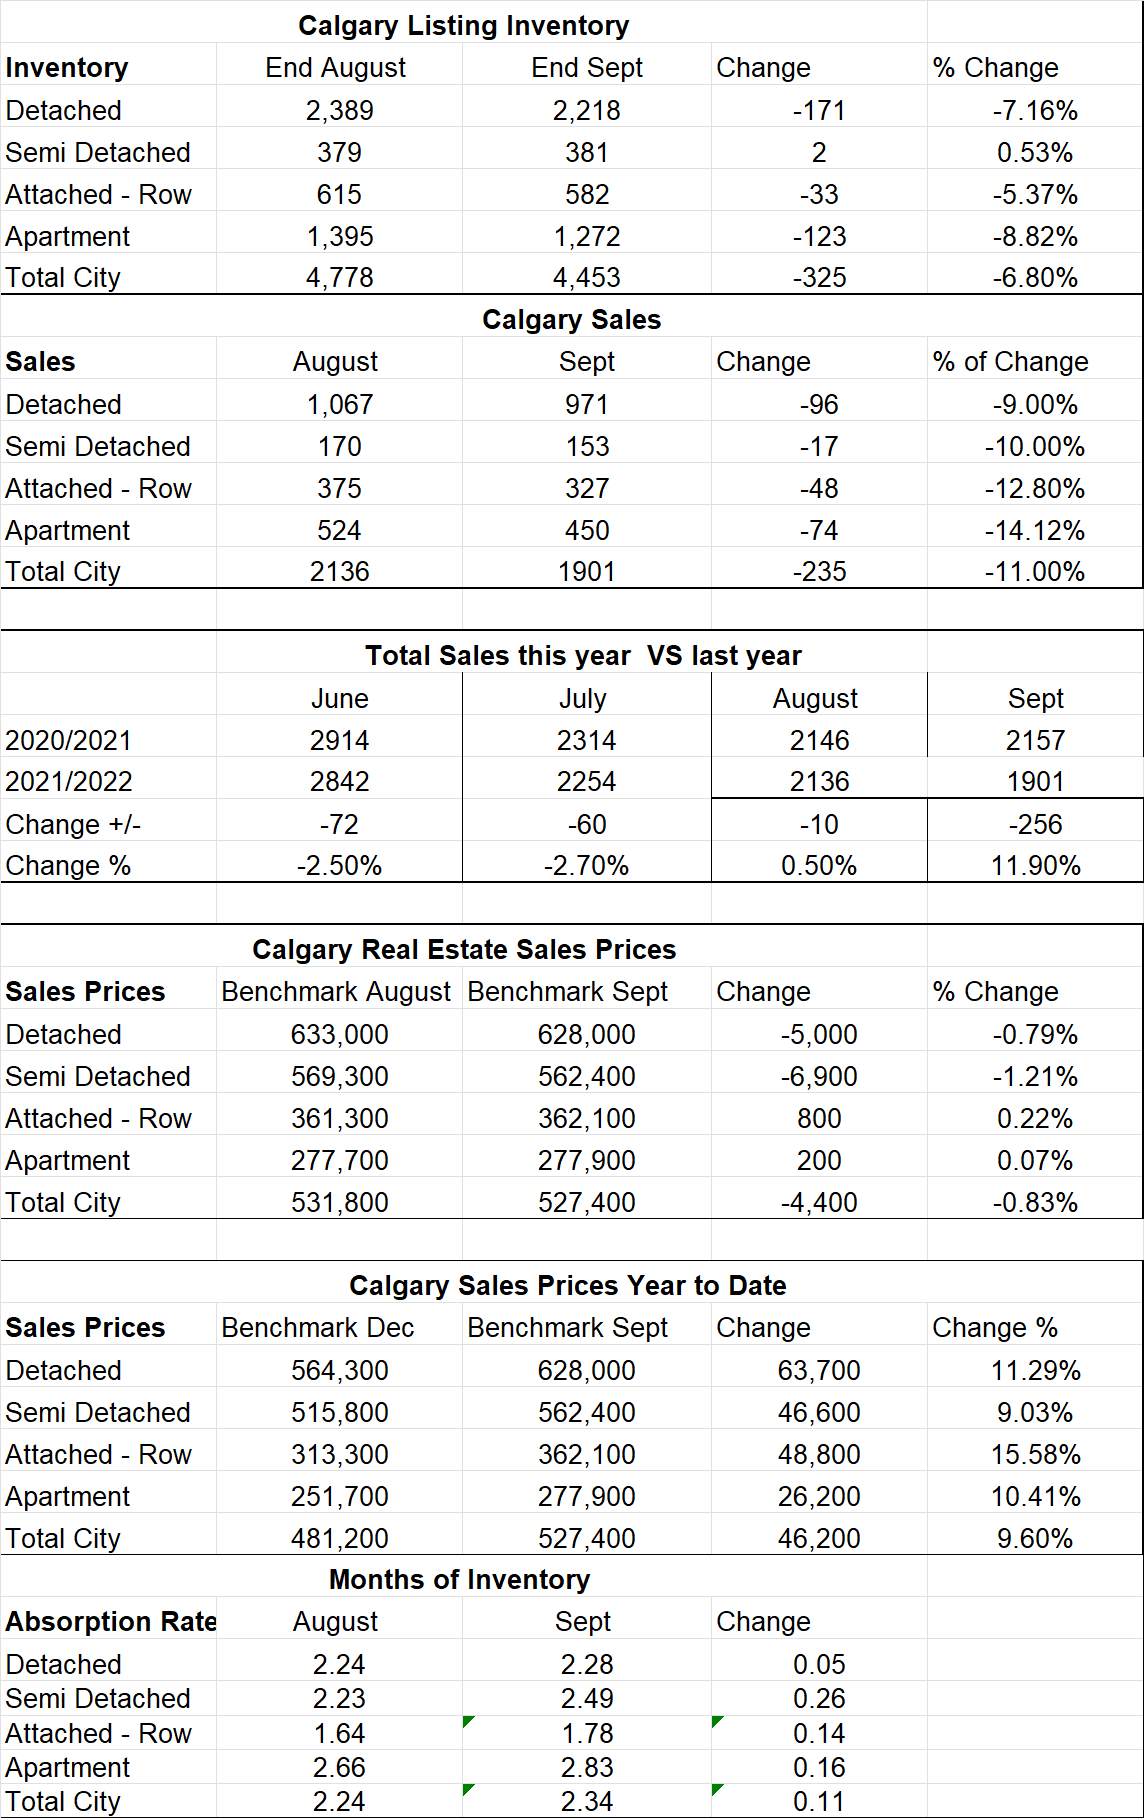
Key Stats from the Calgary Real Estate Boards Stats Package.