What is really happening in the Calgary Real Estate Market?
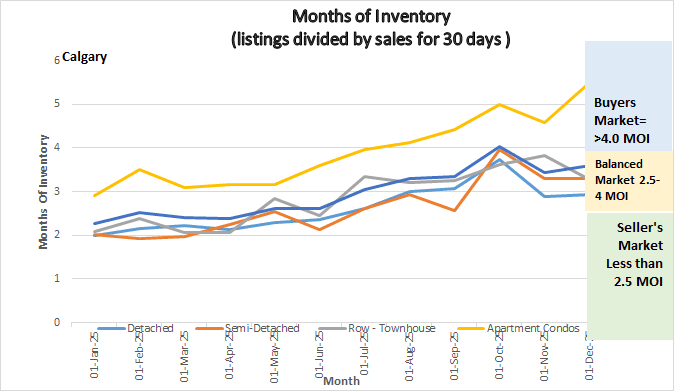
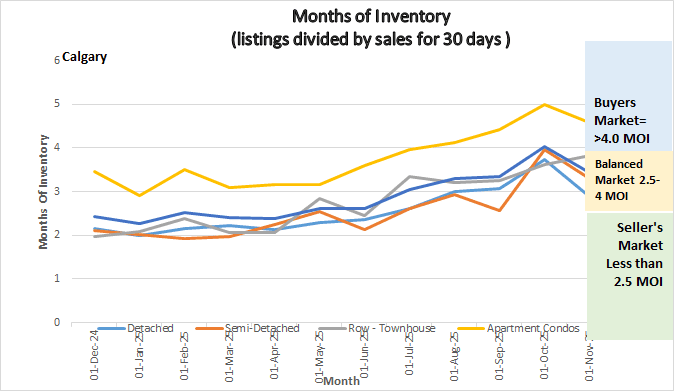
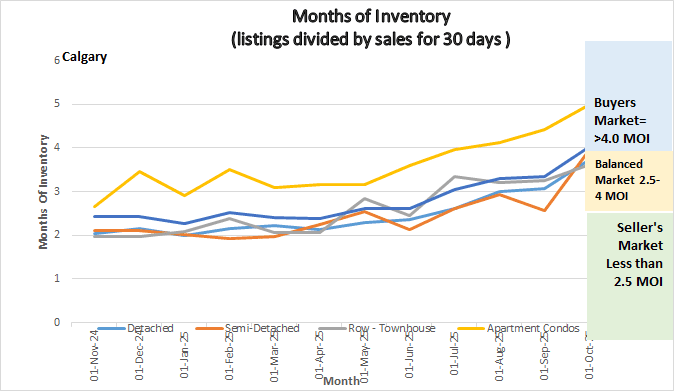
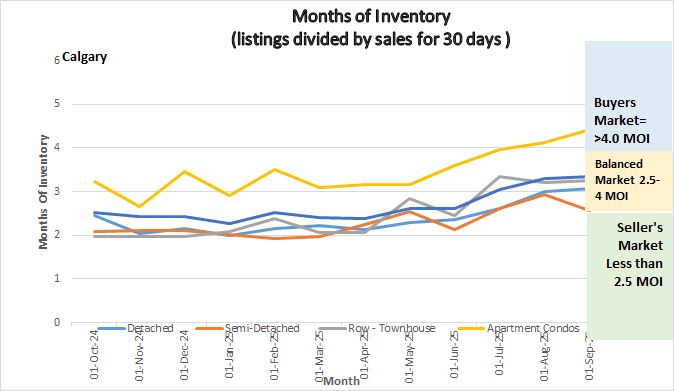
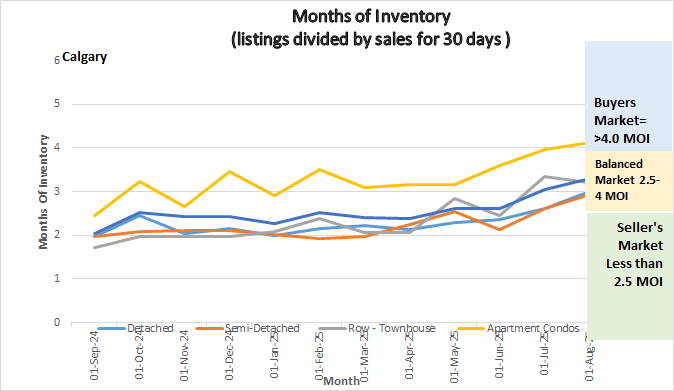
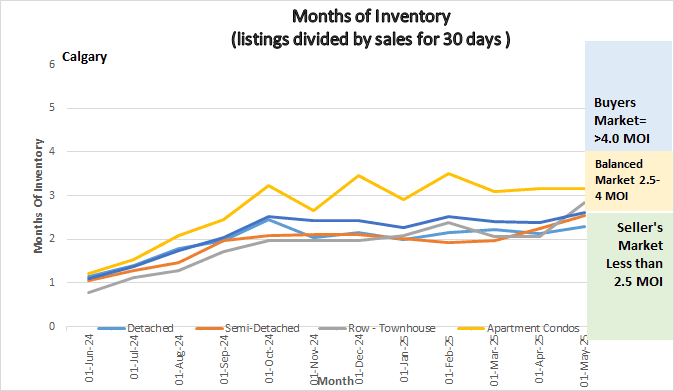
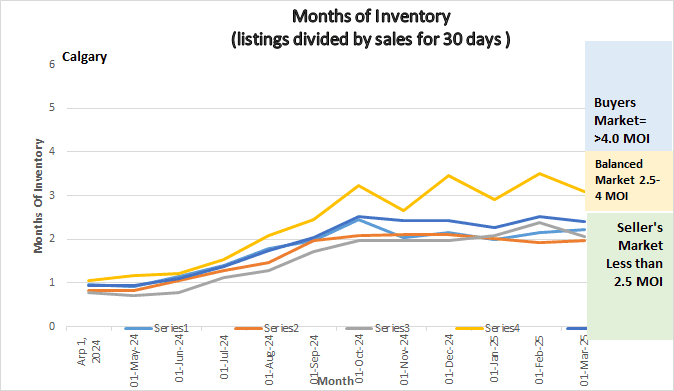
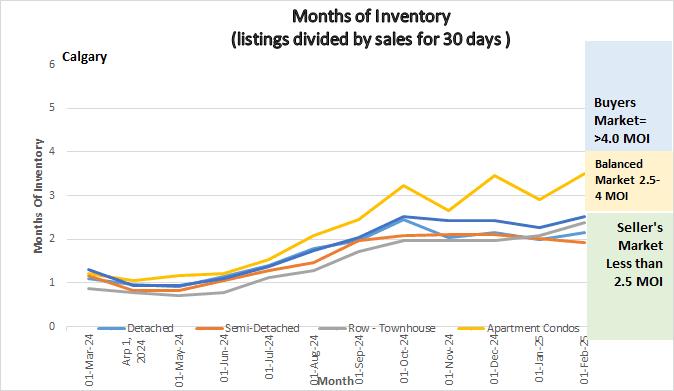
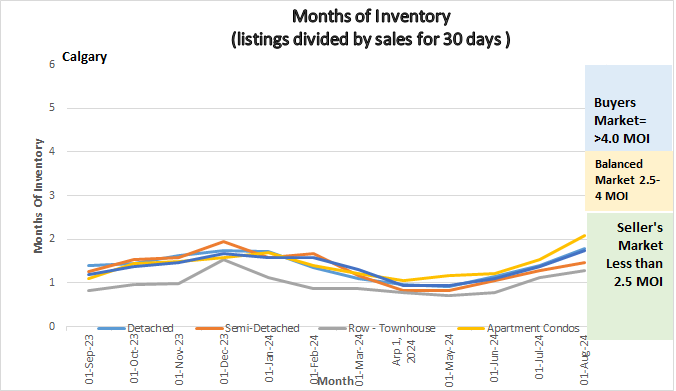
The following graph shows the months of inventory for each housing sector. Looking at a one-year trendline gives you an indication of where things are really heading.
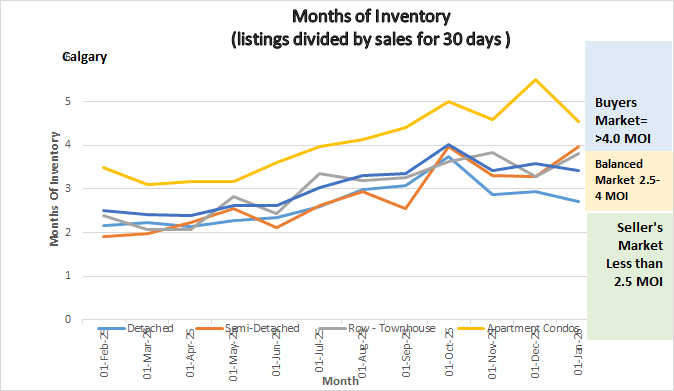
Graph shows the months of inventory for all sectors in the Calgary Real Estate Market
Gord’s commentary for the month (just my opinion).
Hope you had a wonderful holiday season!
January 1, 2026, Highlights
Inventory dropped by almost 31% while sales decreased by 27.5% decreasing our Months of Inventory by .17 A decrease in both these numbers is very expected as December gets people focused on family and the holidays.
I will add a note that the Calgary Real Estate Board indicated that the demand pressure eased up due to a reduction in migration and heightened levels of uncertainty.
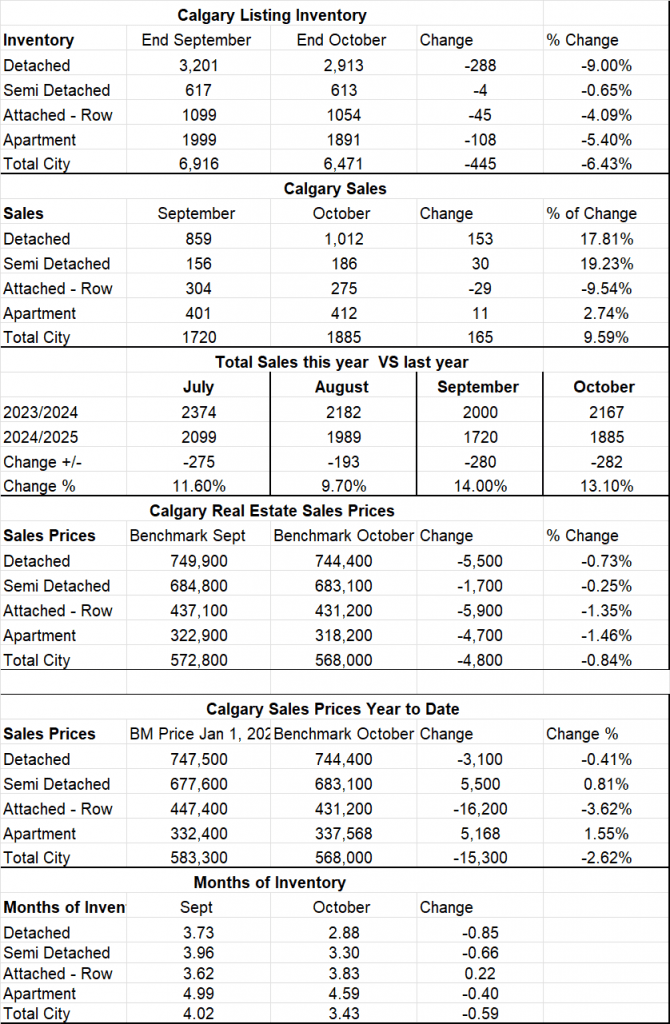
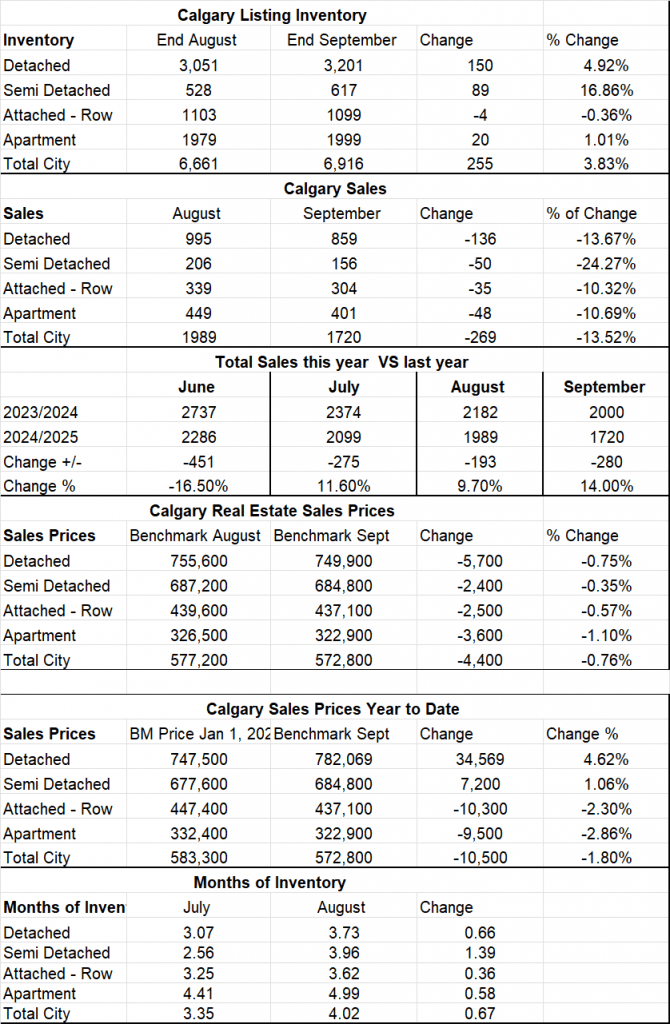
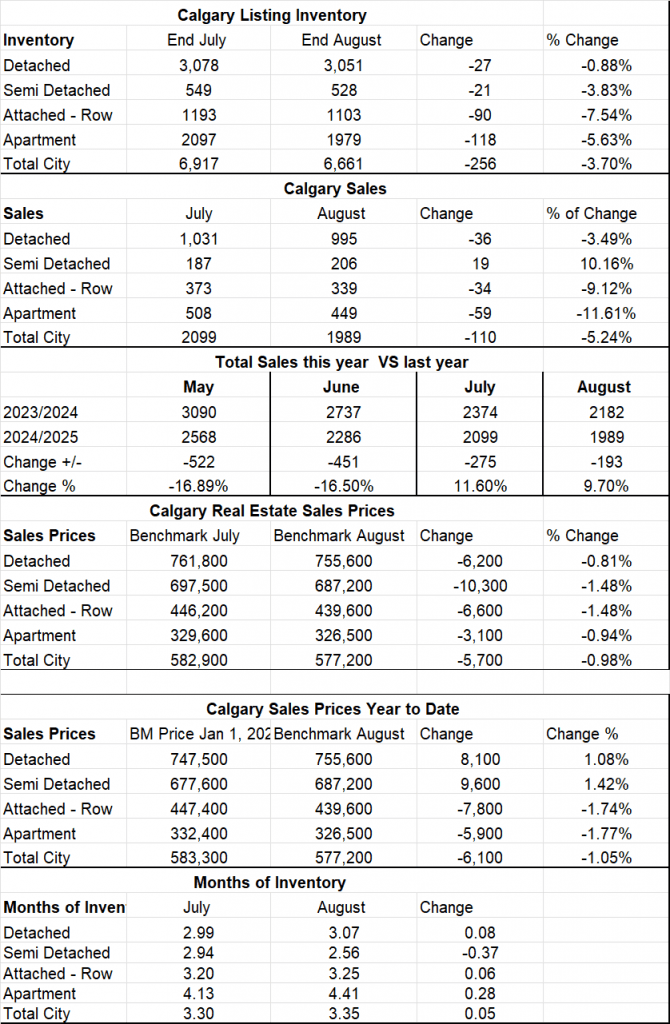
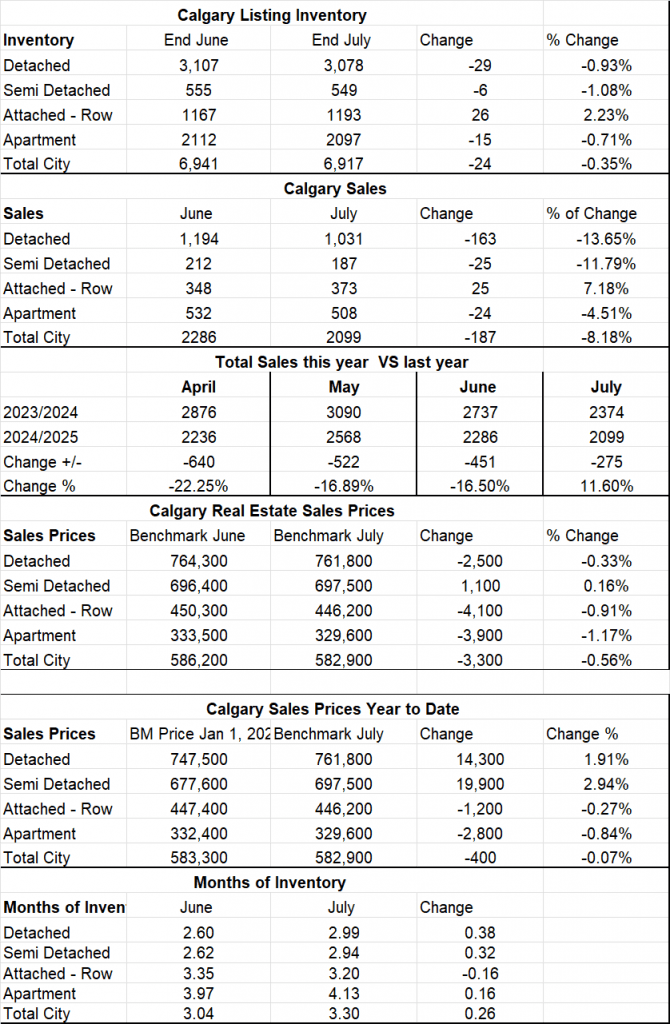
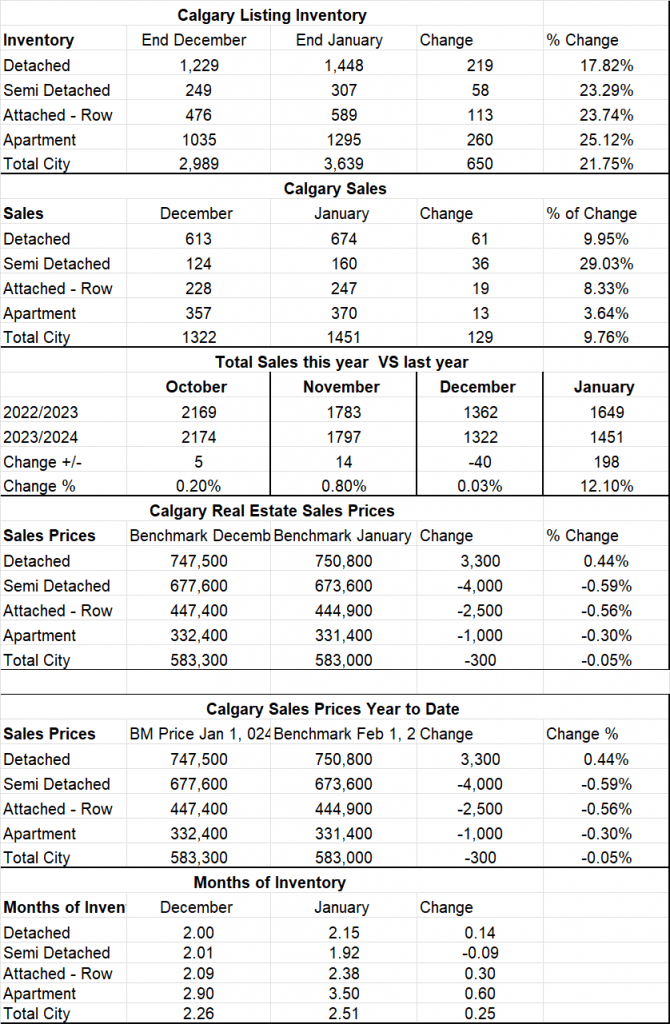
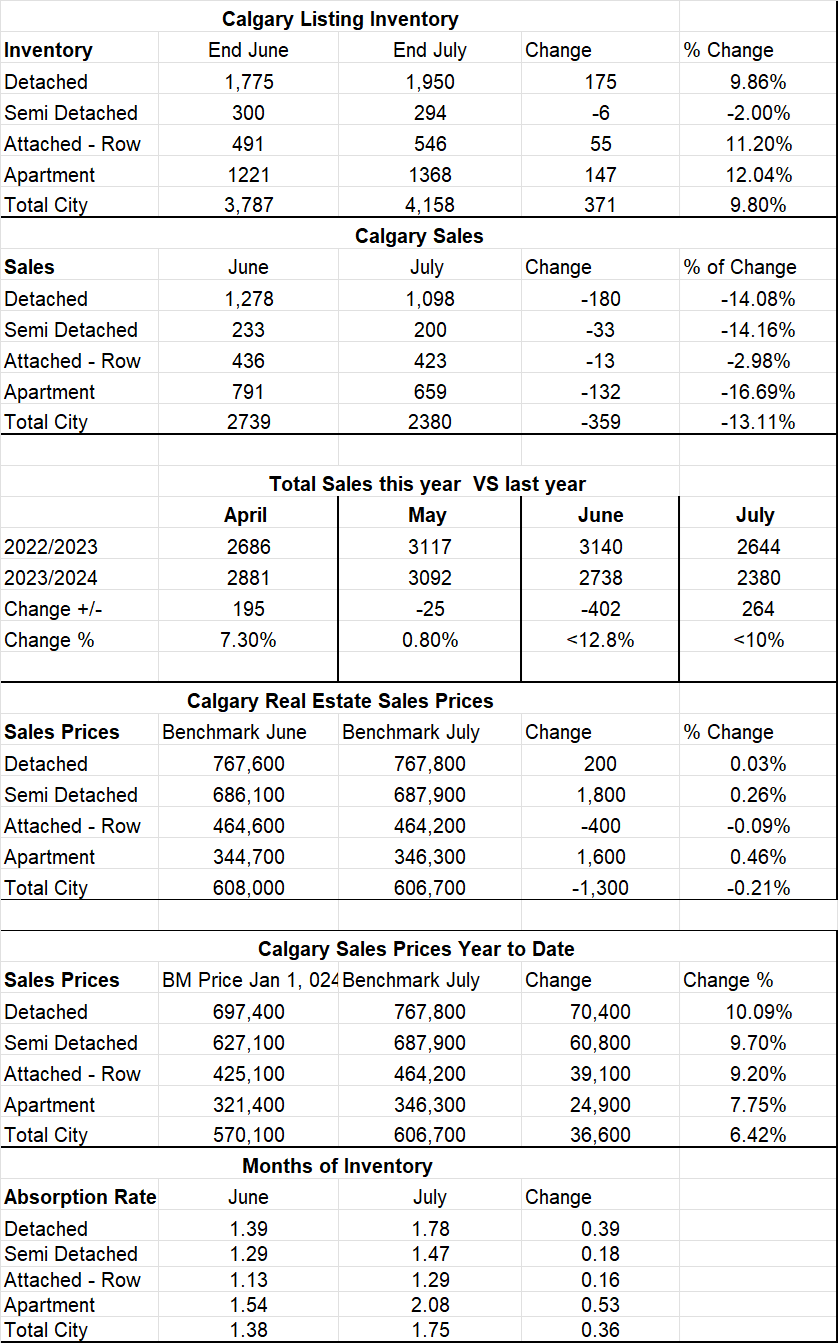
Calgary Listing Inventory
The Calgary listing inventory decreased by between 26.75% to 30.8% so very consistent across the board. Now that we have hit January, I fully expect these numbers to increase going forward. As you can see from the graph, the number of listing for Apartment Condos decreased more than other sectors.
Calgary Sales
Sales in December declined overall by 27.5%. Apartment Condos declined by 11% while semi detached homes dropped by 42.1%. Apartment condominiums faired way better than every other sector and it suggests to me that people saw a good buying opportunity as the prices have declined substantially.
Sales Compared to 2024:
December saw a decline in sales over December 2024; my belief is that this is due to a strong 2024 and a more moderate 2025. Also, the numbers are consistent over the last 6 months.
| July | August | Sept | October | November | December | |
| 2024 | 2374 | 2182 | 2000 | 2167 | 1793 | 1318 |
| 2025 | 2099 | 1989 | 1720 | 1885 | 1553 | 1126 |
| Change | -275 | -193 | -280 | -282 | -240 | -192 |
| % Change | -11.6% | -9.7% | -14. % | -13.1 | -13.4% | -14.5% |
Calgary Real Estate Benchmark Sales Prices:
The overall benchmark Price declined .77% during December. The highest decline was in the detached sector at 2.18%.
Calgary Real Estate Prices for 2025 – Here are the numbers.
| Calgary Sales Prices Year to Date | ||||
| Sales Prices | BM Price Jan 1, 2025 | Benchmark December | Change | Change % |
| Detached | 747,500 | 726,900 | -20,600 | -2.76% |
| Semi Detached | 677,600 | 666,800 | -10,800 | -1.59% |
| Attached – Row | 447,400 | 421,300 | -26,100 | -5.83% |
| Apartment | 332,400 | 303,600 | -28,800 | -8.66% |
| Total City | 583,300 | 554,700 | -28,600 | -4.90% |
As you can see all sectors declined over the year – consistently. This is simply a correct from 2024 when we had no inventory and we were seeing competing offers on every sale, so prices were shooting upwards. The market is simply trying to find where it should be.
Current Months of Inventory (Absorption Rate):
The overall months of Inventory increased by .17 Again this was driven mostly by the Apartment Condo Sector (-.95) and the Semi-Detached (.69).
My Prediction for what is ahead:
My short-term prediction is that in January we are going to see inventory grow more that sales growth softening the market. My reasoning is that in December we saw 865 listings expire and 905 listings terminated. There is always a high number in December and many of these listings will get relisted in January. I will be attending the Calgary Real Estate Boards forecast in late December so this will be me more facts on what they predict for the next year. Stay tuned.
*Below is a summary of numbers in chart form. All numbers are taken from the Calgary Real Estate Boards monthly Stats package.
* All numbers vary by community and price ranges, if you would like stats specifically for your neighbourhood, please contact us.
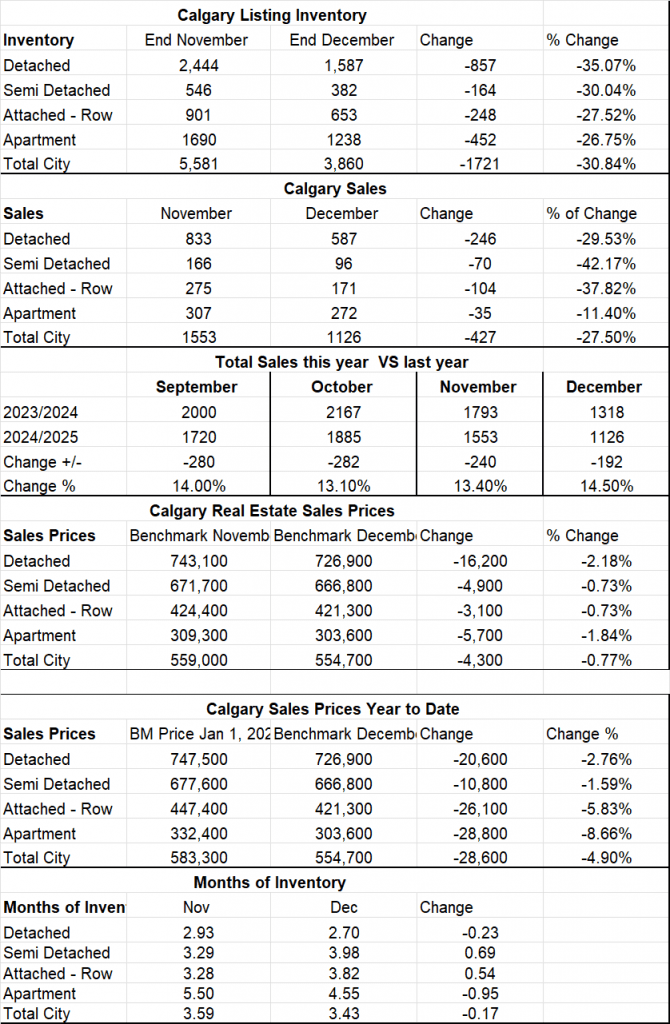
Summary of the Calgary Real Estate Board Realtors Stats