What is really happening in the Calgary Real Estate Market?
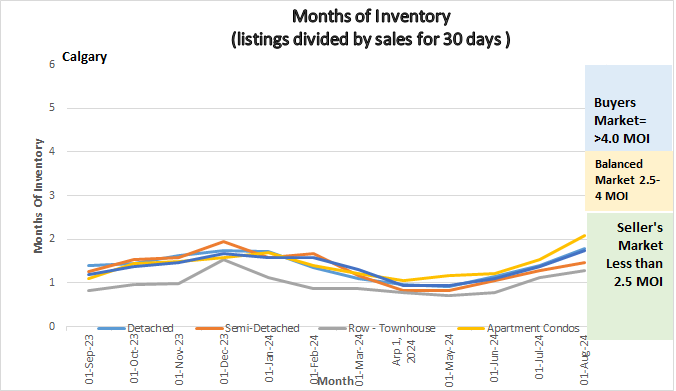
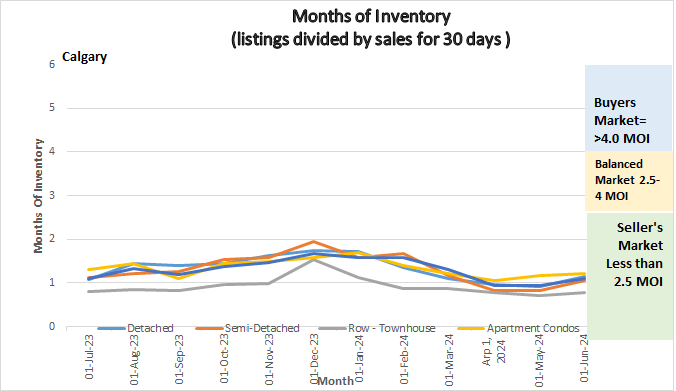
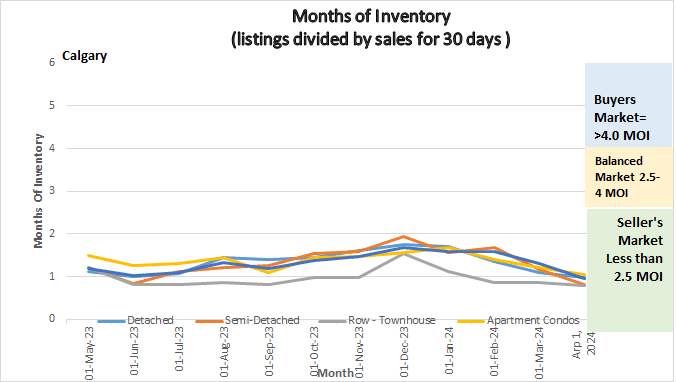
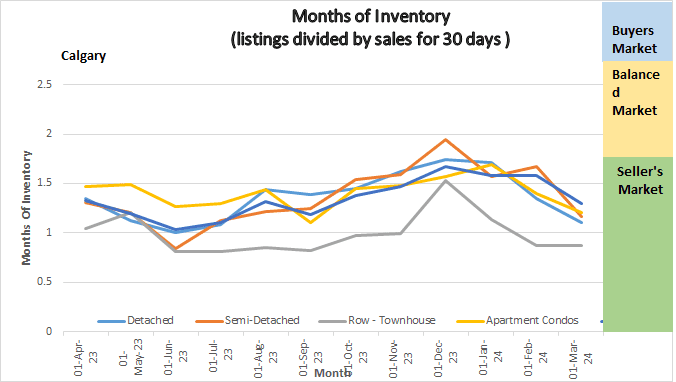
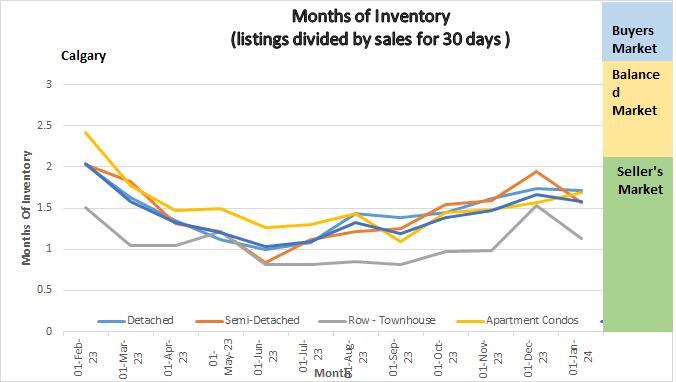
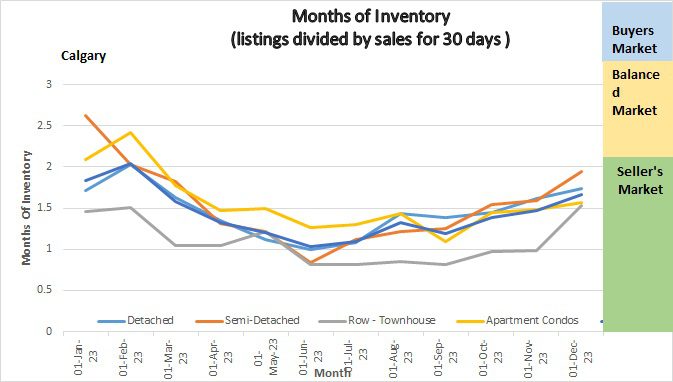
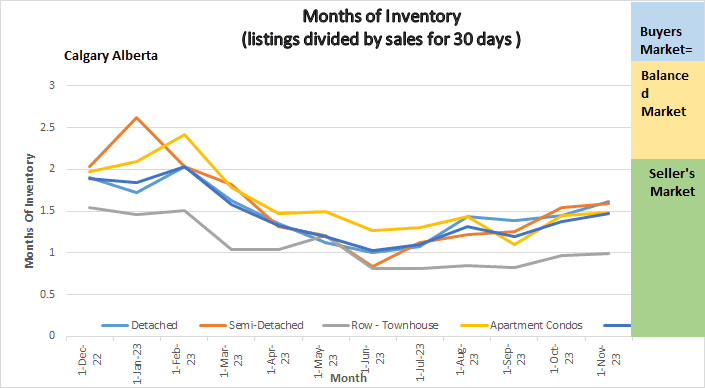
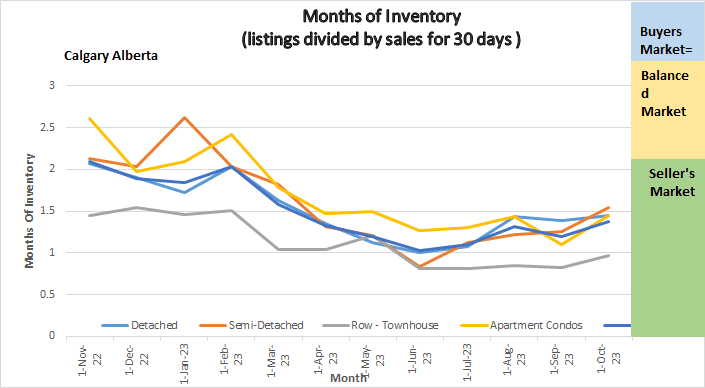
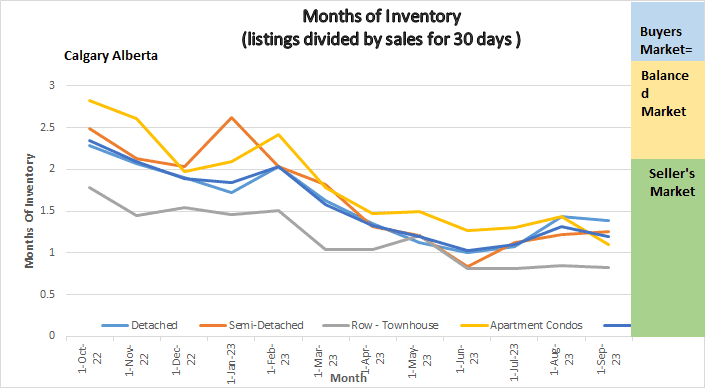
Following is a graph that shows the months of inventory for each housing sector. Looking at a one-year trendline gives you an indication of where things are really heading.
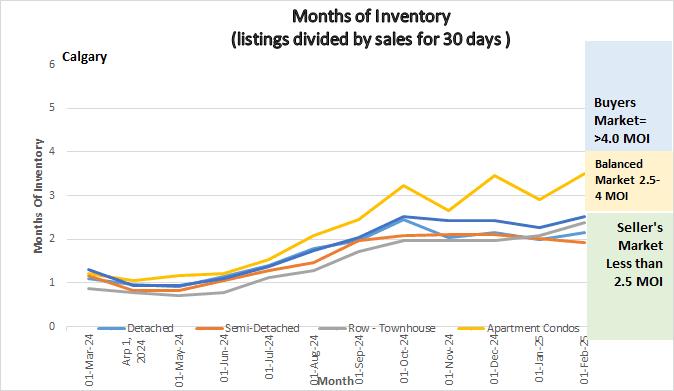
Graph showing Months of Inventory for Calgary Real Estate Market
Gord’s commentary for the month (just my opinion).
January 2024 Highlights
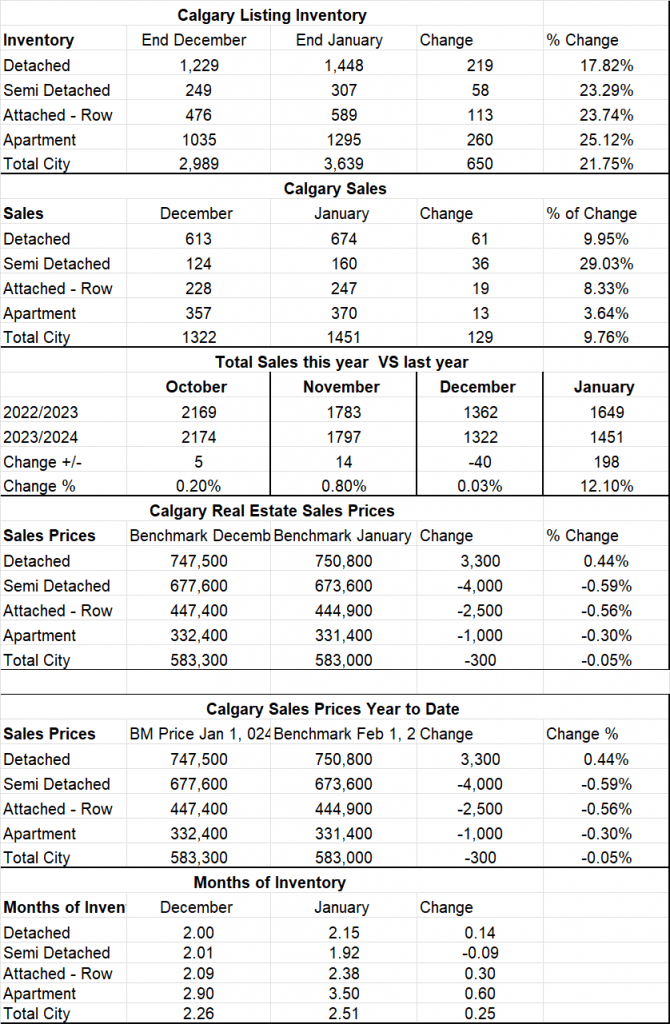
Calgary saw an increase in both inventory and sales however the increase in inventory was higher than sales pushing our Months of Inventory up in all housing sectors except Semi-detached homes. Prices decreased slightly in all sectors except Detached Homes where they increased by $3300.
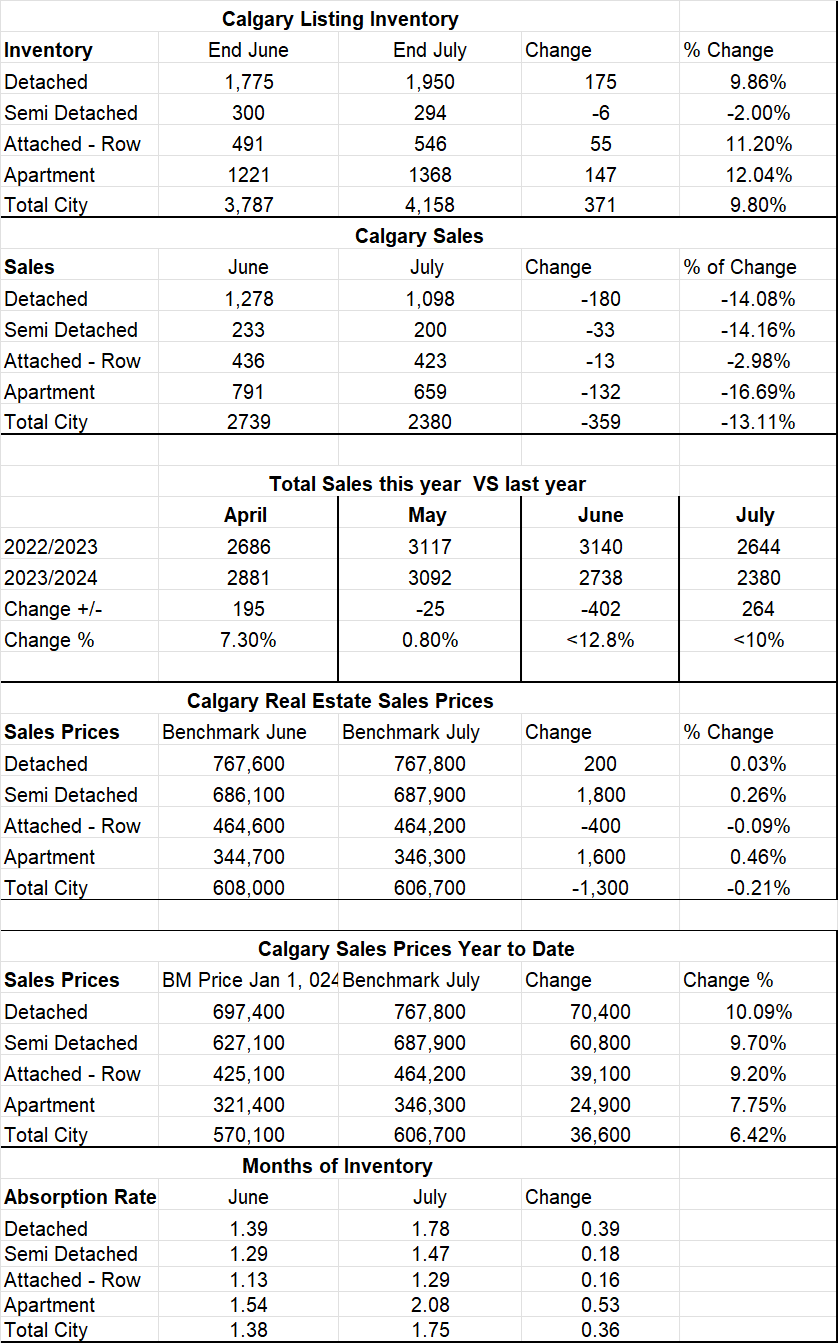
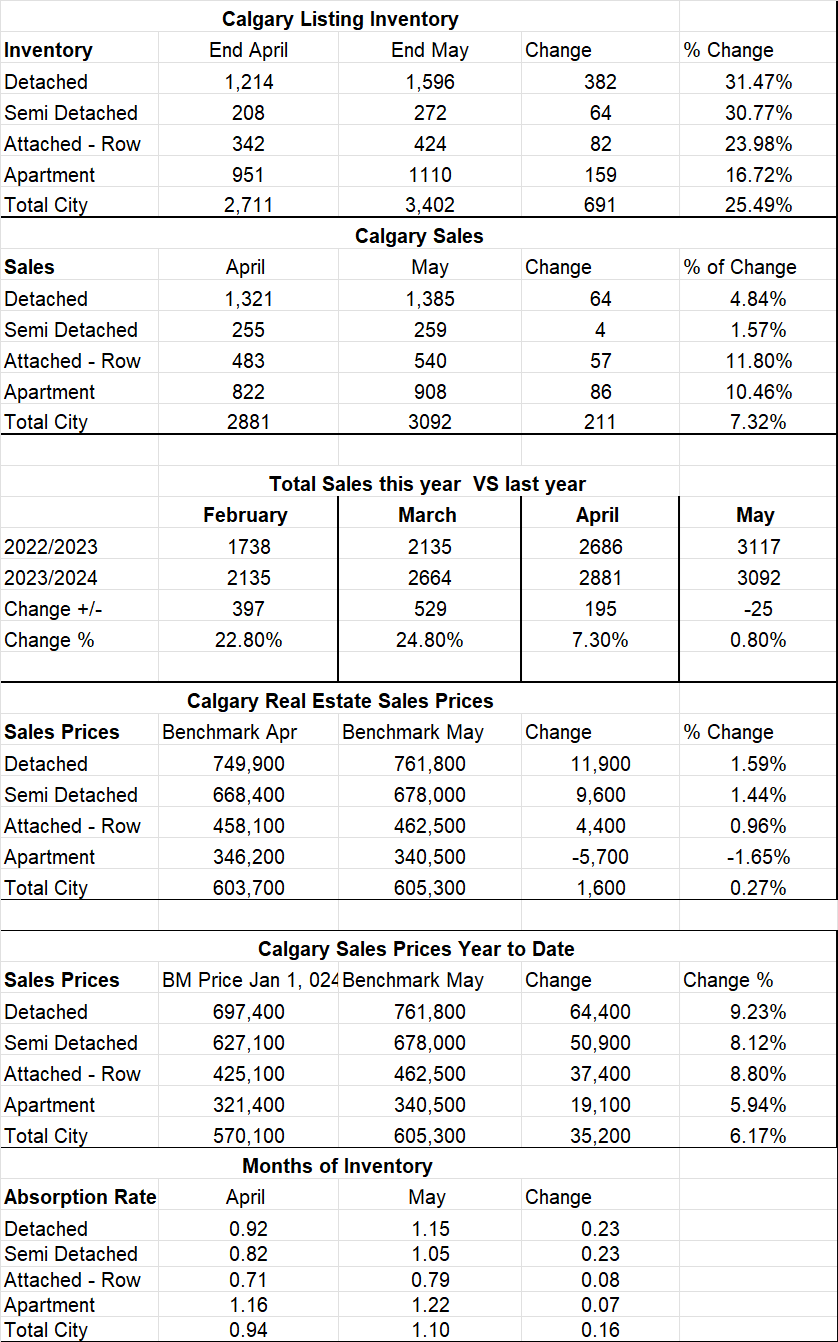
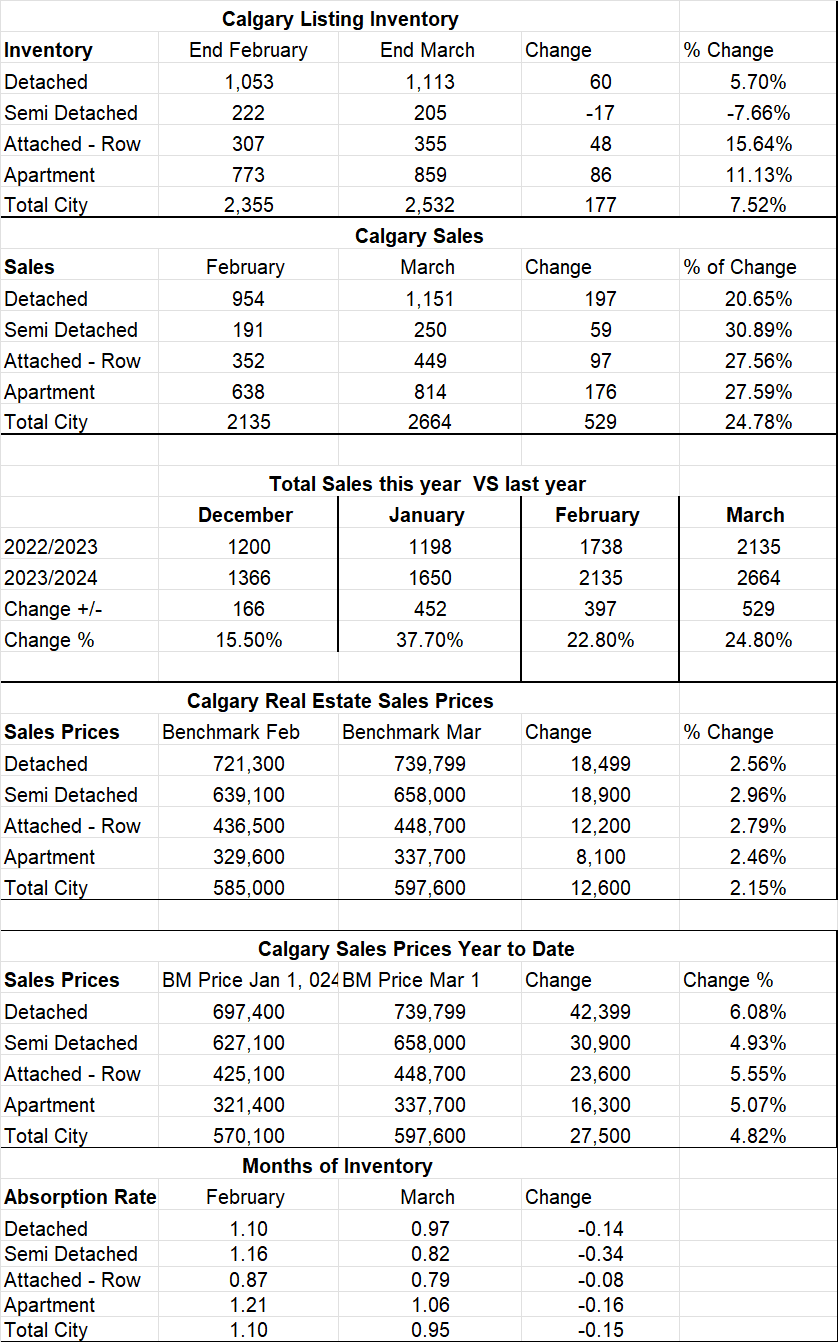
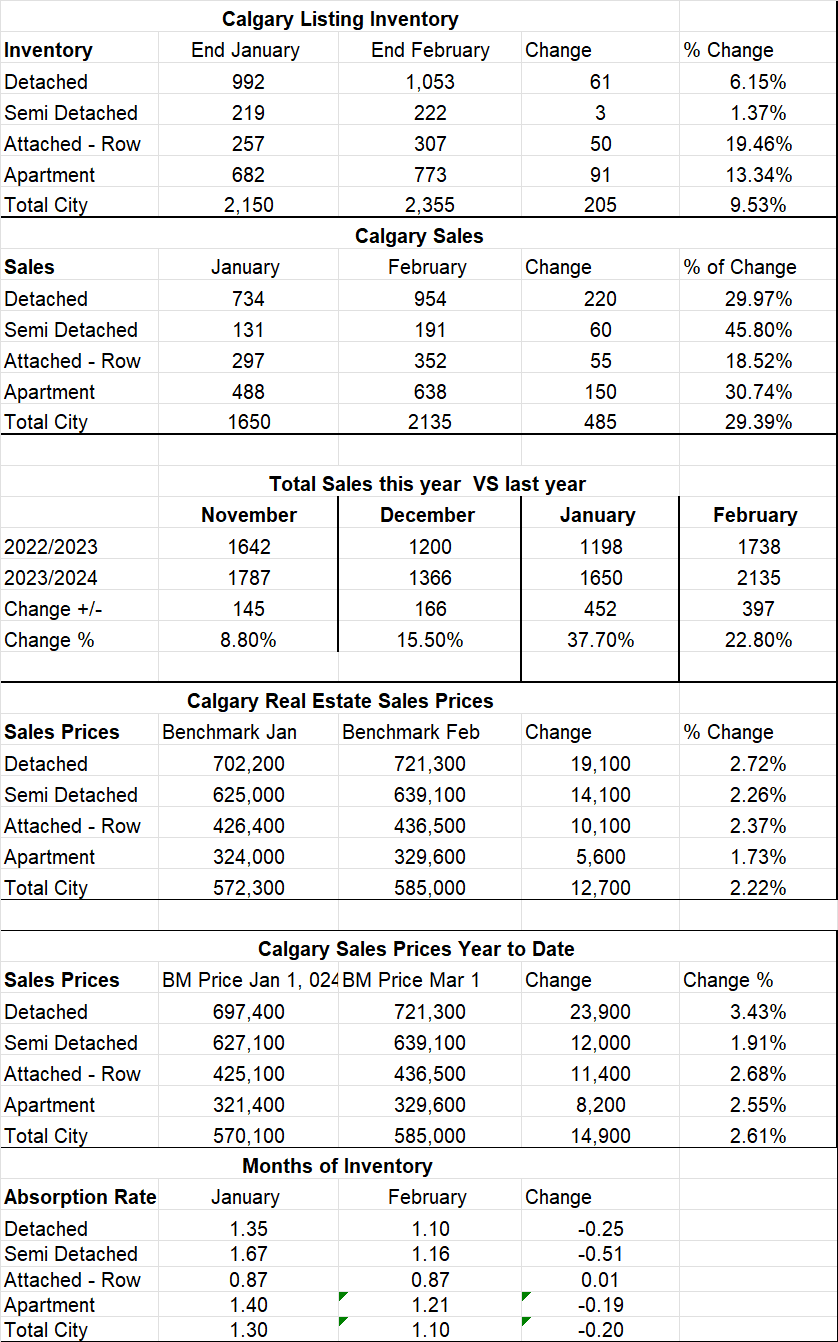
Calgary Listing Inventory
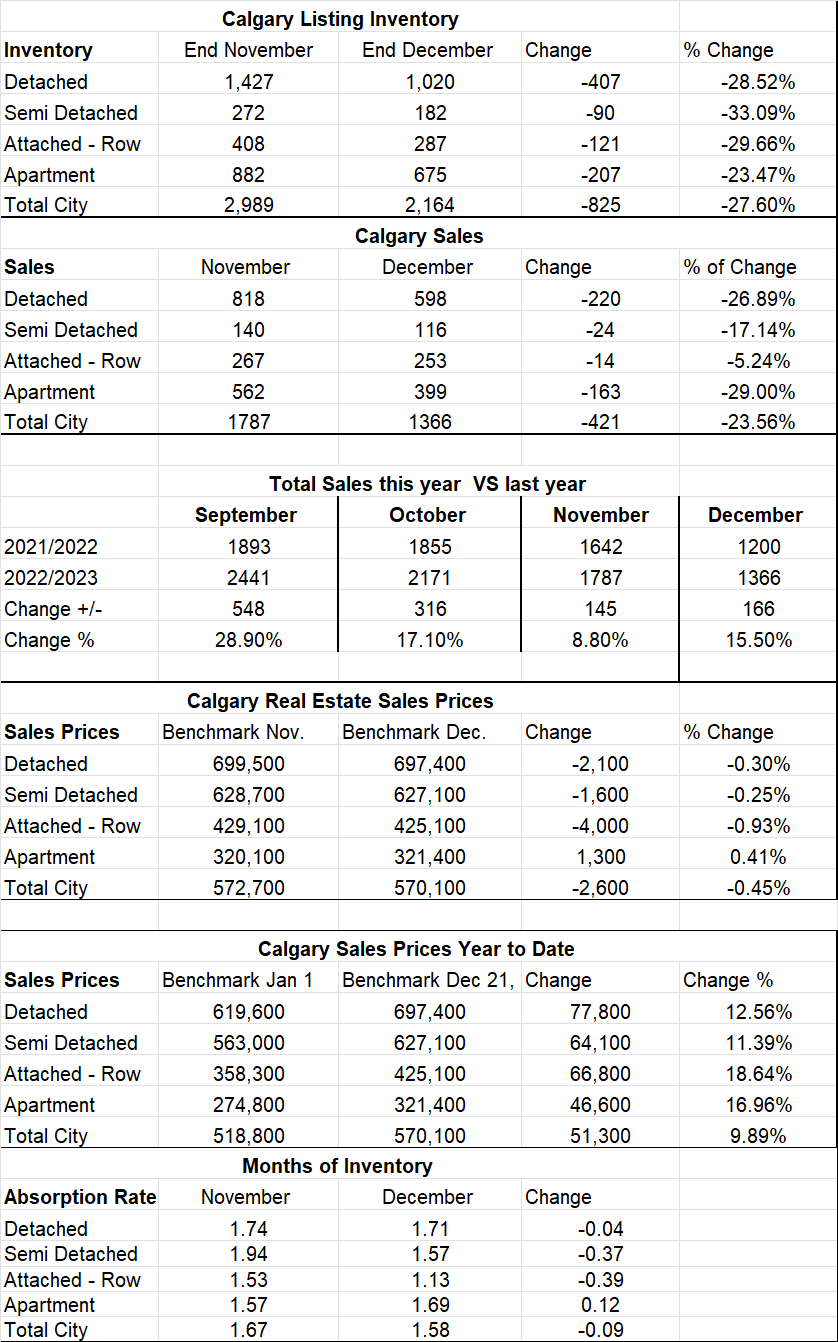
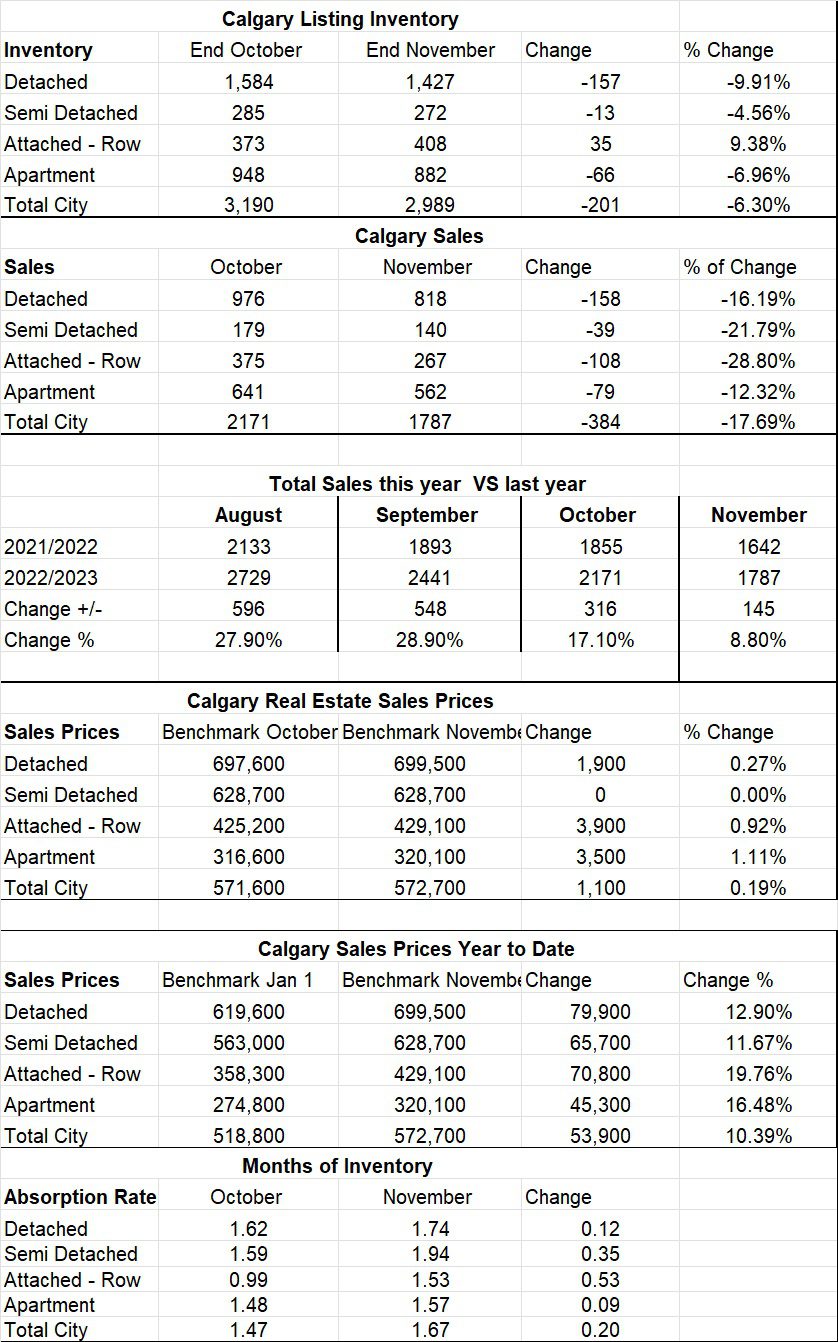
Through January our listing inventory increased in all housing sectors by a total of 21.75%. This seems high but a good portion of this is strictly seasonal.
Calgary Sales:
Through January our Sales increased by 9.76% which again is typical of the time of year. We should see this trend for the next six months.
Sales Compared to 2023:
Sales in January compared to January 2024 were down by 12.1% showing a slight slowdown.
| Aug | Sept | Oct | Nov | Dec | January | |
| 2023 | 2716 | 2430 | 2169 | 1783 | 1362 | 1649 |
| 2024 | 2186 | 2003 | 2174 | 1797 | 1322 | 1451 |
| Change | July | -427 | 5 | 14 | 40 | 198 |
| % Change | 19.6% | 17.6% | .2% | .8% | 3.0% | 12.1 |
Calgary Real Estate Benchmark Sales Prices:
The overall Benchmark price in December declined by $300. or .05%. This decline was fairly even across all sectors except Detached homes which saw an increase of $3300. All other sectors saw declines from $1000 to $4000.
Current Months of Inventory (Absorption Rate):
With our inventory decreasing by more than sales increased we saw the months of inventory increase overall by .25 The only Sector that decreased is the Semi-Detached sector and that only decreased by .09. Take note that the Condominium sector increased to 3.5 months of Inventory pushing it near a Buyers Market.
My Prediction for what is ahead:
First, I will say that anything could happen with the change in the US government and how the Canadian government will react with new tariff situation – today this is anyone’s guess.
Putting that aside, here is what it looks like to me. We are already in a tight (Seller’s market) to start off the new year. This combined with lower interest (more to come) which increases demand. In my opinion this indicates that we should have another busy year in Real Estate unless the Trump factor kicks in then it’s anyone’s guess. Unfortunately, it sure looks like there is going to be a lot of uncertainty throughout Trumps entire term which will hold the entire market back somewhat.
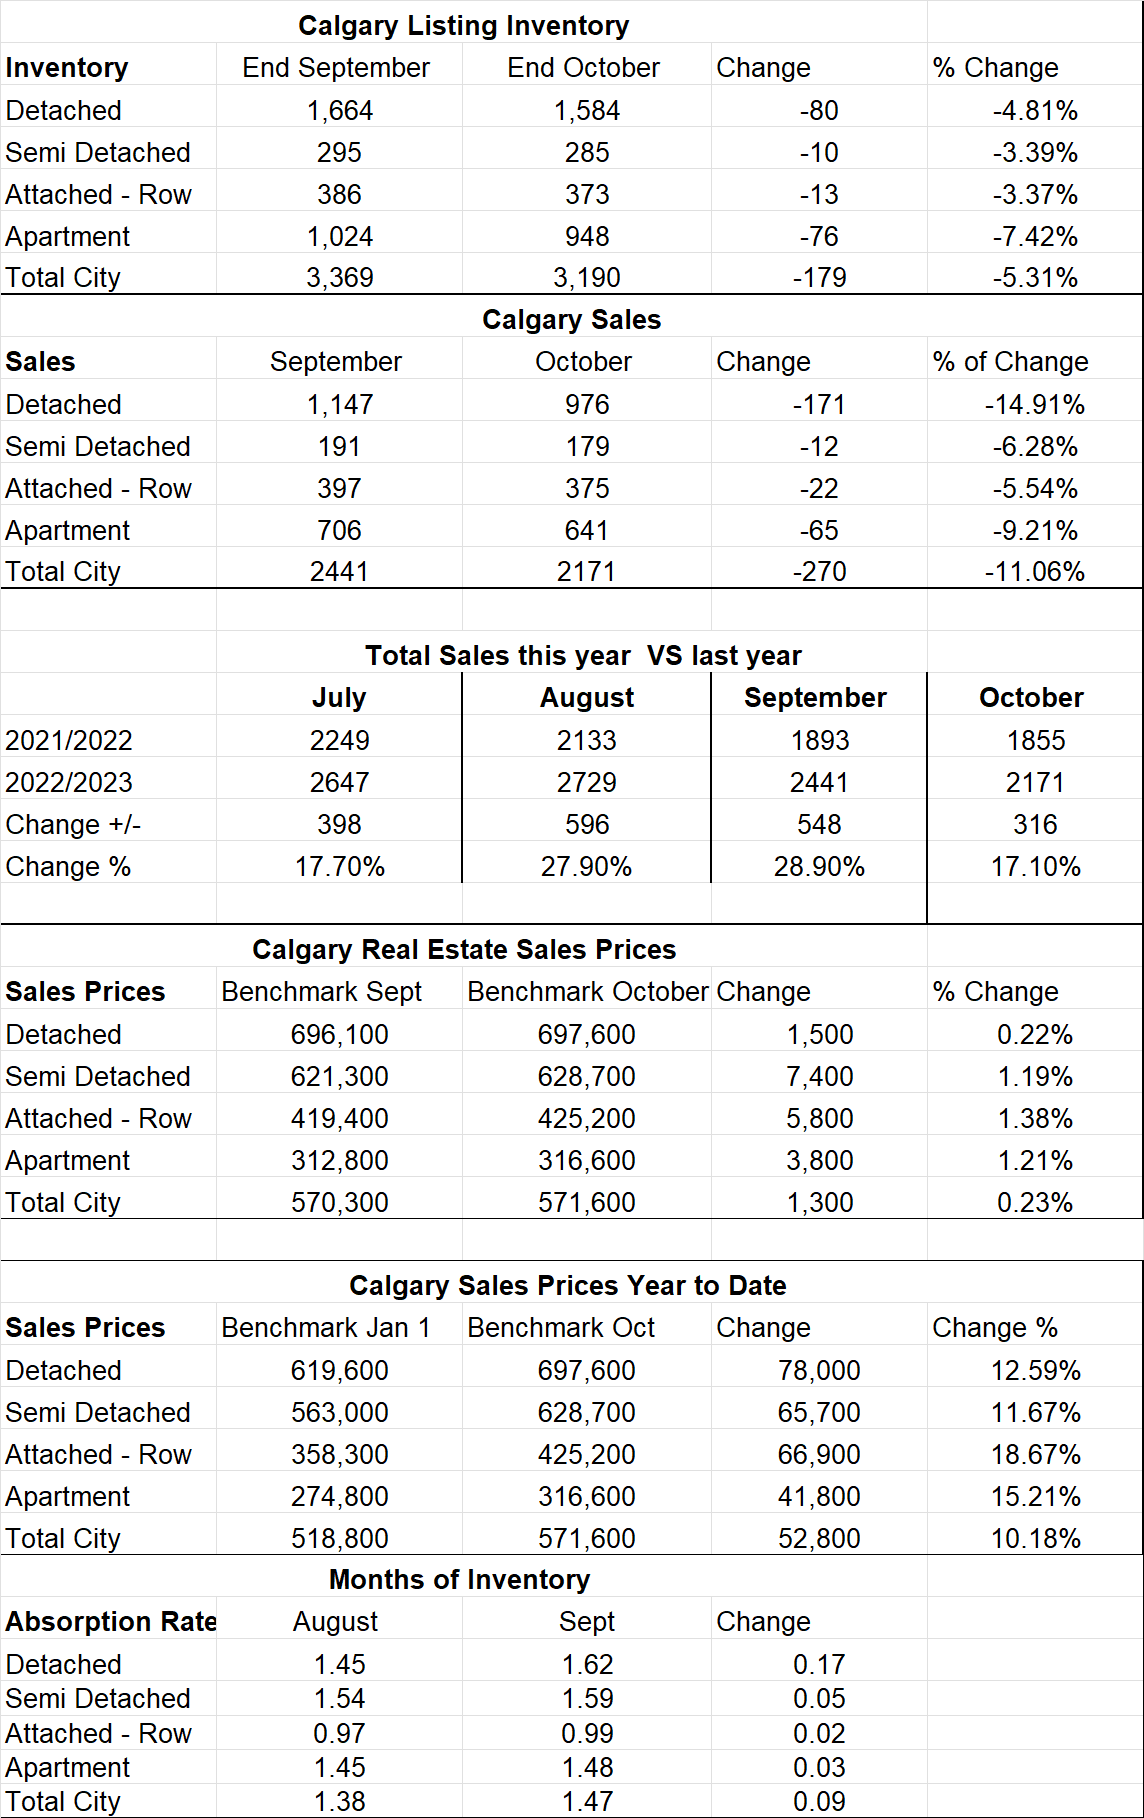
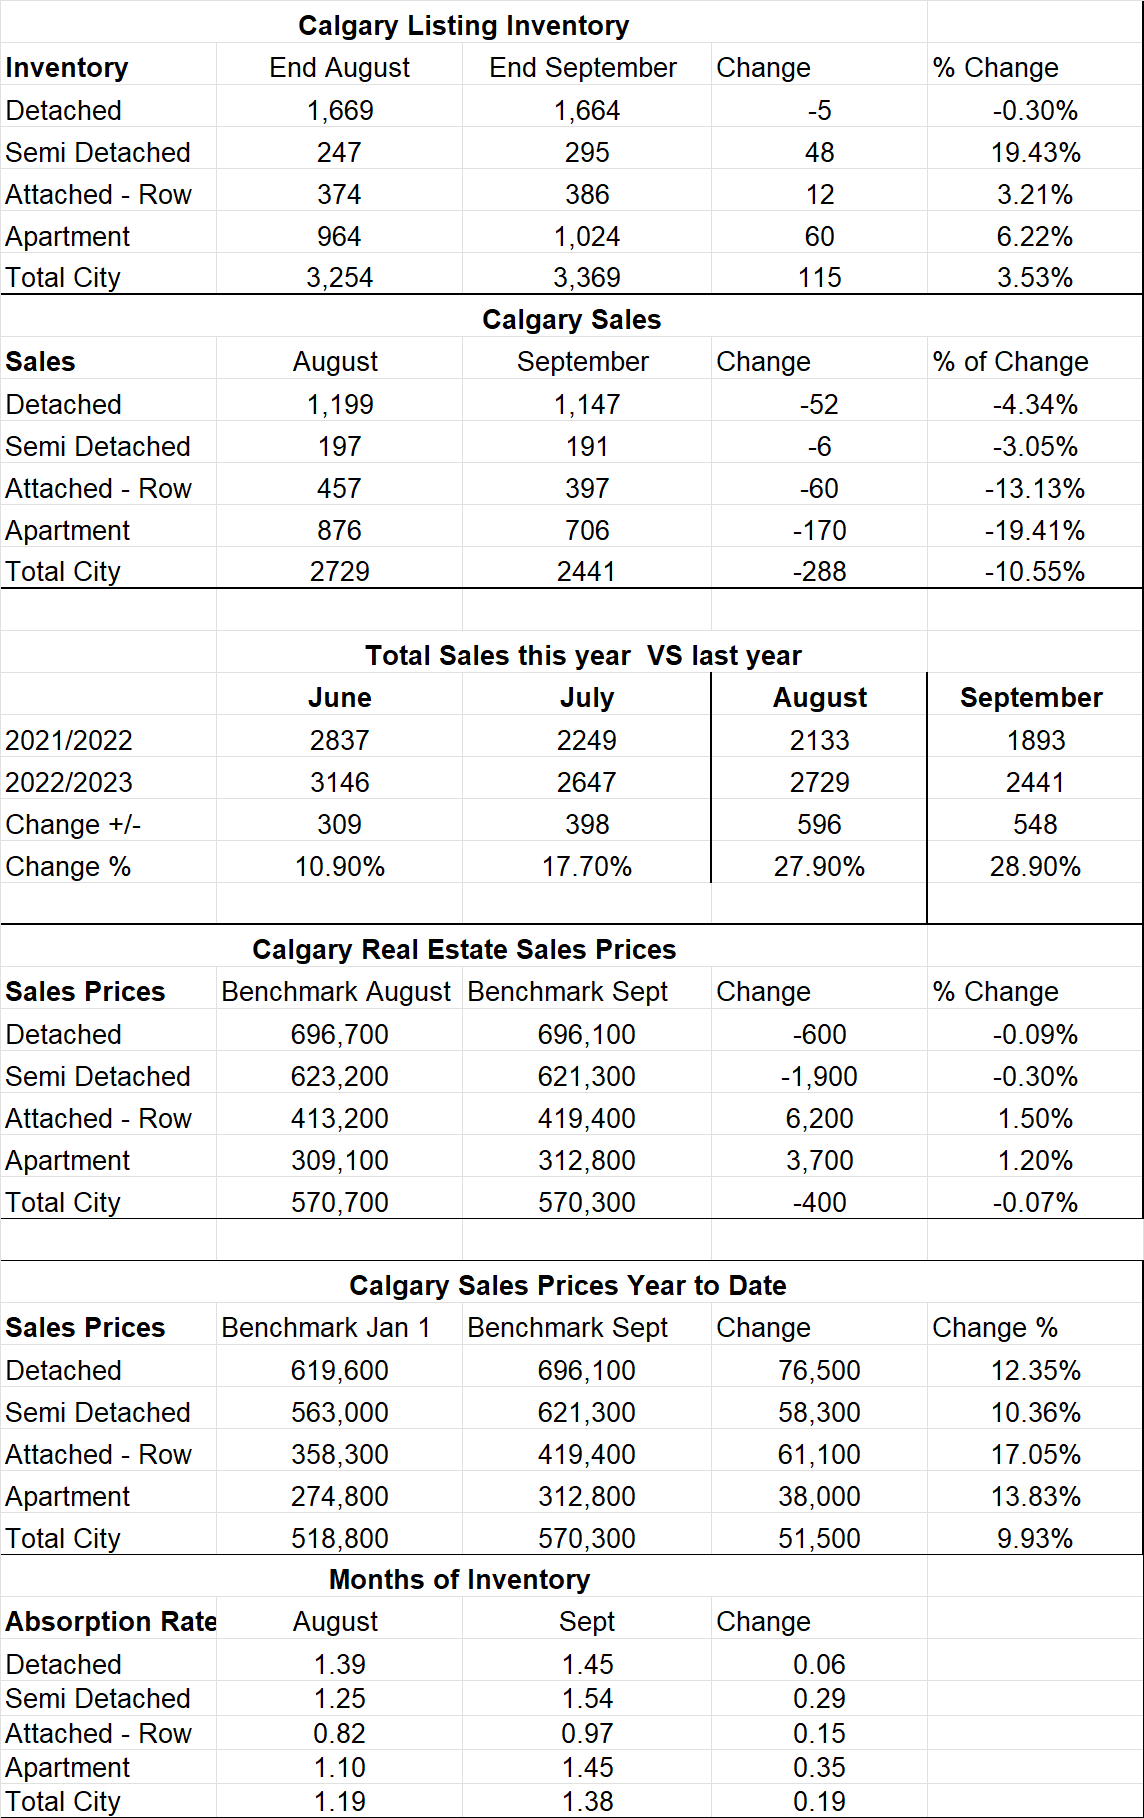
*Below is a summary of numbers in chart form. All numbers are taken from the Calgary Real Estate Boards monthly Stats package.
*All numbers vary by community and price ranges, if you would like stats specifically for your neighbourhood, please contact us.
See Calgary Real Estate Stats on Next Page Below
Source: Calgary Real Estate Board Realtors Stats