What is really happening in the Calgary Real Estate Market?
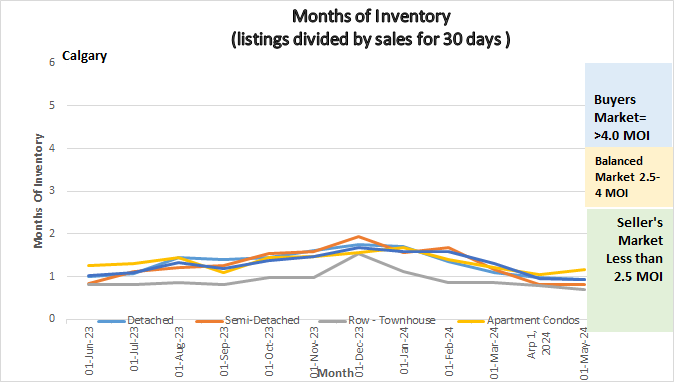
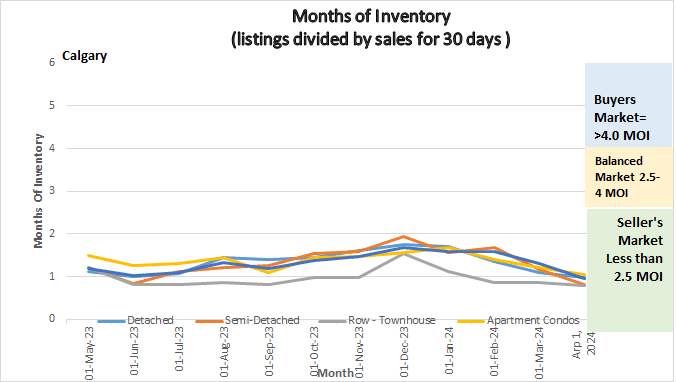
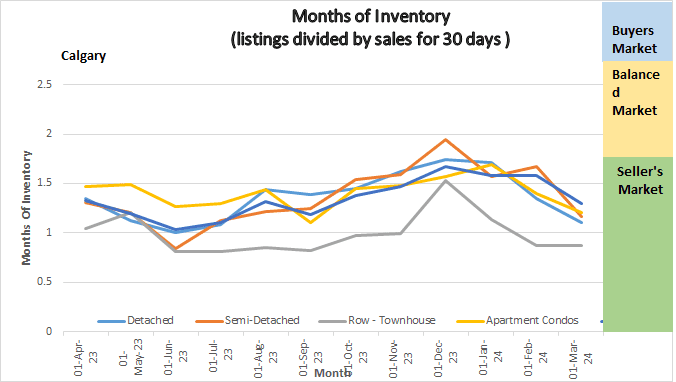
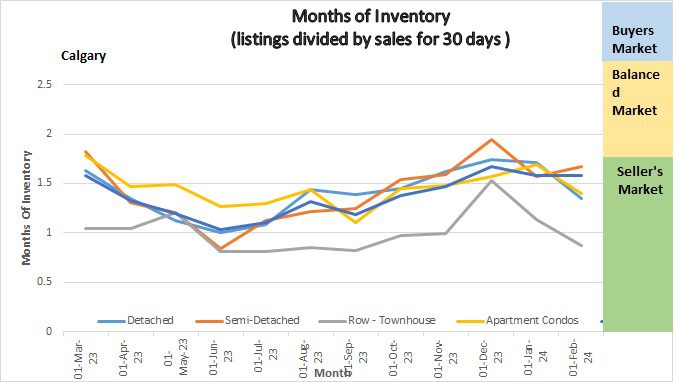
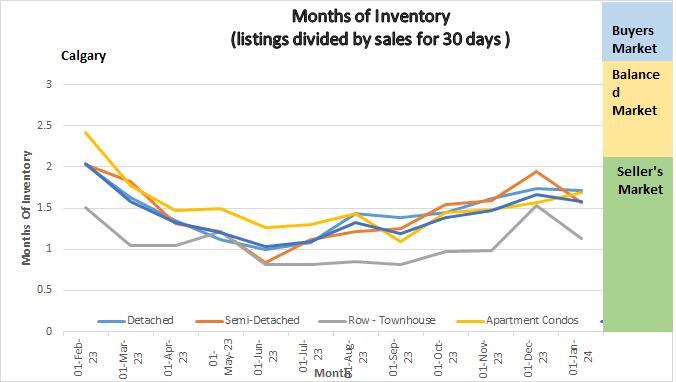
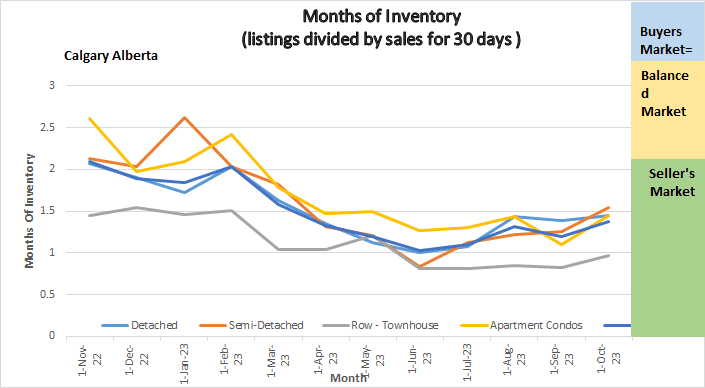
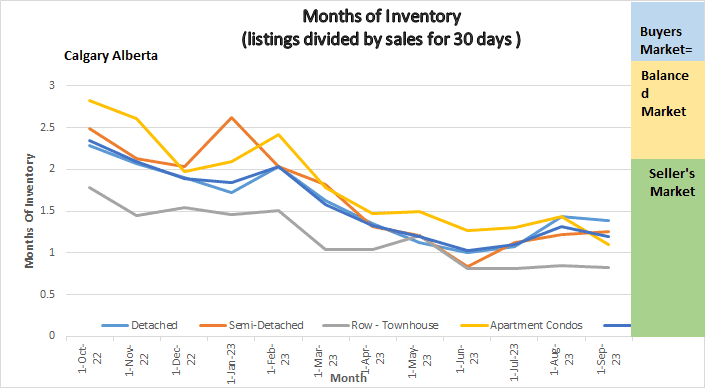
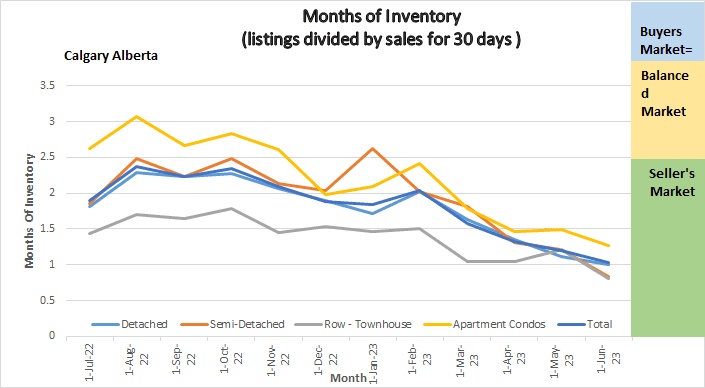
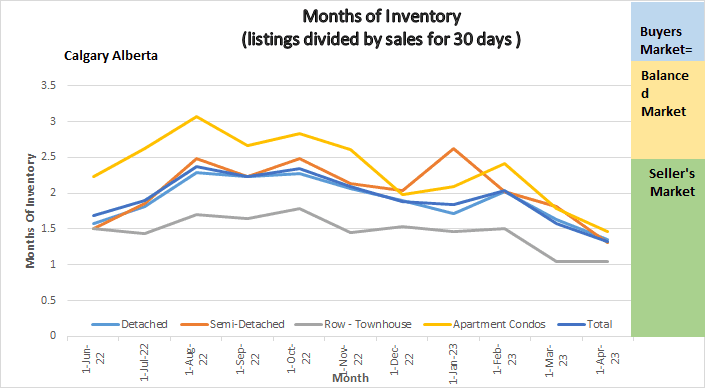
Following is a graph that shows the months of inventory for each housing sector. Looking at a one-year trendline gives you an indication of where things are really heading.
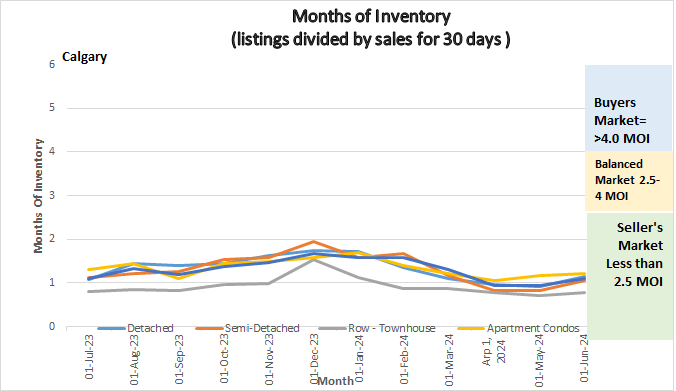
Graph showing Months of Inventory for Calgary Real Estate Market
Gord’s commentary for the month (just my opinion).
May 2024 Highlights
Change is on the way.
- Inventory is starting to increase (not substantially but consistently over last 3 weeks.
- Every Sector remains in a deep Seller’s Market
- Overall Benchmark Prices continue to rise.
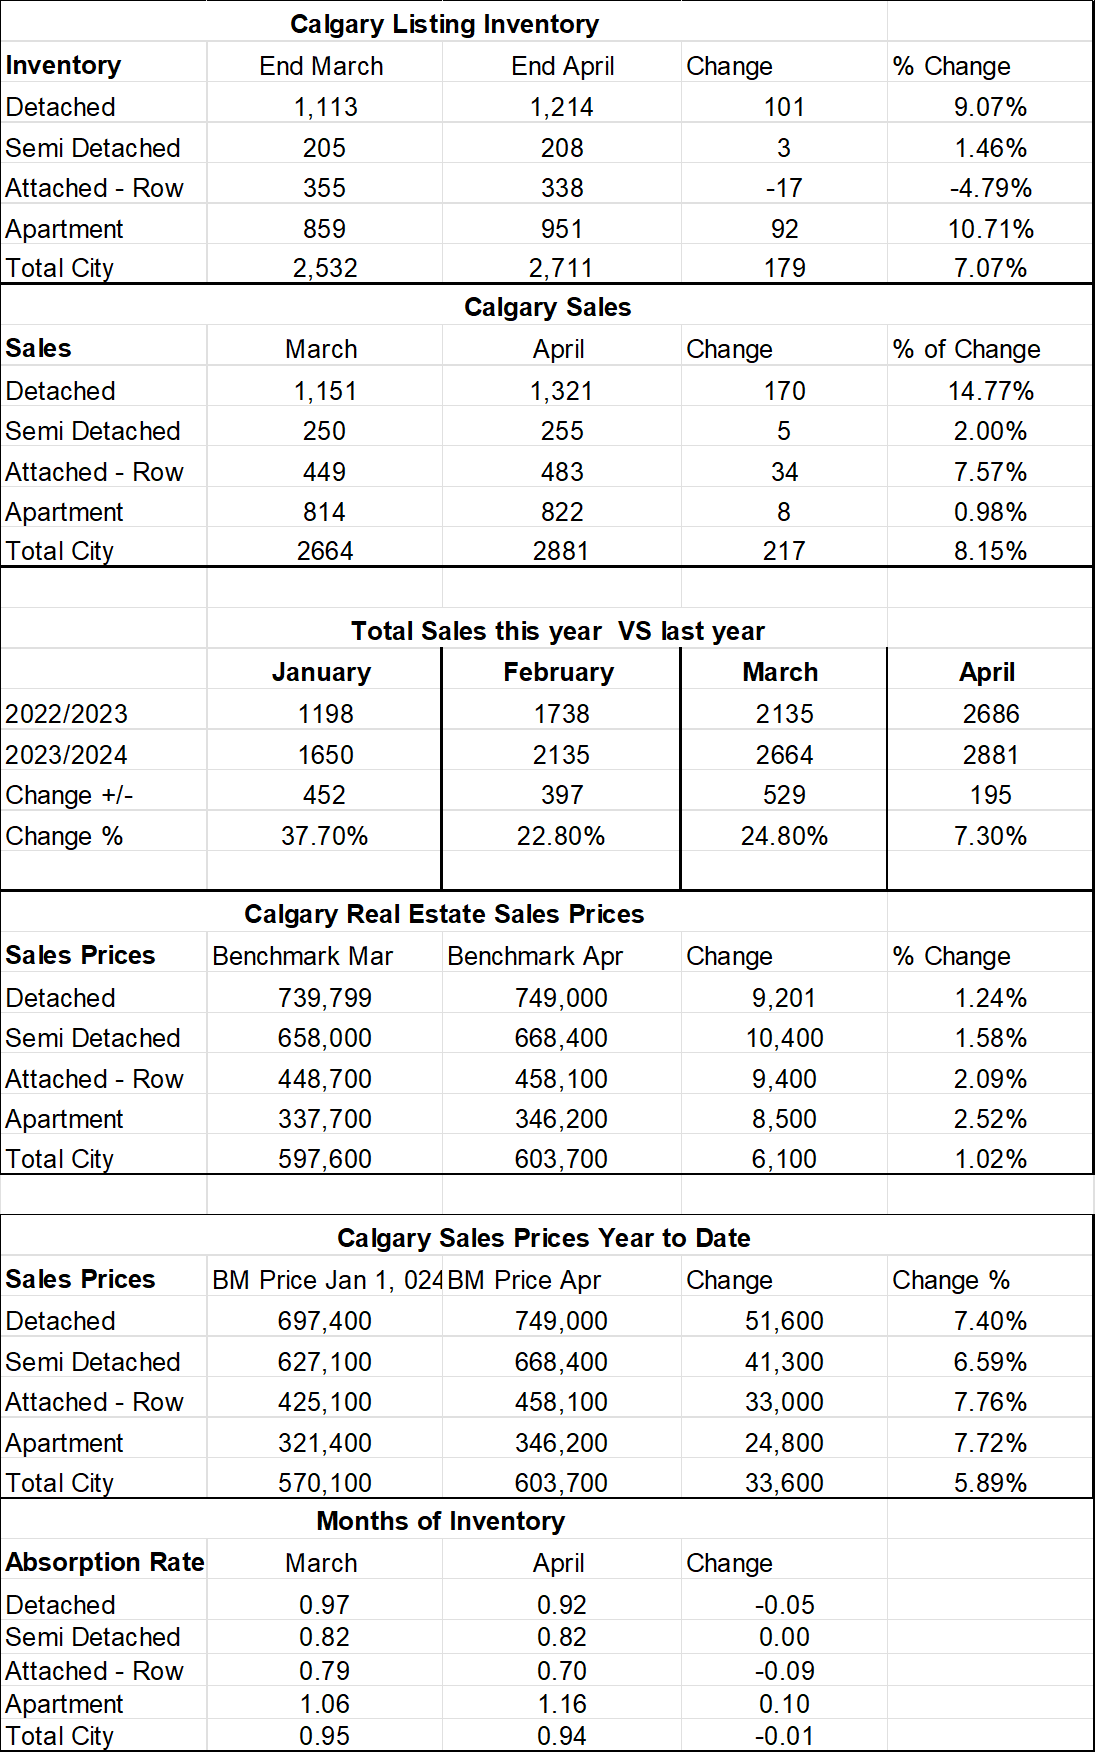
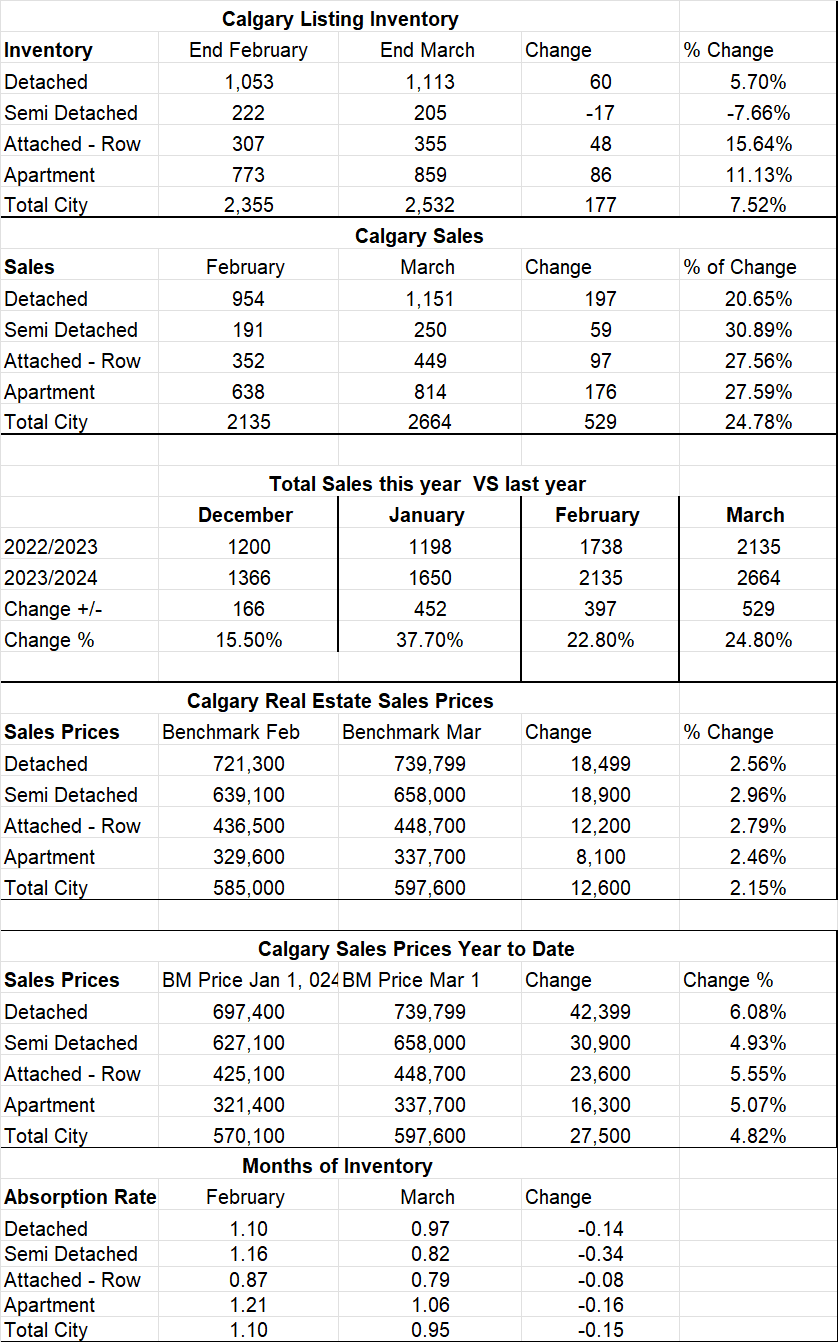
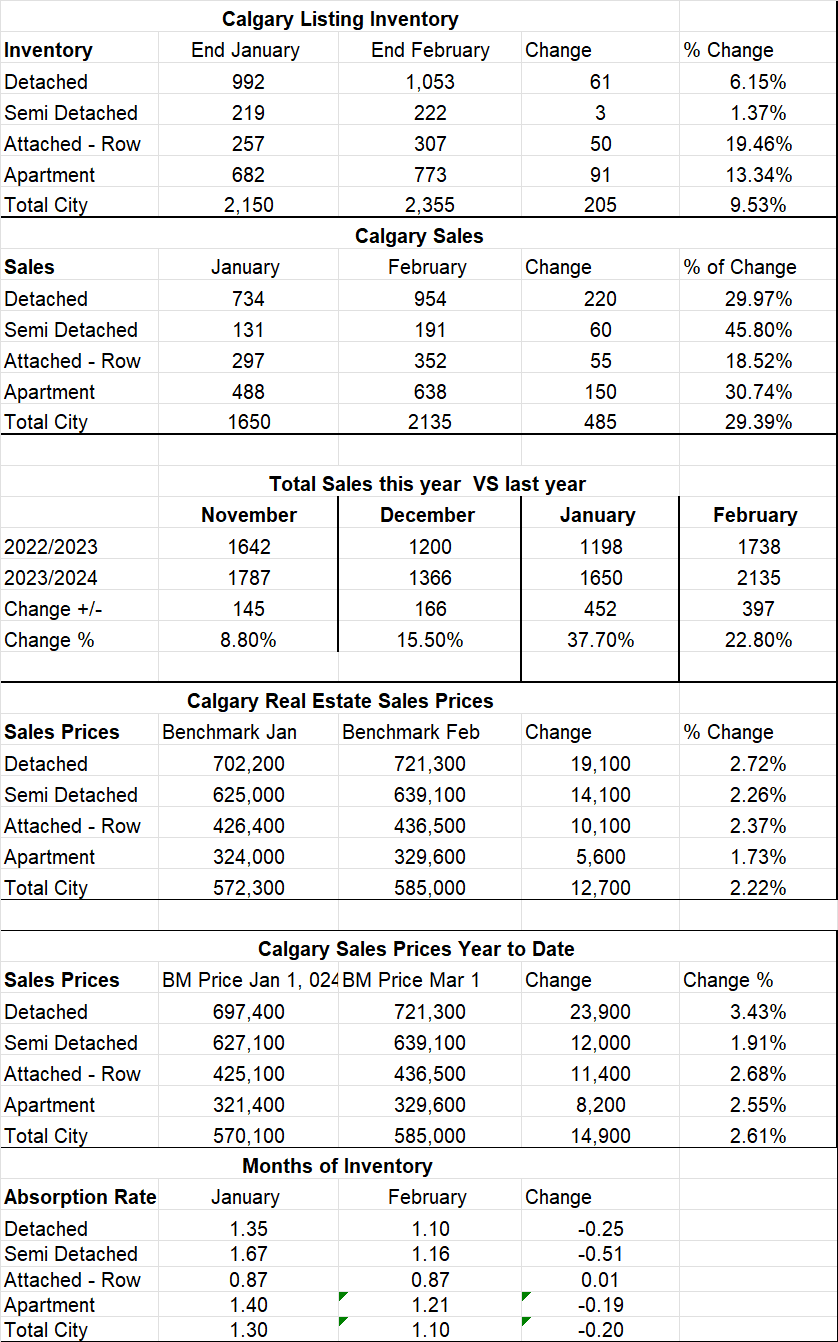
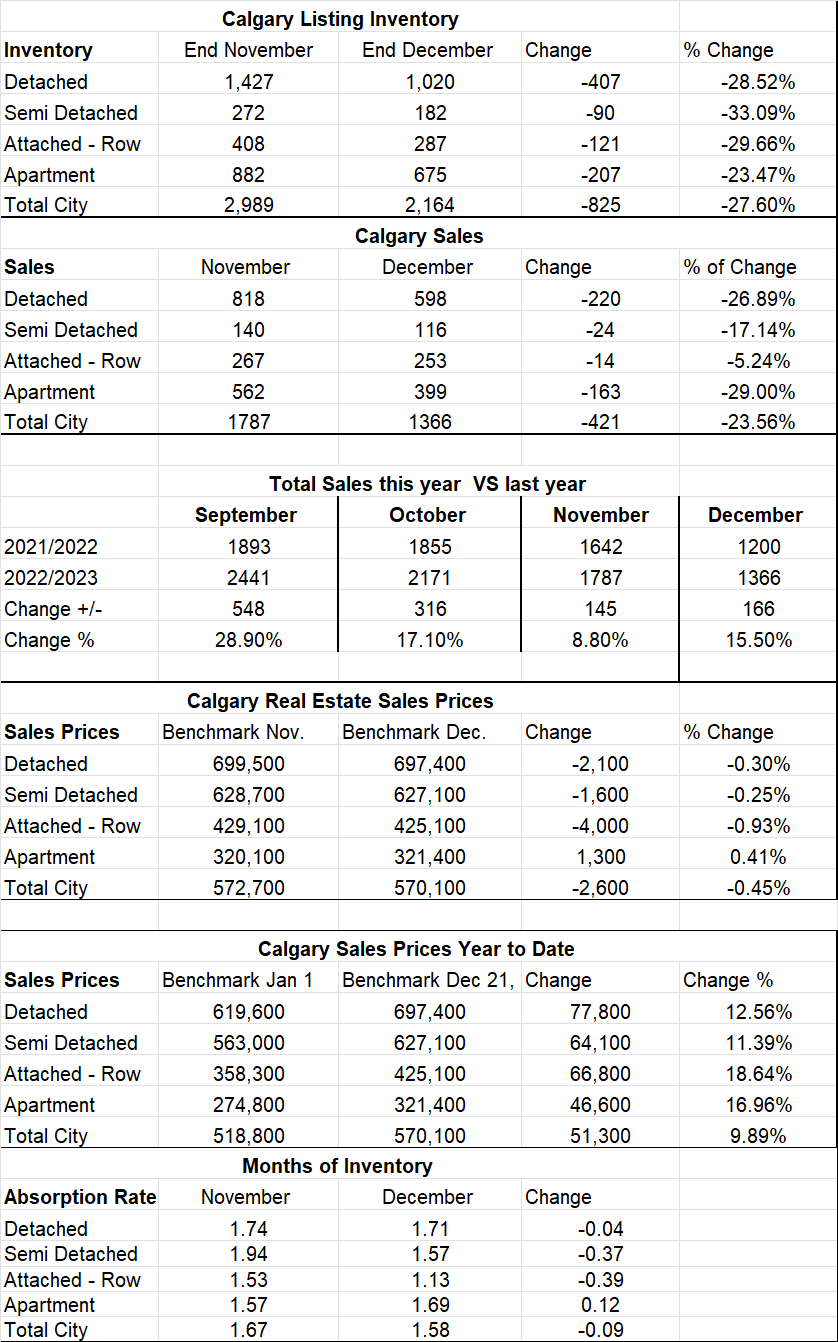
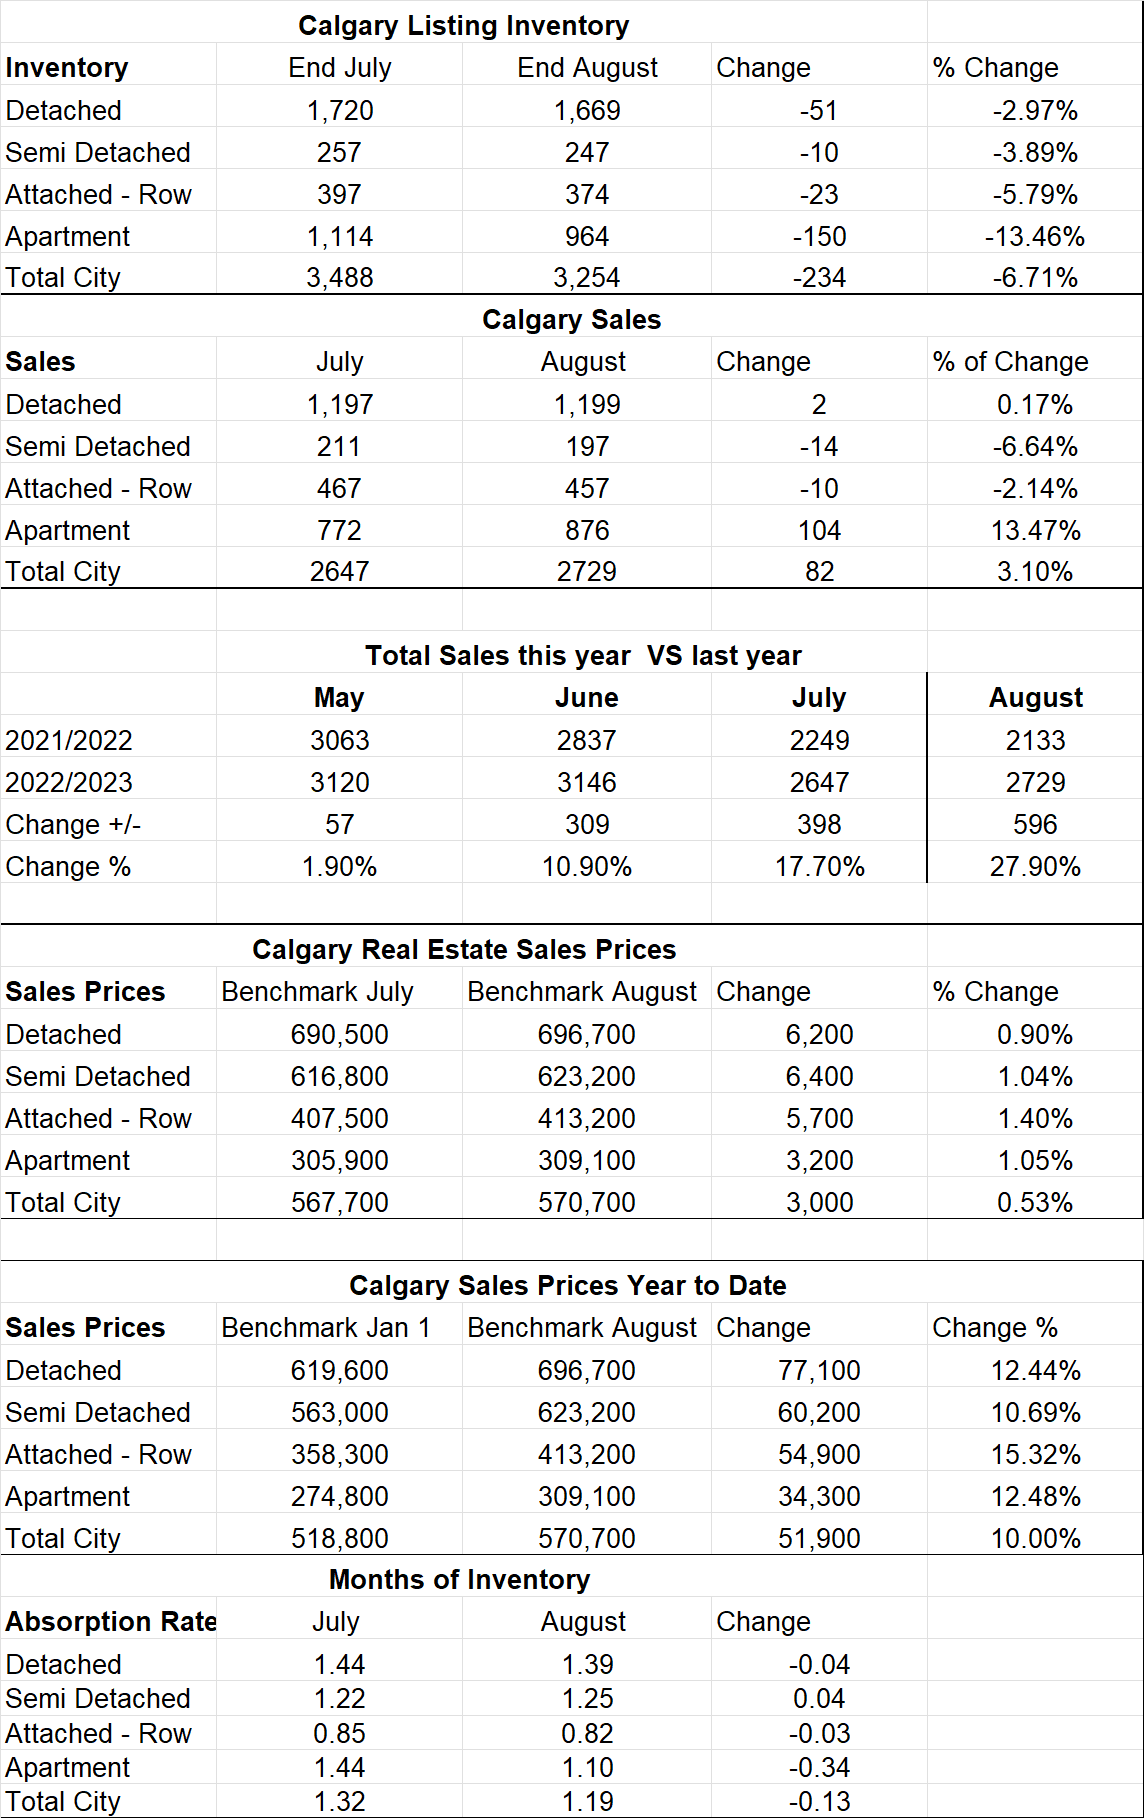
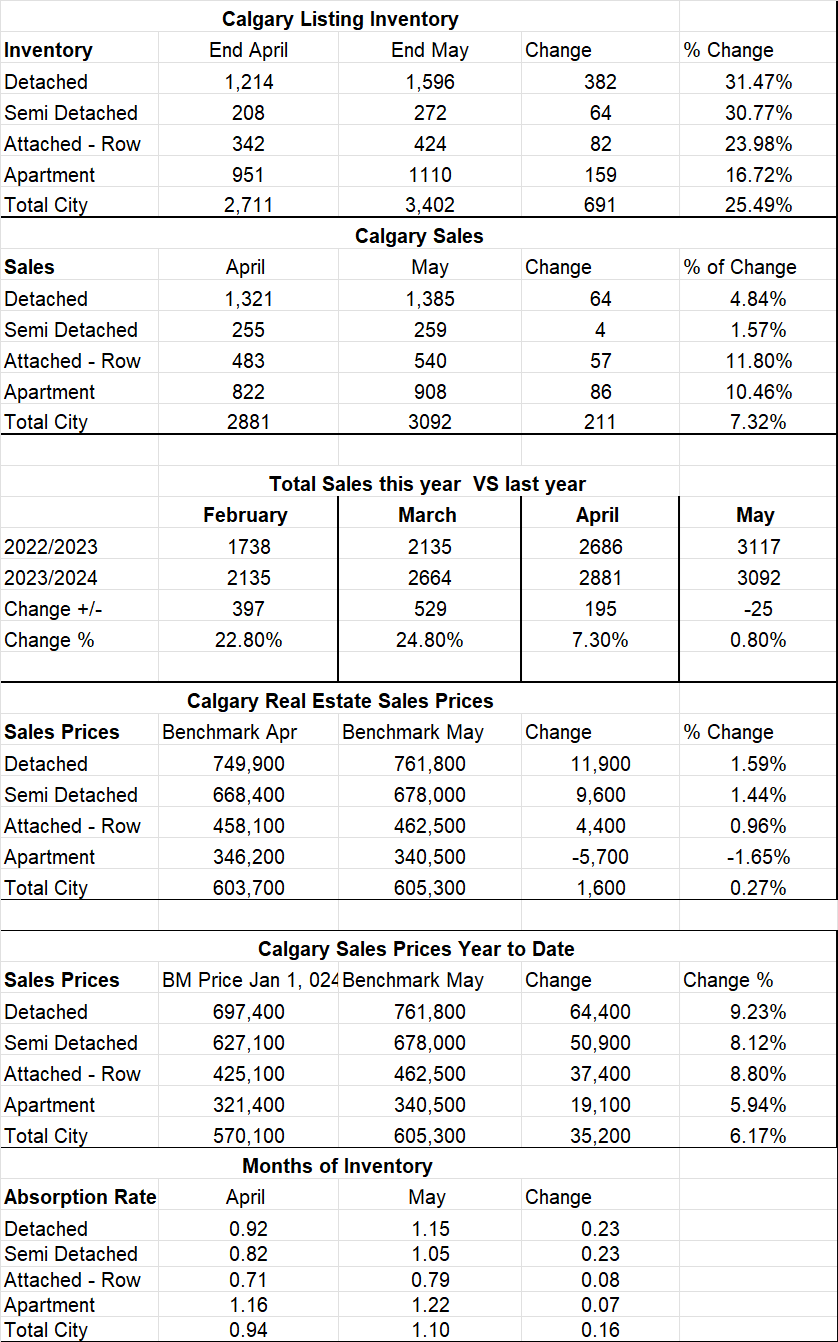
Calgary Listing Inventory
Our listing inventory increased in May by 691 Listings or by 25.49% which in my opinion is substantial. This is likely a sign that the market is starting to settle down. The increase was in all sectors with Detached homes leading the pack.
Calgary Sales:
Sales increased again in May by 7.3% over April. This increase was evenly spread across all sectors except the Semi-Detached sector where it increased by only 4.
Sales Compared to 2023:
Sales in May were down 25 sales (or .8%) from May of Last year. This again is another indication that the market is starting to settle down a bit.
| Jan | Feb | Mar | Apr | May | June | |
| 2023 | 1198 | 1738 | 2135 | 2686 | 3117 | |
| 2024 | 1650 | 2135 | 2664 | 2881 | 3092 | |
| Change | +452 | +397 | +529 | +195 | -25 | |
| % Change | 37.7% | 22.8% | 24.8% | 7.3% | – .8% |
Calgary Real Estate Benchmark Sales Prices:
The overall Benchmark price increased by another $1,600 0r .27% in May. Increases per sector were as follows: detached $11,900, Semi-Detached $9,600, Attached Row $4,400 and Apartment Condos decreased by $5,700.
Calgary Real Estate Benchmark Year to Date Sales Price: See chart below.
Year to date the entire market has increased by $35,200 or 6.17% which is substantial. Assuming that our inventory continues to increase then the sharp increases in prices should slow down.
Current Months of Inventory (Absorption Rate): Our Months of increased in all sectors by a little. Detached homes and Semi-detached increased the most at .23.
My Prediction for what is ahead:
Based on what I am seeing I believe we will see our Inventory grow over the next several months. We have to keep in mind that what is driving the market is immigration and until the immigration settles down, we may see an increase in inventory but we I believe it will be small and we will stay in a seller’s market for some time to come.
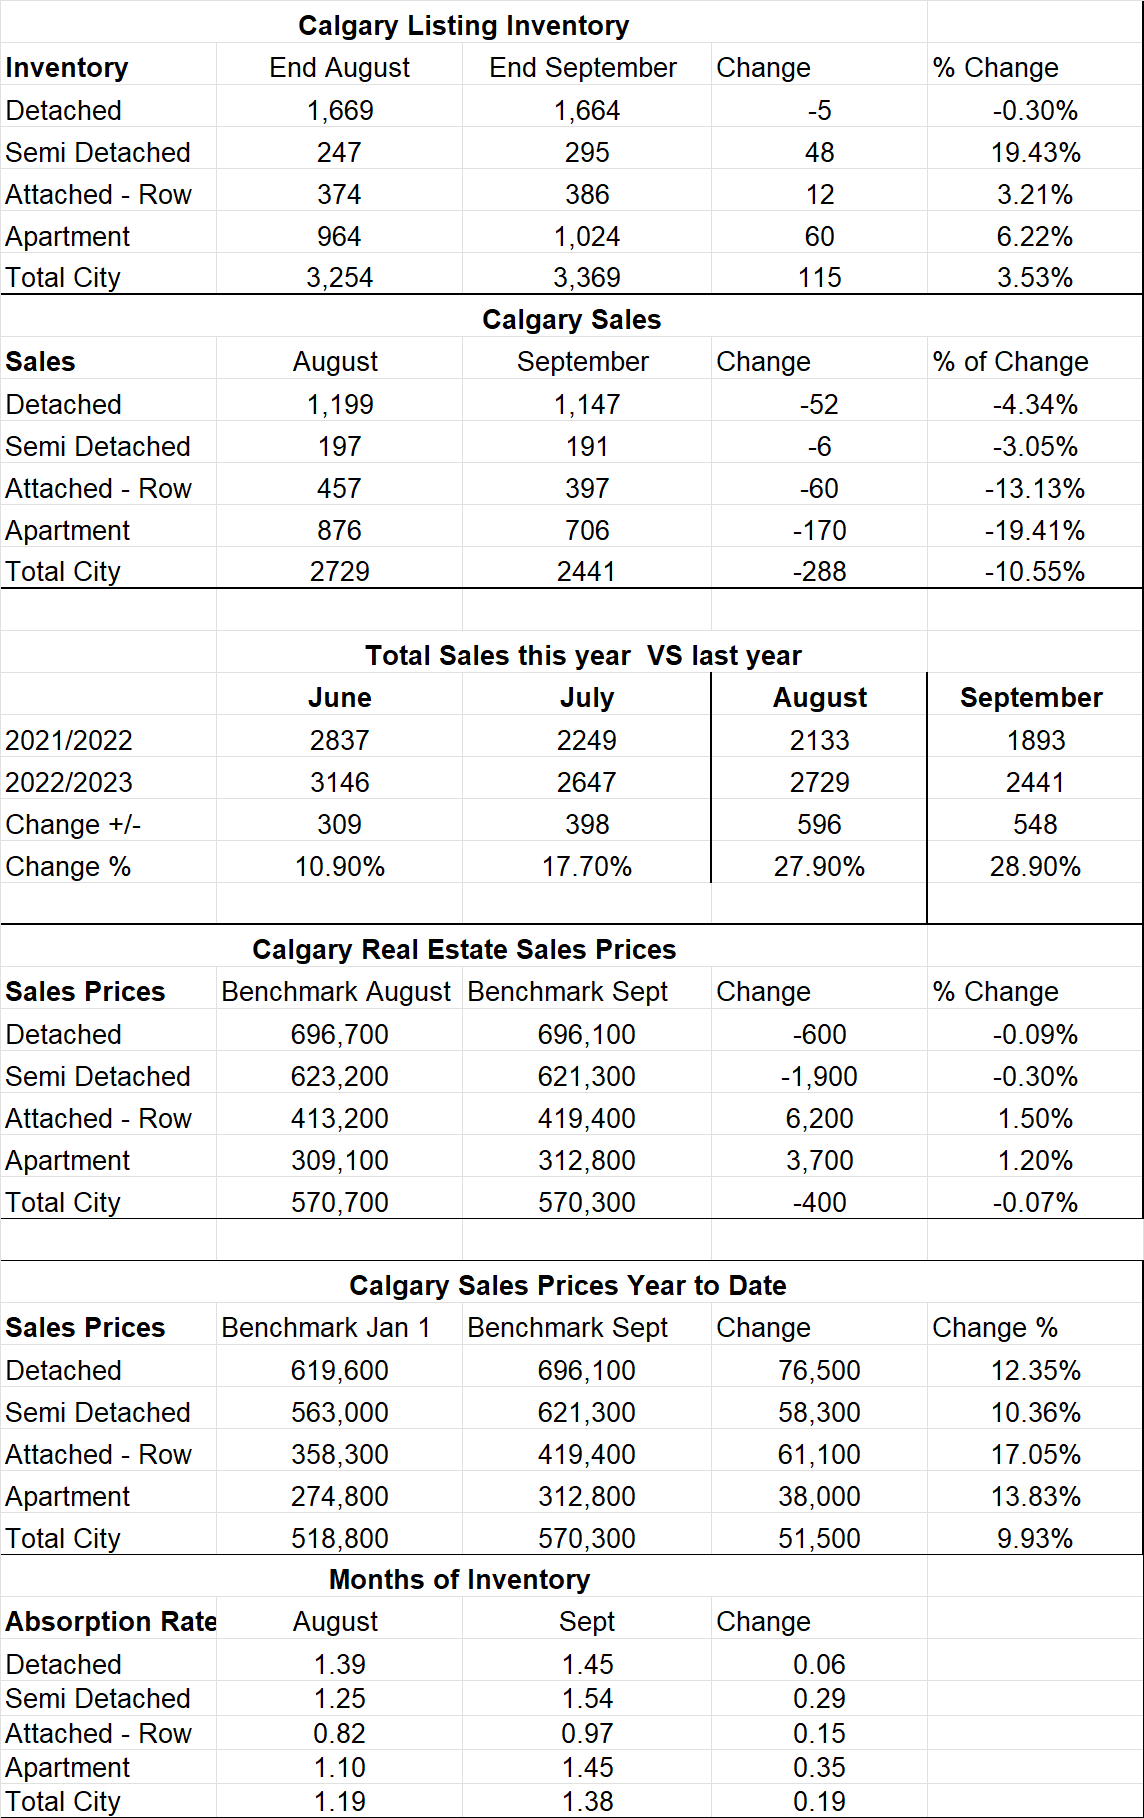
*Below is a summary of numbers in chart form. All numbers are taken from the Calgary Real Estate Boards monthly Stats package.
*All numbers vary by community and price ranges, if you would like stats specifically for your neighbourhood, please contact us.
Calgary Real Estate Board Stats