Archive for the ‘Blog’ Category

Tips to Winterize your home

Tuesday, October 3rd, 2017

To ensure your home is ready for the winter follow our tips to winterize. Most items you can do yourself but some will require a professional.

  1.  Hose bibs:  Turn off the water to all exterior hose bibs to prevent freezing.  Once water is off open the tap slightly to let water drain.   If you are in a newer home you will likely have a valve inside to drain all the water from the pipes.
  2. Irrigation systems:  If you have an irrigation system it is imperative that you have the lines blown out to remove all moisture from the lines. This again will prevent freezing of the pipes and ensures your system works next year.
  3.  Clean or replace your furnace filter.  Dirty filters make your furnace work harder and reduce its efficiency.
  4.  Have your heating system professionally inspected.  Atco gas will come out and check your system (I believe at no charge).
  5. If you have not done so recently have someone in to clean your vents.  This will reduce dust and give you better quality air inside your home.
  6. Clean your gutters and eavestroughs.  Clean eaves allow for proper flow of water so it does not just run over the gutters and land near your foundation.
  7. Do an  inspection of your windows and doors, are there any cracks or gaps that you can fill to reduce the amount of air that comes in cooling your home.
  8. *** Ensure the grade of your lot is sloping away from your foundation.  Grading towards the home is the number 1 cause of water seeping into basement.
  9. If you have a fireplace, get your Chimney professionally cleaned.  A dirty chimney is a fire hazard.


Calgary Real Estate Market Snapshot – Oct 1, 2017

Monday, October 2nd, 2017

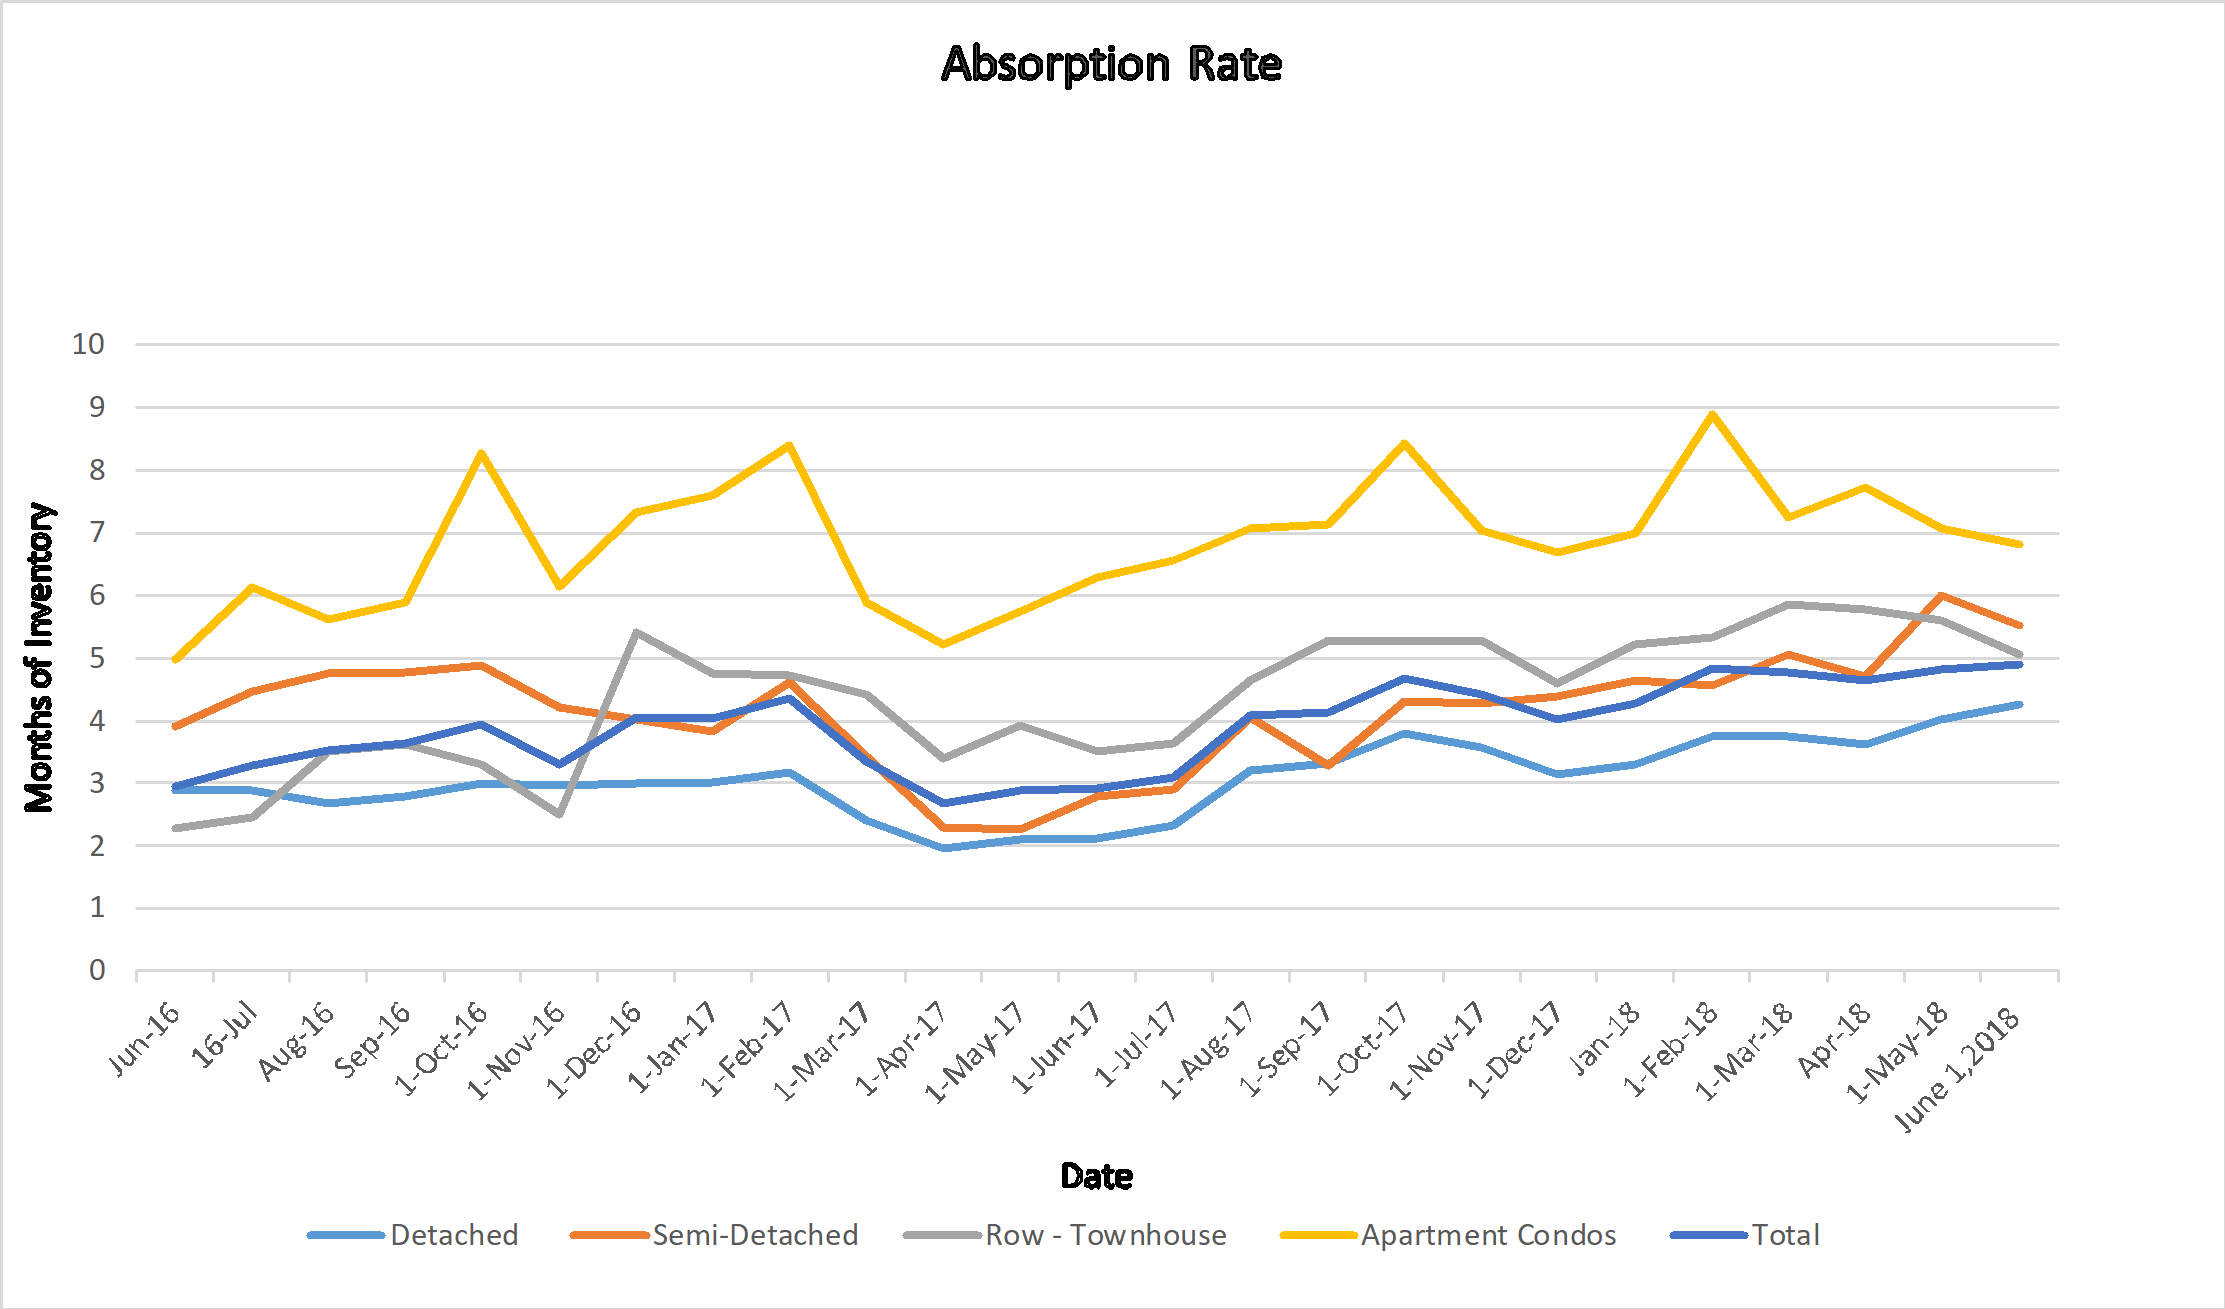
Calgary Absorption Rate

What is really happening in the Calgary Real Estate Market?

Stay ahead of everyone else by following our Monthly Market Snapshot of the Calgary Real Estate Market This shows what’s really happening! The market is driven by supply and demand so here we show the inventory (supply) and sales (demand) and most importantly the relationship between the two and how it affects the price of Calgary Real Estate.  A simple way to keep up to date with how the market is trending and to stay ahead of most! All numbers are taken from the Calgary Real Estate Boards Stats package for Realtors. I have also included some general comments which are simply my opinion.

Absorption Rate (Months of Inventory)   (the inventory divided by the number of sales in the last month). What does this mean you might ask?

Buyer’s Market >4.0 Drives prices down
Balanced Market Between 2.4 to 4.0 Prices typically remain stable
Seller’s Market <2.4 Drives prices up


Absorption Rate

The Absorption rate for September increased in all categories except attached-row homes where it dropped marginally.   The one to note is apartment condos which increased by 1.29 putting us at 8.42 months of inventory.  

  Aug  2017  Sept  2017  Change
Detached 3.32 3.79 0.46
Semi Detached 3.27 4.31 1.04
Attached – Row 5.27 5.25 -0.02
Apartment 7.13 8.42 1.29
Total City 4.13 4.69 0.56

 Calgary Listing Inventory

In September all categories stayed flat except for detached homes which saw an increase of 199 listings.

Inventory Aug  2017  Sept  2017  Change
Detached 3280 3479 199
Semi Detached 585 621 36
Attached – Row 991 993 2
Apartment 1769 1768 -1
Total City 6624 6861 237


Calgary Sales:

Sales for September saw a decrease in all categories except attached-row homes which increased by 1.  A decrease at this time of year is fairly normal and I would classify this as simply seasonal.

Of interest Calgary year to date sales are 7% above last year’s sales.

Calgary Sales  Aug  2017  Sept  2017  Change % Change
Detached 987 919 -68 -6.89%
Semi Detached 179 144 -35 -19.55%
Attached – Row 188 189 1 0.53%
Apartment 248 210 -38 -15.32%
Total City 1602 1462 -140 -8.74%


Calgary Real Estate Sales Prices:

Okay, I will eat my words here.  Last month I predicted that prices would remain fairly even except for attached – row houses and apartment condos which I said should drop.  As you can see below I was wrong however with the absorption rates I again will predict all categories will remain fairly flat with the exception of apartment condos where a decrease is likely.

  Sales Prices Aug   2017Benchmark Price   Sept  2017  Benchmark Price Change
Detached 510,900 508,900 -2,000
Semi Detached 419,600 419,400 -200
Attached – Row 307,000 306,900 -100
Apartment 263,300 263,700 400
Total City 442,300 441,500 -800


Sales Prices “Year to Date”  

Sales Prices Jan 1, 2017    Benchmark Price  Sept  2017  Benchmark Price Change

$

% Change
Detached 498,700 508,900 10,200 2.05%
Semi Detached 406,800 419,400 12,600 3.10%
Attached – Row 302,600 306,900 4,300 1.42%
Apartment 265,000 263,700 -1,300 -0.49%
Total City 433,400 441,500 8,100 1.87%

 **Please note that these numbers include only Calgary homes and do change on a community basis and more so for towns.  This report does not include rural properties.  If you would like to find stats on your community just let me know.  If you have any questions about this summary or Real Estate questions please feel free to contact us.


TSW Real Estate Group


3 Reasons to Talk to a Realtor Today

Sunday, October 1st, 2017

You might naturally assume that it is most important to talk to a Realtor when you’re selling or buying a home. But there are many other circumstances in which it makes sense to give me a call. Here are a few examples.

1. When you’re at the “thinking about it” stage.  If you’re just thinking about selling your home, and haven’t made a firm decision yet, you might feel uncomfortable calling a Realtor. Don’t be. It’s better to gather the facts to assist you in your decision making,  I welcome your call.  We can discuss what your current property will likely sell for in today’s market, and determine the type of home you qualify to buy. That way, you’ll have some clarity and be able to make a more informed decision.

2. If you’re nervous about the selling process.   If you haven’t sold a home before, you might be concerned about what’s involved in the process. You might even worry that putting your home on the market is going to be a lot of work and create a lot of turbulence for you and your family. Fortunately, selling your home doesn’t need to be scary. In fact, a big part of my job as a Realtor is to make the process as smooth and trouble-free as possible. So if you have concerns about selling your home, you should give me a call.

3. If you have questions You likely have questions about the local real estate scene from time to time. You might have questions like: “How much did that home around the corner sell for?  How is the Market?  Is a condo or a house a better investment.  How much does it cost to build a house in Calgary? There are many types of questions and we will do our best to get you the answers you need.

Contact us


What Do Interior Designers Do?

Friday, September 22nd, 2017

If you want to transform a room into something that’s functional, beautiful and perfectly matched to your taste, then you might want to hire an interior designer. It’s an interior designer’s job to come up with imaginative ideas that will wow you. It’s a myth that interior designers just deal with paint colours, décor and furnishings. In fact, according to the Interior Designers Institute, these professionals have the training needed to handle all aspects of a renovation or remodeling project, including selecting and managing contractors. They can direct a project from beginning to end.

If you want to renovate your basement into a stunning home theatre and gathering place, an interior designer can:

• Draw out several concepts for you to choose from

• Purchase the best building materials

• Hire the contractors

Manage the project. He or she can even pick out classic movie pictures for the walls!

If you would like to speak to a local interior designer I would be happy to refer you to one of our partners.

Refer me to a interior designer 

Calgary Real Estate Market Snapshot

Sunday, September 3rd, 2017

What is Really Happening in the Calgary Real Estate Market?

Stay ahead of everyone else by following our Monthly Market Snapshot of the Calgary Real Estate Market This shows what’s really happening! The market is driven by supply and demand so here we show the inventory (supply) and sales (demand) and most importantly the relationship between the two and how it affects the price of Calgary Real Estate.  A simple way to keep up to date with how the market is trending and to stay ahead of most! All numbers are taken from the Calgary Real Estate Boards Stats package for Realtors. I have also included some general comments which are simply my opinion.

Absorption Rate (Months of Inventory)   (the inventory divided by the number of sales in the last month). What does this mean you might ask?

Buyer’s Market >4.0 Drives prices down
Balanced Market Between 2.4 to 4.0 Prices typically remain stable
Seller’s Market <2.4 Drives prices up


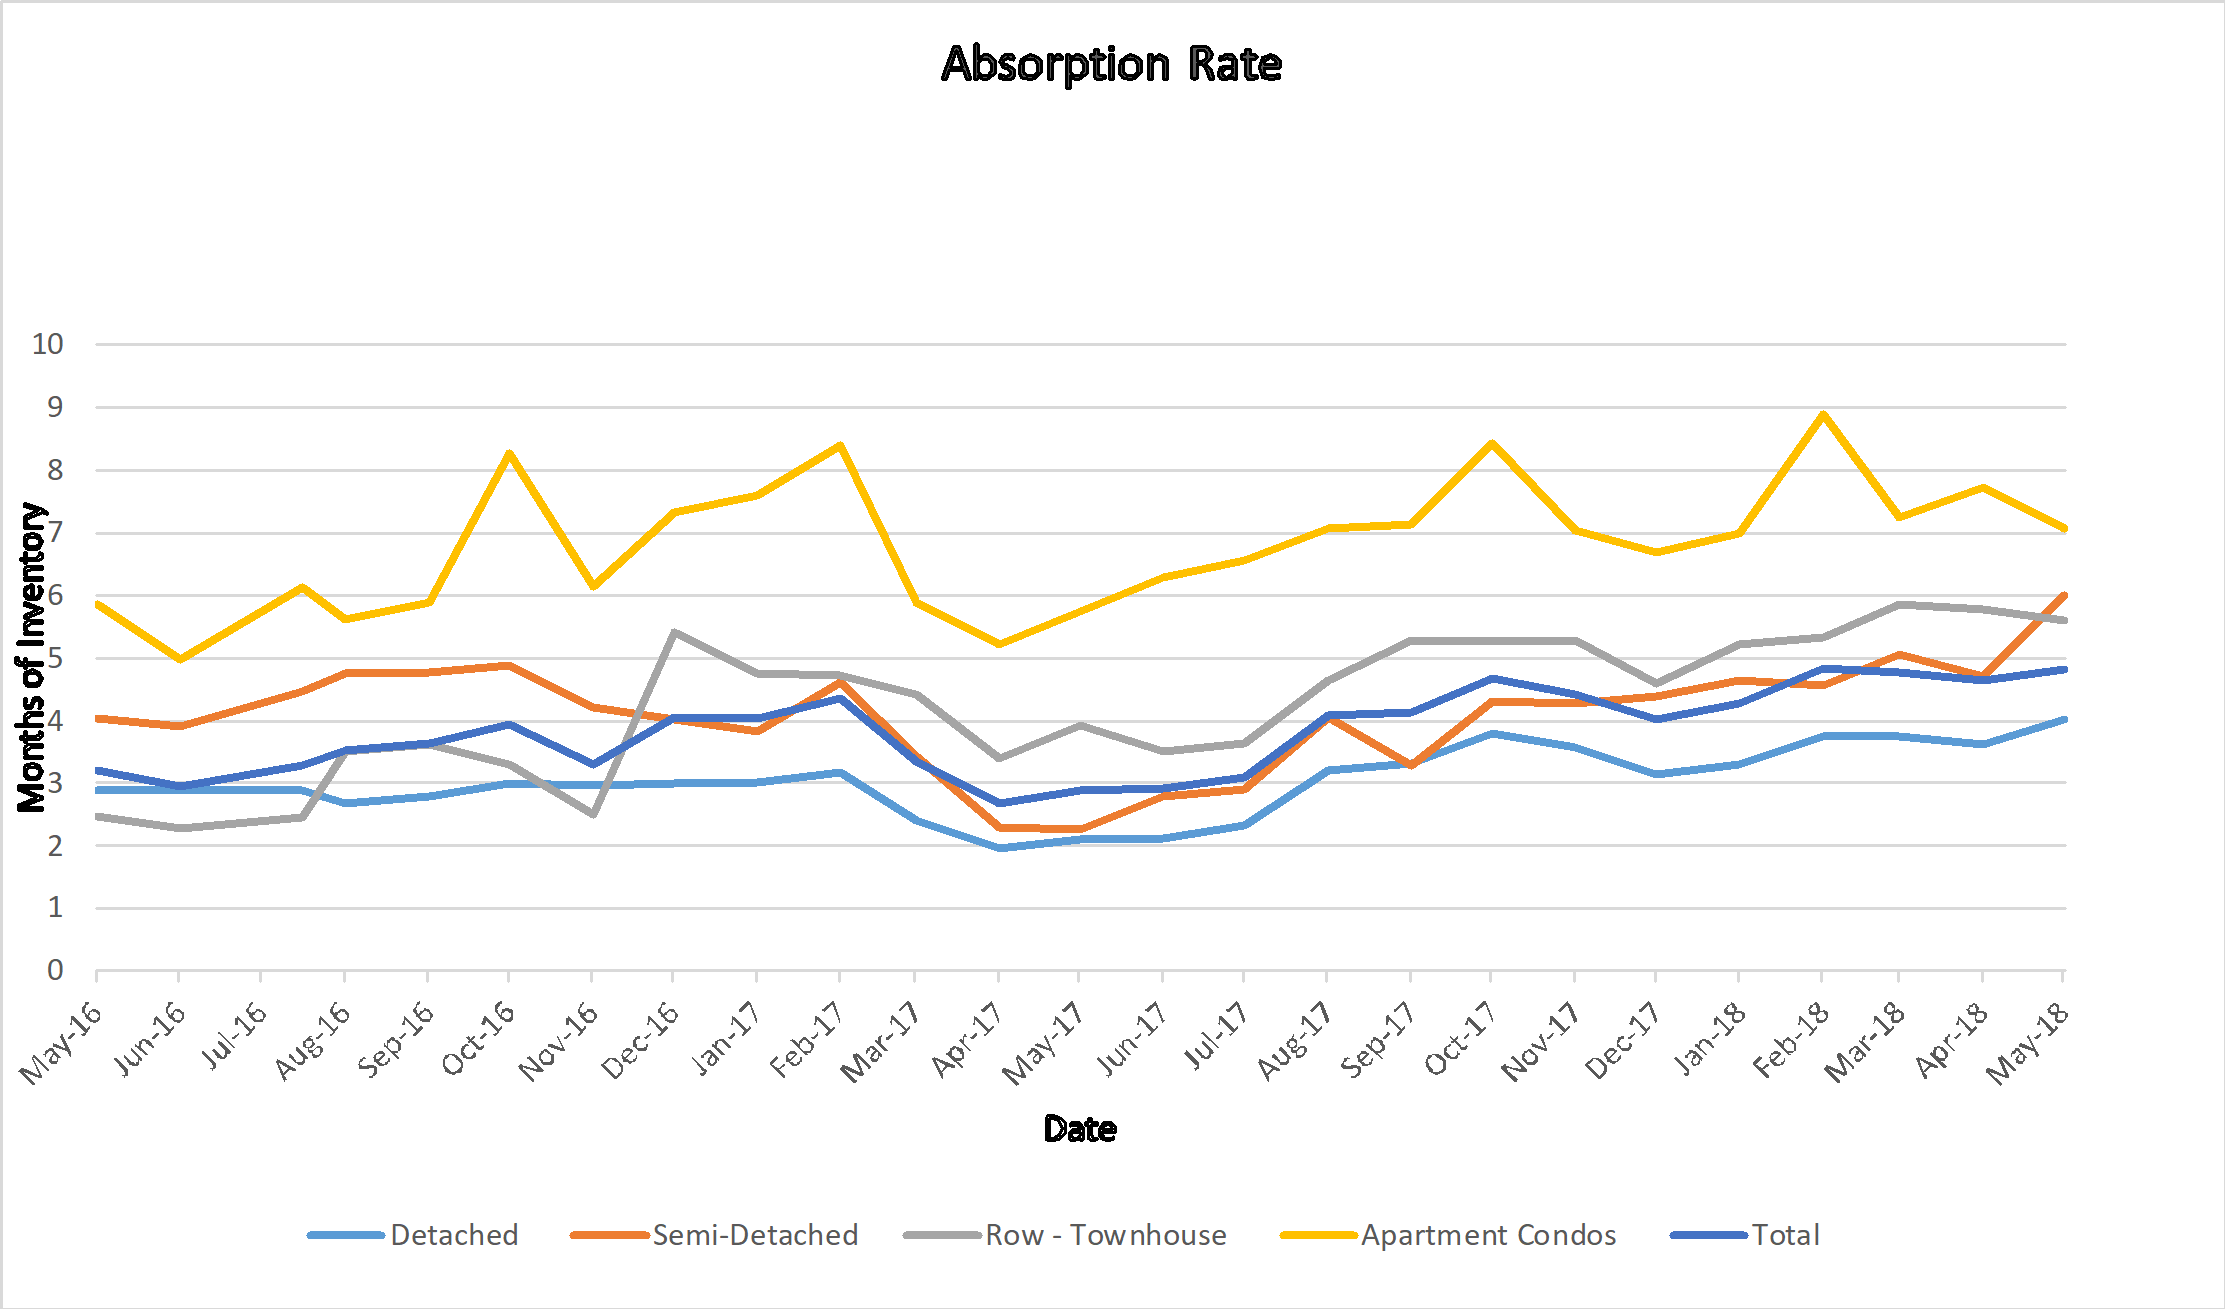
Current Absorption Rate

The Absorption rate for August showed a very slight increase for detached homes, and Apartment condos.   Attached (Row) houses showed a larger increase of .64 while Semi-detached (Duplexes) showed a substantial decrease of .79.    

  July 2017 Aug  2017  Change
Detached 3.21 3.32 0.11
Semi Detached 4.05 3.27 -0.79
Attached – Row 4.63 5.27 0.64
Apartment 7.07 7.13 0.06
Total City 4.08 4.13 0.06


Calgary Listing Inventory

In August we saw most categories stay almost the same. The one exception is Apartment Condos and they decreased by 41 listings.  I believe the reason for this is listings expiring and not a sales increase.

Inventory July 2017 Aug  2017  Change
Detached 3268 3280 12
Semi Detached 596 585 -11
Attached – Row 1001 991 -10
Apartment 1810 1769 -41
Total City 6675 6624 -51


Calgary Sales:

August sales remained very consistent to July’s numbers with all being within 35 either way.

Calgary Sales  July 2017 Aug  2017  Change % Change
Detached 1018 987 -31 -3.05%
Semi Detached 147 179 32 21.77%
Attached – Row 216 188 -28 -12.96%
Apartment 256 248 -8 -3.13%
Total City 1637 1602 -35 -2.14%


Calgary Real Estate Sales Prices:

Interestingly enough all categories except Row houses (townhouses) took a small drop this month.

The largest decrease was in apartment condos and my opinion is that due to the high absorption rate this will continue for some time.

  Sales Prices July 2017 Benchmark Price   Aug  2017  Benchmark Price Change
Detached 512,100 510,900 -1,200
Semi Detached 420,800 419,600 -1,200
Attached – Row 306,700 307,000 300
Apartment 266,200 263,300 -2,900
Total City 443,600 442,300 -1,300


Sales Prices “Year to Date”  

Sales Prices Jan 1, 2017    Benchmark Price  Aug  2017  Benchmark Price Change

$

% Change
Detached 498,700 510,900 12,200 2.45%
Semi Detached 406,800 419,600 12,800 3.15%
Attached – Row 302,600 307,000 4,400 1.45%
Apartment 265,000 263,300 -1,700 -0.64%
Total City 433,400 442,300 8,900 2.05%

 **Please note that these numbers include only Calgary homes and  change on a community basis and more so for towns.  This report does not include rural properties.  If you would like to find stats on your community just let me know.  If you have any questions about this summary or Real Estate questions please feel free to contact us.


August 1, 2017 Market Snapshot

Wednesday, August 2nd, 2017

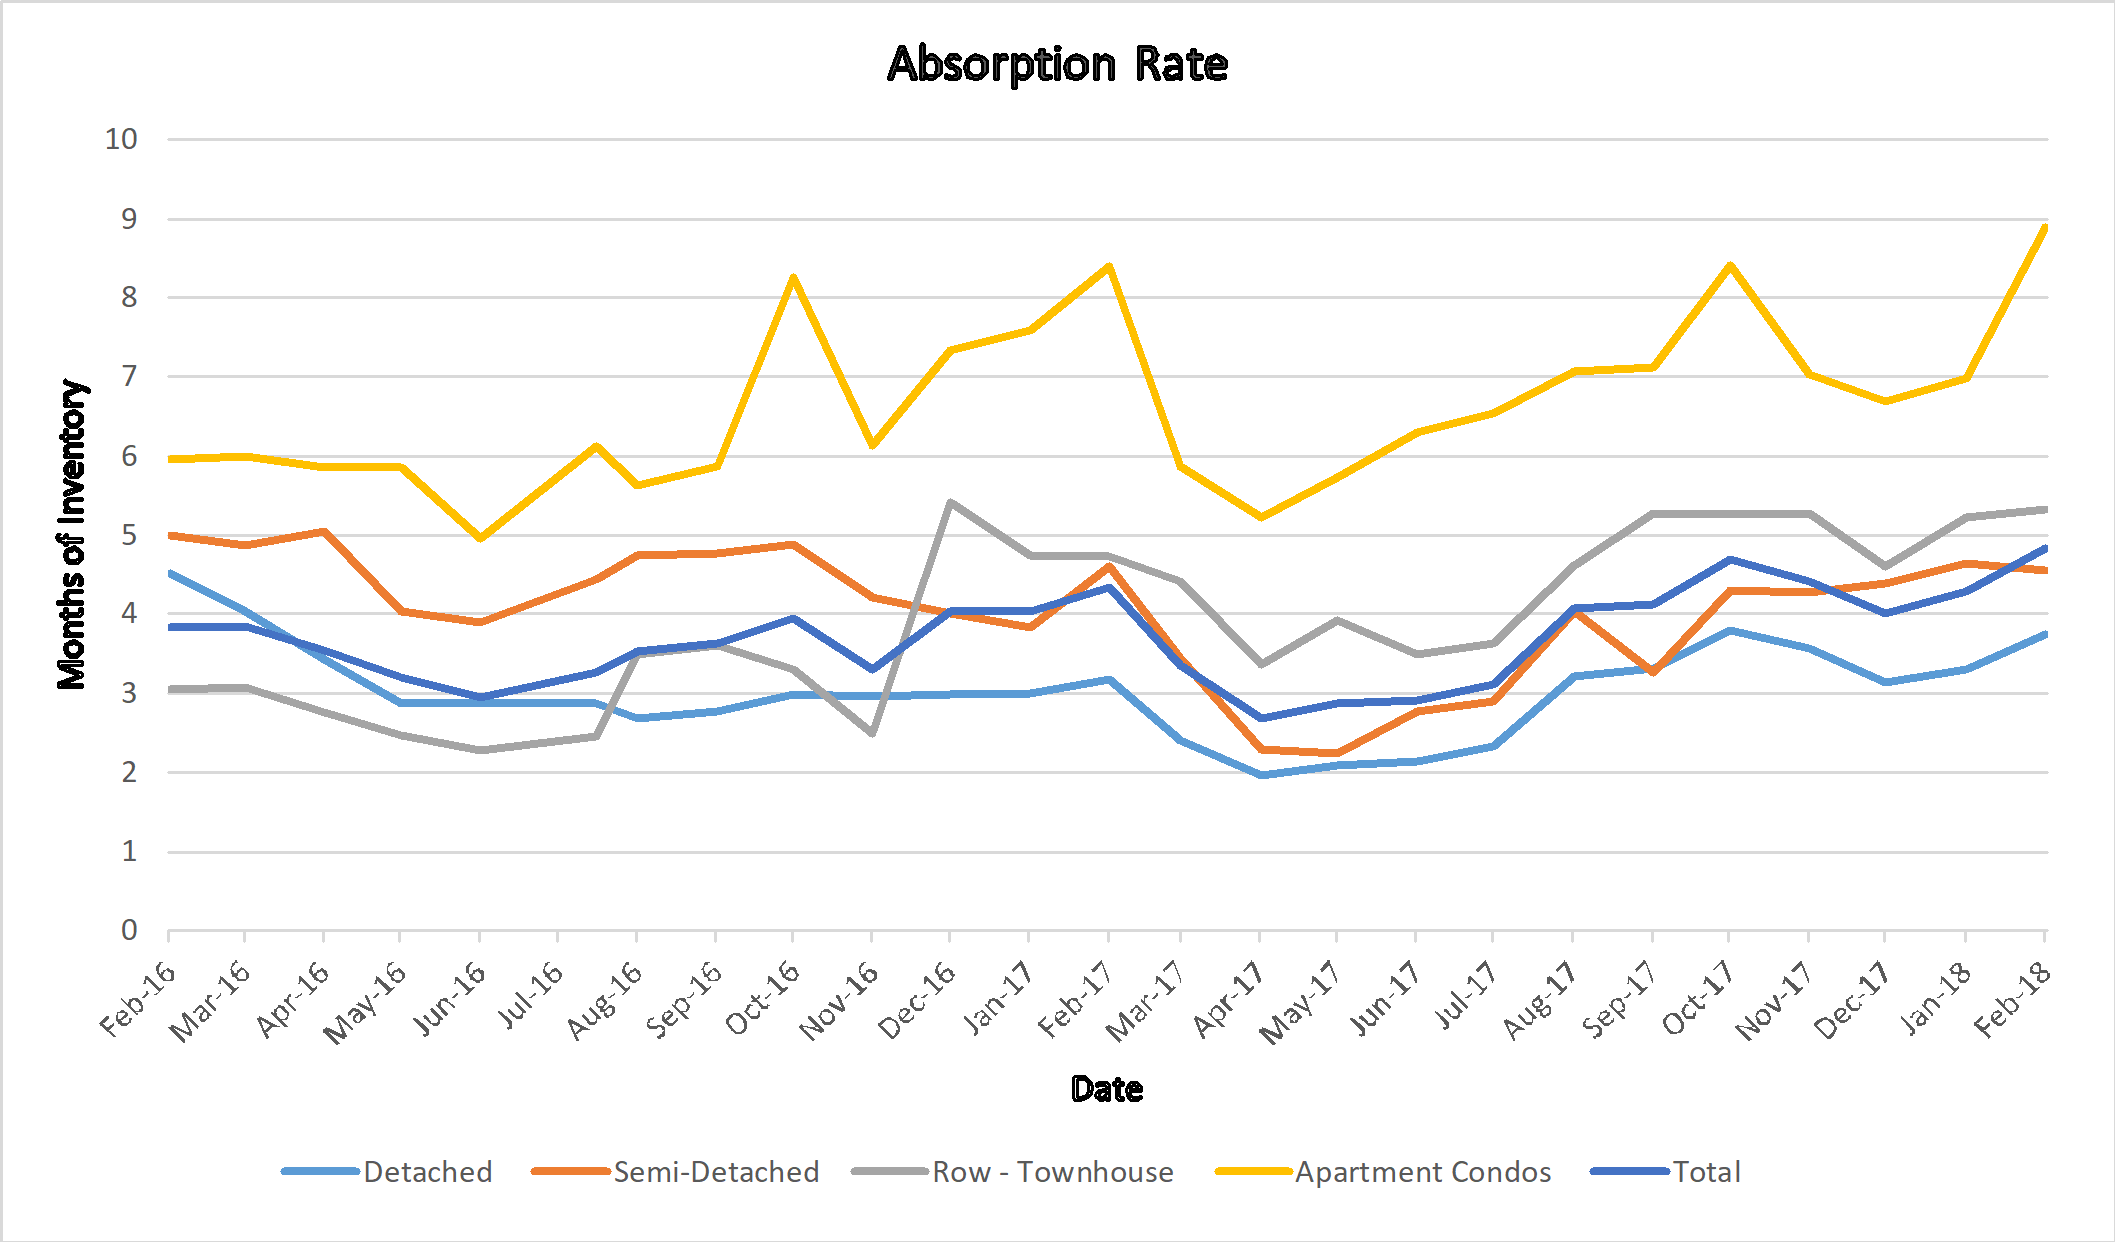
Absorption Rate Graph

What is really happening in the Calgary Real Estate Market?

Stay ahead of everyone else by following our Monthly Market Snapshot of the Calgary Real Estate Market This shows what’s really happening! The market is driven by supply and demand so here we show the inventory (supply) and sales (demand) and most importantly the relationship between the two and how it affects the price of Calgary Real Estate.  A simple way to keep up to date with how the market is trending and to stay ahead of most! All numbers are taken from the Calgary Real Estate Boards Stats package for Realtors. I have also included some general comments which are simply my opinion.

Absorption Rate (Months of Inventory)   (the inventory divided by the number of sales in the last month). What does this mean you might ask?

Buyer’s Market >4.0 Drives prices down
Balanced Market Between 2.4 to 4.0 Prices typically remain stable
Seller’s Market <2.4 Drives prices up

Important Disclaimer:  ***Error***   For those who regularly follow my Market Snapshot you may notice the numbers from last month do not jive with the numbers from this month.  It appears to me that this is a correction reversing last month’s numbers from the Real Estate Board.

The chart below shows the change in Sales Price numbers for June and July, so you can see it’s a numbers correction and not what’s really happening.  Hopefully this is the last error!

These numbers also reflect what I am seeing in the Market with infills rising and townhouses declining in price.


June Prices July Prices Net Change 2 Months
Semi-Detached +39,000 (11,300) +27,700
Row – Townhouses (14,300) +12,700 (1,600)

_______________________________________________________________________________

August Market Snapshot Report 

*** Absorption Rate

The Absorption rate for July saw all categories increase.   This is somewhat normal for this time of year as the majority of summer vacations are taken between July 15th to Aug 15th.  Our scorching weather may have played a factor in this as well.


June 2017 July  2017  Change
Detached 2.33 3.21 0.88
Semi Detached 2.90 4.05 1.15
Attached – Row 3.63 4.63 1.01
Apartment 6.55 7.07 0.52
Total City 3.11 4.08 0.97


Calgary Listing Inventory

In July we saw an increase in all categories except apartment condos.  I’m speculating the only reason we saw a decline in apartment condos is that many of the listings that are not selling are starting to expire.

Inventory June 2017 July  2017  Change
Detached 3224 3268 44
Semi Detached 560 596 36
Attached – Row 1001 1001 0
Apartment 1874 1810 -64
Total City 6659 6675 16


Calgary Sales:

As you can see sales declined in all categories in July.  Once again I believe this change to be mostly seasonal and also partially due to the hot weather.  This is the first month in a while where we have seen such large decreases.

Calgary Sales  June 2017 July  2017  Change % Change
Detached 1385 1018 -367 -26.50%
Semi Detached 193 147 -46 -23.83%
Attached – Row 276 216 -60 -21.74%
Apartment 286 256 -30 -10.49%
Total City 2140 1637 -503 -23.50%


Calgary Real Estate Sales Prices:

For July we saw small increases in price with the exception of the data errors mentioned above.

Moving forward I expect that detached and semi-detached will remain flat, townhouses may decrease a little more and apartment condos will continue to decrease.

  Sales Prices June 2017 Benchmark Price   July  2017  Benchmark Price Change
Detached 509,400 512,100 2,700
Semi Detached 432,100 420,800 -11,300
Attached – Row 294,000 306,700 12,700
Apartment 265,800 266,200 400
Total City 441,500 443,600 2,100


Sales Prices “Year to Date”  


Sales Prices Jan 1, 2017    Benchmark Price  June 2017  Benchmark Price Change

$

% Change
Detached 498,700 512,100 13,400 2.69%
Semi Detached 406,800 420,800 14,000 3.44%
Attached – Row 302,600 306,700 4,100 1.35%
Apartment 265,000 266,200 1,200 0.45%
Total City 433,400 443,600 10,200 2.35%


**Please note that these numbers include only Calgary homes and do change on a community basis and more so for towns.  This report does not include rural properties.  If you would like to find stats on your community just let me know.  If you have any questions about this summary or Real Estate questions please feel free to contact us.

TSW Real Estate Group

Gord Piper & Brent Wilcox


For Sale 132 Harvest Hills Drive

Thursday, July 27th, 2017

New Listing today.  You don’t often find a bi-level this size, located on a large lot with RV Parking and so well looked after.

MLS:  C4130523

Priced to sell @ $465,000

Request a private viewing here

Beautiful family home on a large lot with RV Parking in the great community of Harvest Hills.  Home has been meticulously maintained and features vaulted ceilings along with many updates over the years.  Not very often do you see a 1361 sq. ft. Bi-level providing over 2450 sq. ft. of developed living space.  Living room features laminate flooring, wood fireplace and a bay window. Dining room is perfect for entertaining a large group.  Kitchen with dining nook is spacious and features a bay window and an island.  Master is spacious and includes a 4 piece ensuite with jetted tub.  Complete the upper level with 2 additional bedrooms and the main bath.  Downstairs offers newer paint and flooring in the spacious Recreation room. Also features a bedroom, hobby room, a 4 piece bath and a workshop.  Oh, you will love the separate Laundry room.  Fantastic backyard with deck, and gate to park your RV and room to easily add a dog run.  Community offers schools and tons of shopping just minutes away.

Going “Green” in Your Garden or Flower Bed

Friday, July 21st, 2017

There has been a lot of emphasis lately on the importance of “going green”.  That simply means being environmentally-responsible.  You likely already recycle, use energy-efficient lights, and turn down your thermostat when no one is home. Yet, most of us don’t think about the garden or flower bed when we “think green”.  We should.  Here are a few practical things you can do to tend to outdoor plants — without negatively impacting the environment.

*Pull weeds instead of using a weed killer.

* Avoid strong pesticides. (Products that target only one or two types of insects tend to be less harsh.) There are numerous environmental options available in all stores.

• Don’t use flower bed ornaments (i.e. gnomes) that might bleed colour dye into the soil. (Ask your garden centre before you buy.)

• Be careful not to leave hand spades, trowels, and other garden tools lying around, especially over winter. They can rust, which contaminates the soil.

These tips may seem minor, but if you want to be environmentally conscious, every little bit helps!

No Homes for Sale in the Area You Like?

Tuesday, July 11th, 2017

Here’s What to Do…

Imagine there’s a neighborhood you’d love to live in someday, but, every time you drive through, you rarely, if ever, see a For Sale sign.  It’s as if homes get gobbled up by buyers the moment they get listed.  It’s true, properties do tend to sell quickly in desirable, in-demand neighborhoods. Does that mean you’re destined to either hope for a lucky break or miss out on ever living there?  Fortunately, no.  There are practical things you can do to increase your chances of getting into that neighborhood.  Your first step is to find out the kind of new home you can afford. You want to get your financial ducks in a row so when a listing does come up in the area, you’re able to respond quickly.  Find out the average price range of homes in the neighborhood.  Then, if necessary, talk to your lender or mortgage broker.  The second step is to get your current property ready for sale.  You don’t necessary need to list it now, but you want to be in a position to do so quickly, if necessary.  You may need to clean up and declutter, get repairs done, and spruce up your home in other ways.  The third step is to talk to me. You see, listings in popular neighborhoods often move fast. By the time you see them advertised on the internet, they may be gone.  I can closely monitor listings in that area for you, so the moment one comes up that meets your criteria, you can be alerted. I also have access to many listing before they even hit the market.  This greatly increases your chances of getting that home. So if there is a dream neighborhood you’d love to get into, give me a call.

July 1, 2017 Market Snapshot

Wednesday, July 5th, 2017

What is really happening in the Calgary Real Estate Market?

Absorption Rate for 2017


Stay ahead of everyone else by following our Monthly Market Snapshot of the Calgary Real Estate Market This shows what’s really happening! The market is driven by supply and demand so here we show the inventory (supply) and sales (demand) and most importantly the relationship between the two and how it affects the price of Calgary Real Estate.  A simple way to keep up to date with how the market is trending and to stay ahead of most! All numbers are taken from the Calgary Real Estate Boards Stats package for Realtors. I have also included some general comments which are simply my opinion.

Absorption Rate (Months of Inventory)   (the inventory divided by the number of sales in the last month). What does this mean you might ask?

Buyer’s Market >4.0 Drives prices down
Balanced Market Between 2.4 to 4.0 Prices typically remain stable
Seller’s Market <2.4 Drives prices up

___________________________________________________________________________________________________________________________________

Important Disclaimer:   For those who regularly follow my Market Snapshot you may notice the numbers from last month do not jive with the numbers from this month.  It appears to me that the Real Estate Board made some changes to what fits into each category and then made the stats changes retroactive.  This shows up as a large increase in Semi-Detached homes ($39,000) a large decrease in Row homes (14,300) and a decrease in Apartment condos of $5,400.  In my report I am using their new, year to date numbers so you can still see the change from May to June. _____________________________________________________________________________________________________________________________________

*** Absorption Rate

The Absorption rate for June saw all categories increase very slightly.  The highest increase is in the apartment condo market where it increased by .26 which happens to be where we need it the least.

  May  2017 June 2017   Change
Detached 2.13 2.33 0.19
Semi Detached 2.78 2.90 0.12
Attached – Row 3.49 3.63 0.14
Apartment 6.29 6.55 0.26
Total City 2.92 3.11 0.19


Calgary Listing Inventory

In June we saw a fairly large increase in our inventory level. Detached homes were the highest showing an increase of 283 listings.

Inventory May  2017 June 2017  Change
Detached 2941 3224 283
Semi Detached 518 560 42
Attached – Row 949 1001 52
Apartment 1780 1874 94
Total City 6188 6659 471


Calgary Sales:

Can you say consistent?  Sales in June were almost identical in numbers to May. As you can see sales remain strong in the detached sector and weak in the apartment condo sector.

Calgary Sales  May  2017 June 2017  Change % Change
Detached 1378 1385 7 0.51%
Semi Detached 186 193 7 3.76%
Attached – Row 272 276 4 1.47%
Apartment 283 286 3 1.06%
Total City 2119 2140 21 0.99%


Calgary Real Estate Sales Prices:

For June all sectors showed price increased with the exception of Apartment Condos which showed a slight decrease.  I believe that you will continue to see this trend for apartment condos for quite some time as there are several new buildings coming to completion stage and it’s just going to increase our inventory.

  Sales Prices May  2017Benchmark Price          June 2017  Benchmark Price Change
Detached 506,700 509,400 2,700
Semi Detached 427,900 432,100 4,200
Attached – Row 292,400 294,000 1,600
Apartment 266,600 265,800 -800
Total City 439,300 441,500 2,200


Sales Prices “Year to Date”  


Sales Prices Jan 1, 2017    Benchmark Price  June 2017  Benchmark Price Change

$

% Change
Detached 498,700 509,400 10,700 2.15%
Semi Detached 406,800 432,100 25,300 6.22%
Attached – Row 302,600 294,000 -8,600 -2.84%
Apartment 265,000 265,800 800 0.30%
Total City 433,400 441,500 8,100 1.87%

 **Please note that these numbers include only Calgary homes and do change on a community basis and more so for towns.  This report does not include rural properties.  If you would like to find stats on your community just let me know.  If you have any questions about this summary or Real Estate questions please feel free to contact us.