Months of Inventory for the Calgary Real Estate Market
What is really happening in the Calgary Real Estate Market?
Stay ahead of everyone else by following our Monthly Market Snapshot of the Calgary Real Estate Market. This shows what’s really happening! The market is driven by supply and demand so here we show the inventory (supply) and sales (demand) and most importantly the relationship between the two and how it affects the price of Calgary Real Estate. A simple way to keep up to date with how the market is trending and to stay ahead of most! All numbers are taken from the Calgary Real Estate Boards Stats package for Realtors. I have also included some general comments which are simply my opinion.
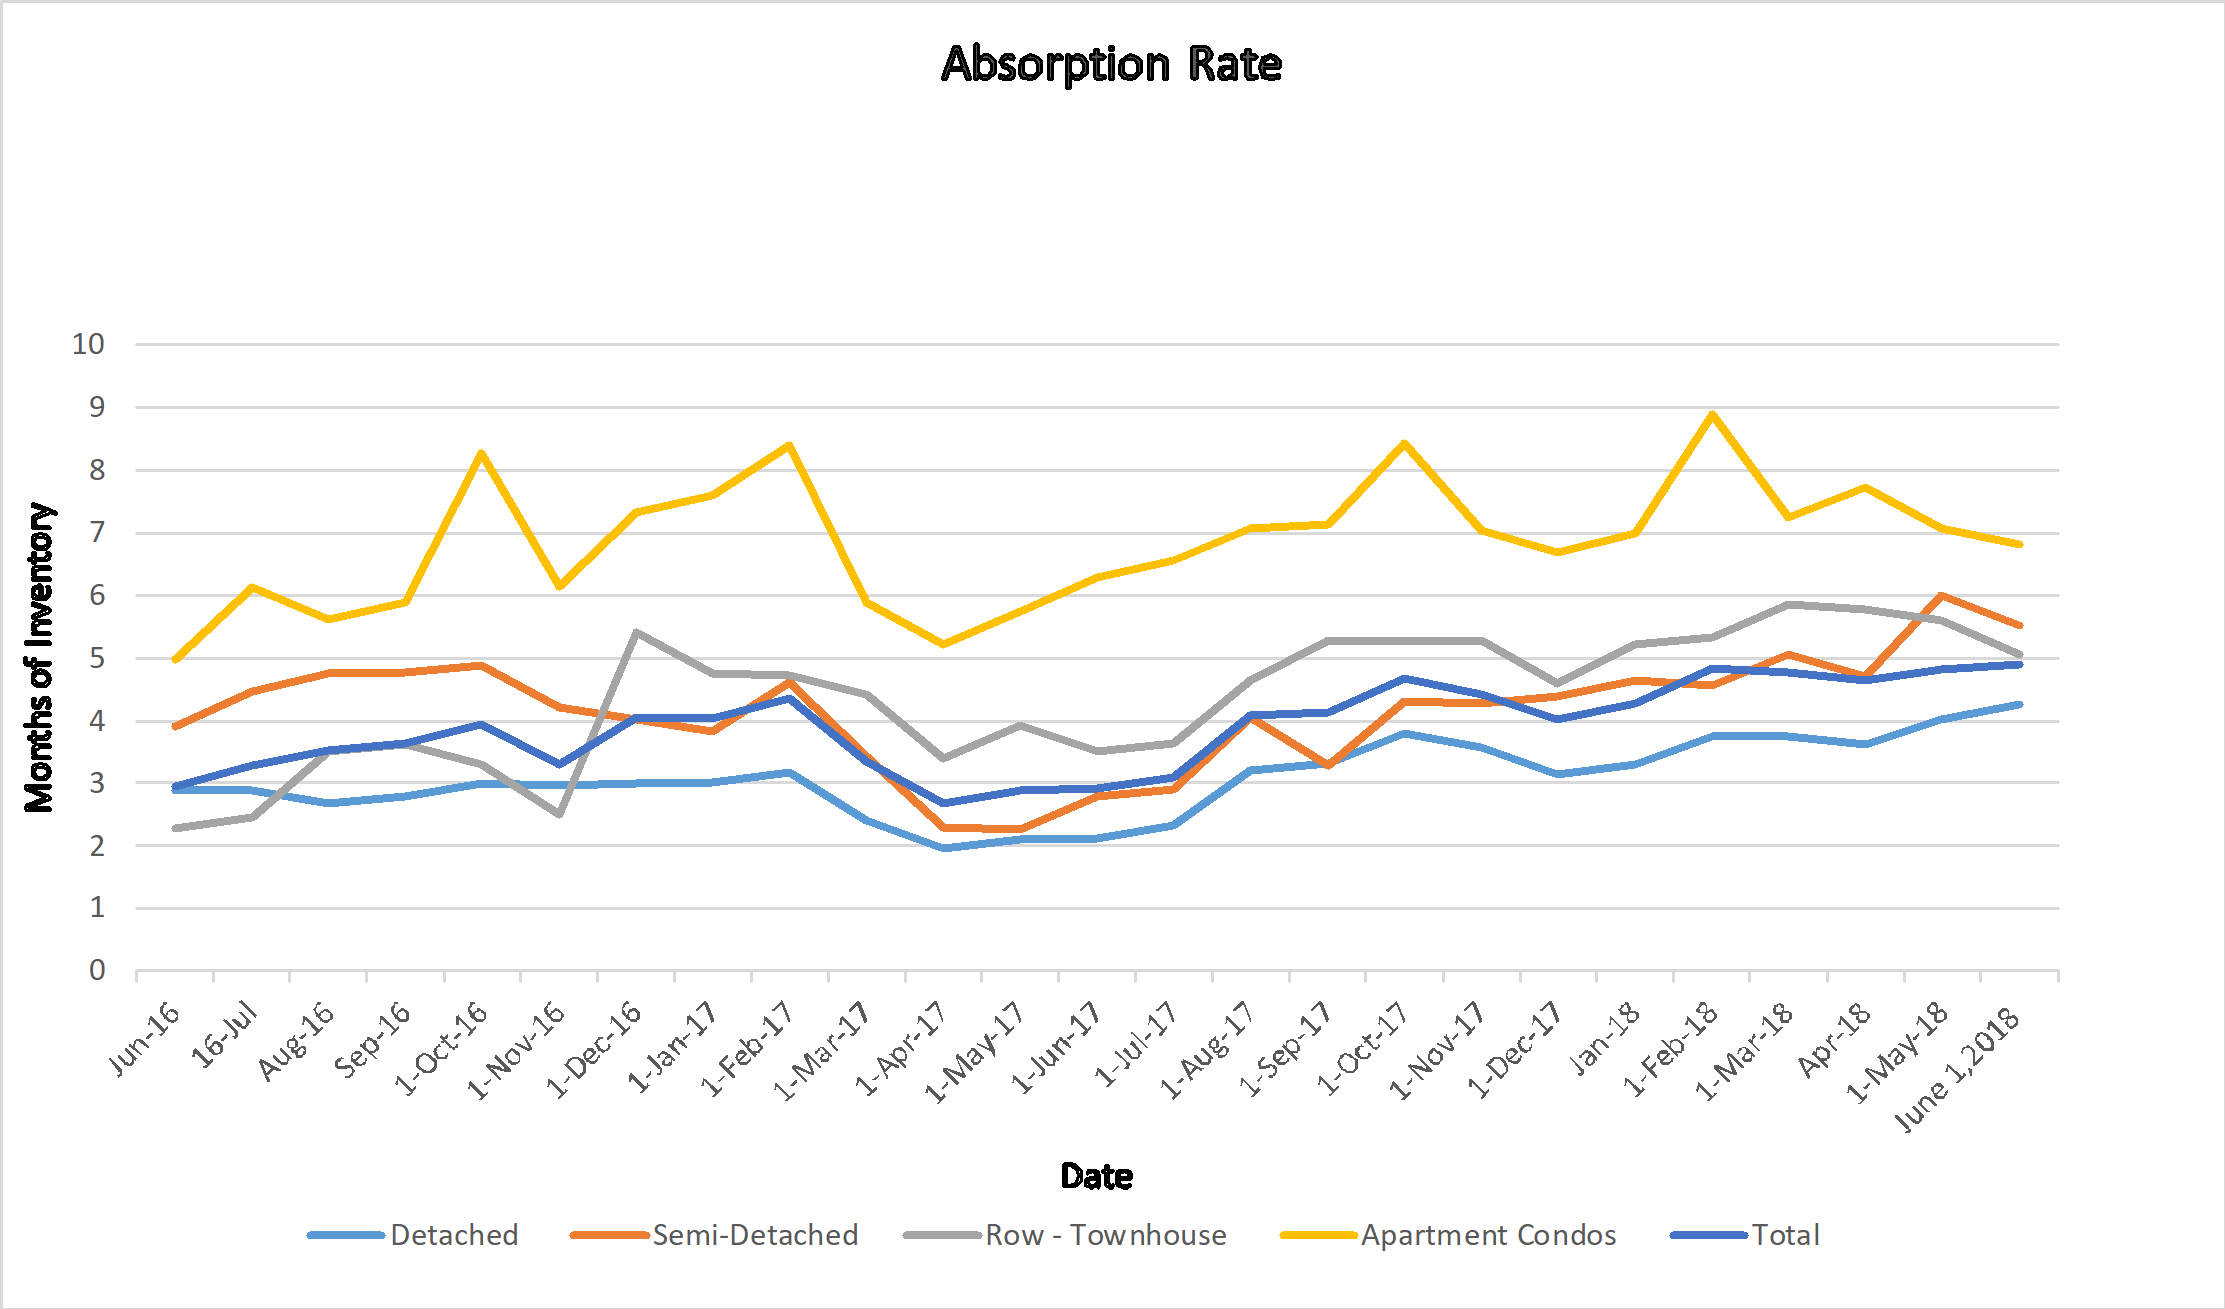
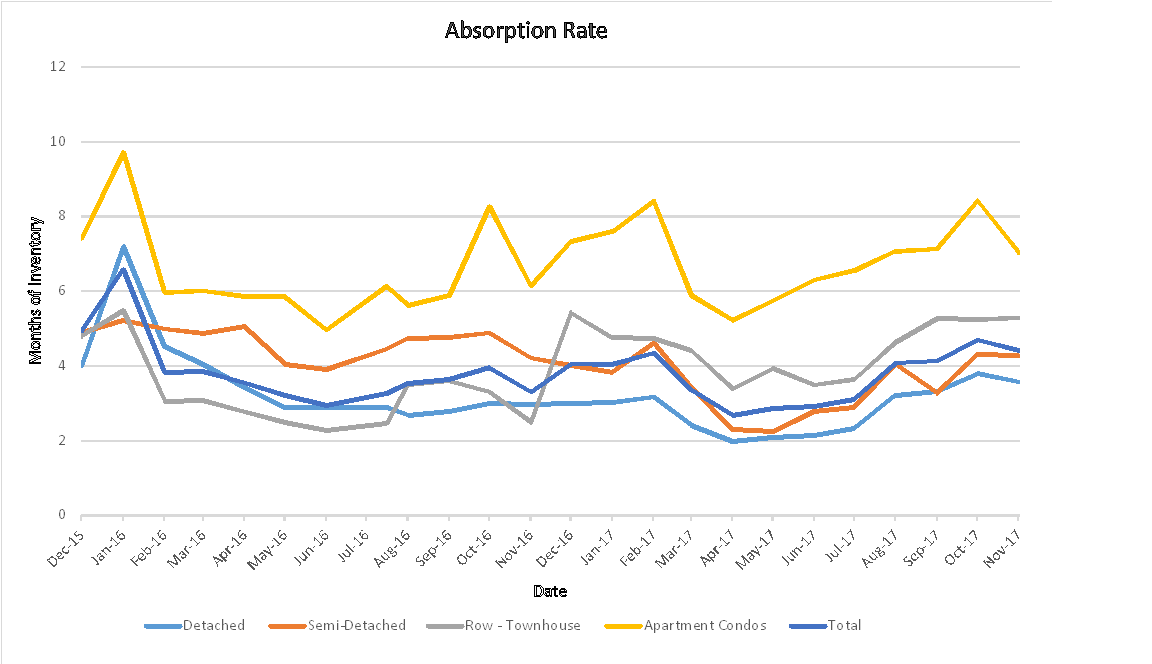
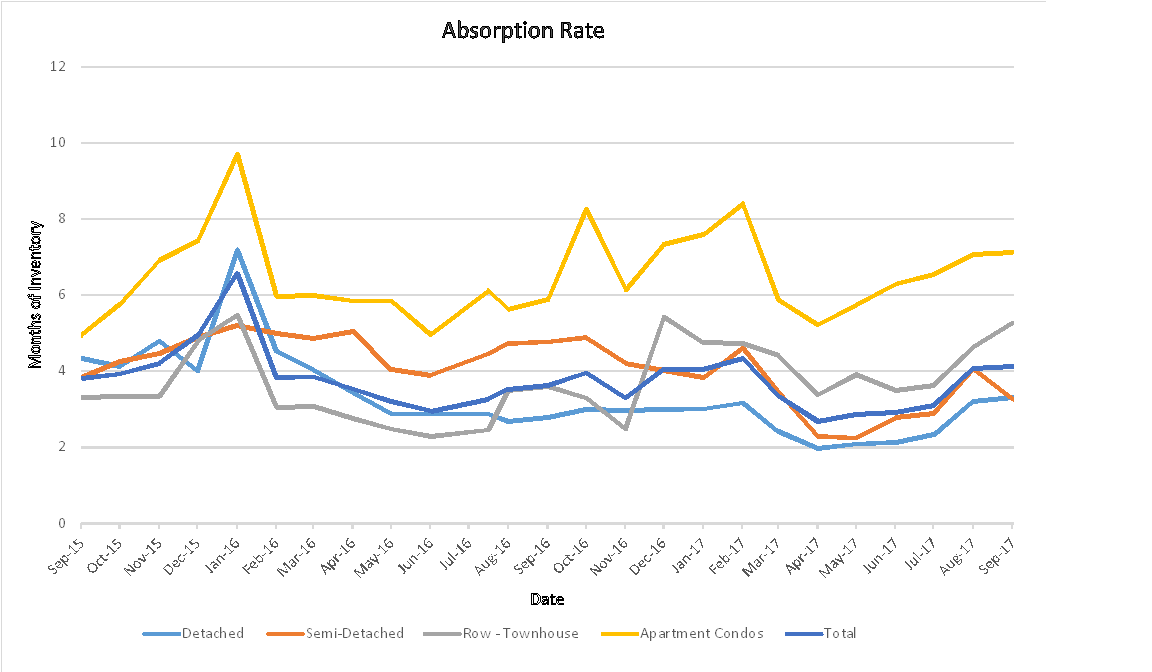
Months of Inventory/Absorption Rate – the inventory divided by the number of sales in the last month). What does this mean you might ask?
| Buyer’s Market | >4.0 | Drives prices down |
| Balanced Market | Between 2.4 to 4.0 | Prices typically remain stable |
| Seller’s Market | <2.4 | Drives prices up |
_________________________________________________________________________
Current Months of Inventory: If we did not list any more homes this is how many months it would take to deplete inventory. In September we saw every category increase quite substantially in the number of months of inventory putting the entire Calgary market into a buyer’s market position.
| End of | Aug 2018 | Sept 2018 | Change |
| Detached | 4.78 | 5.49 | 0.71 |
| Semi Detached | 6.45 | 7.09 | 0.64 |
| Attached – Row | 6.22 | 7.58 | 1.36 |
| Apartment | 6.86 | 7.68 | 0.82 |
| Total City | 5.45 | 6.25 | 0.80 |
Calgary Listing Inventory
In September, our inventory decreased in all sectors and overall, the highest decrease was in the Detached home sector followed by the apartment condo sector. This is normal at this time of year and we should expect this trend to continue for the rest of the year.
***One interesting note is that in the last 2 days of September the inventory decreased by almost 500 listings. I believe this is listings expiring and some of these will get re-listed as this is exactly what happened last month.
| Inventory | Aug 2018 | Sept 2018 | Change |
| Detached | 4433 | 4348 | -85 |
| Semi Detached | 909 | 872 | -37 |
| Attached – Row | 1113 | 1107 | -6 |
| Apartment | 1666 | 1620 | -46 |
| Total Calgary | 8121 | 7947 | -174 |
Calgary Sales:
Sales were down in all categories. This is normal for September as we will now tread down every month until the new year.
| Calgary Sales | Aug 2018 | Sept 2018 | Change | % Change |
| Detached | 927 | 792 | -135 | -14.56% |
| Semi Detached | 141 | 123 | -18 | -12.77% |
| Attached – Row | 179 | 146 | -33 | -18.44% |
| Apartment | 243 | 211 | -32 | -13.17% |
| Total City | 1490 | 1272 | -218 | -14.63% |
Sales Compared to last year: Thought this is a number that deserves a look as the trend is changing. This chart shows this year’s sales as a percentage of last years so yes, sales are down but they are down less than at the beginning of the year.
| Jan | Feb | Mar | Apr | May | June | July | Aug | Sept | Oct | Nov | Dec |
| 102% | 82% | 72% | 80% | 82% | 89% | 95% | 93% | 85.9 |
Calgary Real Estate Sales Prices:
September saw prices decrease in all sectors which is expected with the high number of months of inventory on the market. Unless something changes we can expect to see this trend for a few more months.
| Sales Prices | Aug 2018 Benchmark Price | Sept 2018 Benchmark Price | Change |
| Detached | 497,000 | 493,100 | -3,900 |
| Semi Detached | 411,300 | 407,400 | -3,900 |
| Attached – Row | 296,700 | 294,200 | -2,500 |
| Apartment | 258,100 | 257,200 | -900 |
| Total City | 432,000 | 428,700 | -3,300 |
Sales Prices “Year to Date”
Same as monthly number
| Sales Prices | Jan 1, 2018 Benchmark Price | Sept 2018 Benchmark Price | Change
$ |
% Change |
| Detached | 499,600 | 493,100 | -6,500 | -1.30% |
| Semi Detached | 416,600 | 407,400 | -9,200 | -2.21% |
| Attached – Row | 299,500 | 294,200 | -5,300 | -1.77% |
| Apartment | 257,700 | 257,200 | -500 | -0.19% |
| Total City | 433,200 | 428,700 | -4,500 | -1.04% |
**Please note that these numbers include only Calgary homes and do change on a community basis and more so for towns. This report does not include rural properties. If you would like to find stats on your community just let me know. If you have any questions about this summary or about Real Estate in general, please feel free to contact us.