Archive for the ‘Real Estate Board’s Statistics’ Category

Calgary Real Estate Market Snapshot Jan 1, 2018

Tuesday, January 2nd, 2018

What is really happening in the Calgary Real Estate Market?

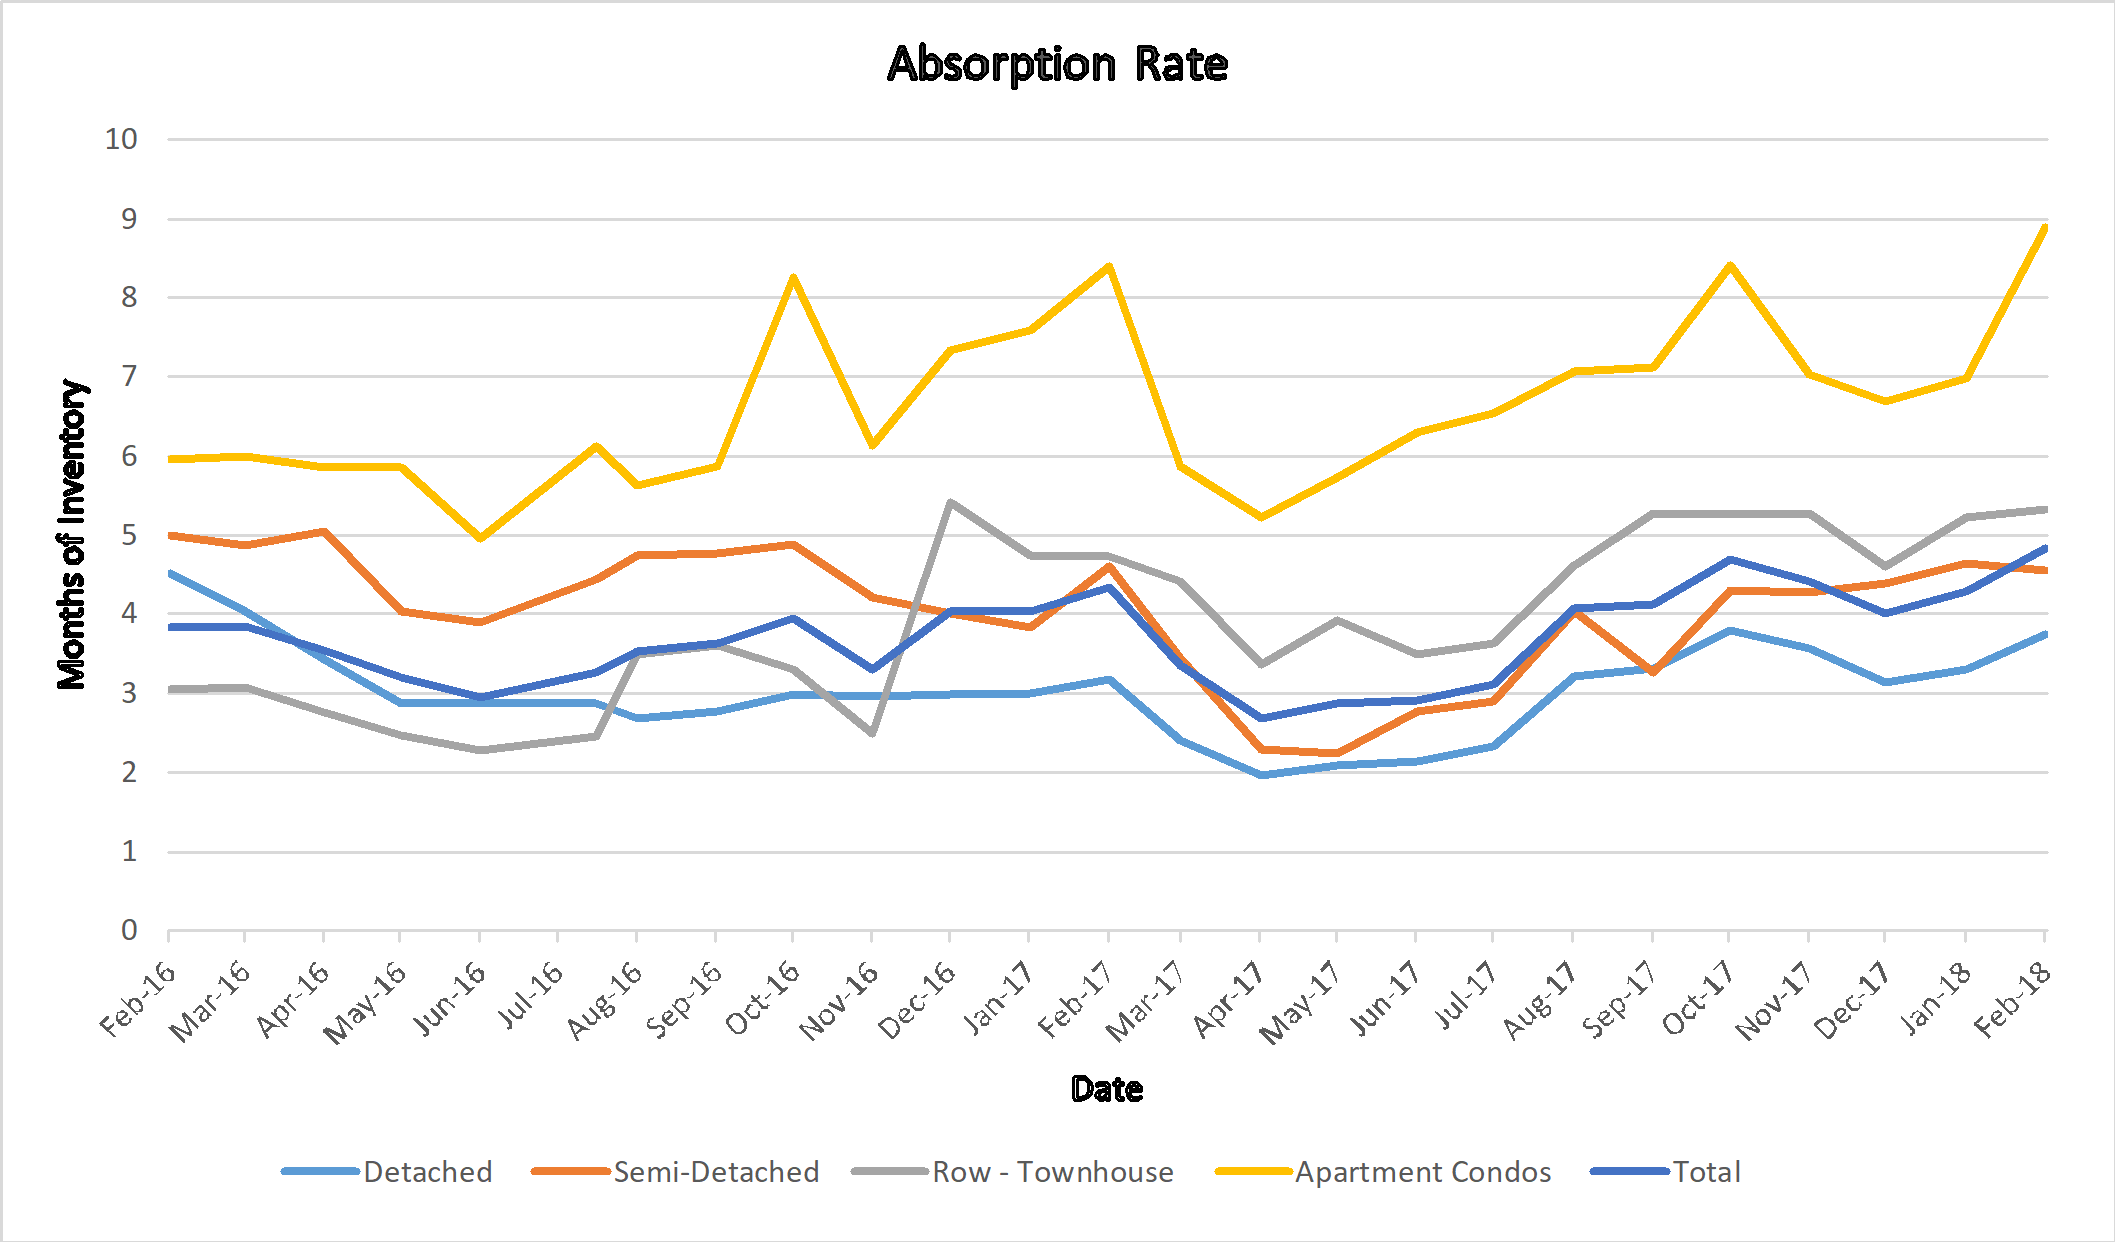
Absorption Rate

Stay ahead of everyone else by following our Monthly Market Snapshot of the Calgary Real Estate Market This shows what’s really happening! The market is driven by supply and demand so here we show the inventory (supply) and sales (demand) and most importantly the relationship between the two and how it affects the price of Calgary Real Estate.  A simple way to keep up to date with how the market is trending and to stay ahead of most! All numbers are taken from the Calgary Real Estate Boards Stats package for Realtors. I have also included some general comments which are simply my opinion.

Absorption Rate (Months of Inventory)   (the inventory divided by the number of sales in the last month). What does this mean you might ask?

Buyer’s Market >4.0 Drives prices down
Balanced Market Between 2.4 to 4.0 Prices typically remain stable
Seller’s Market <2.4 Drives prices up


Current Absorption Rate

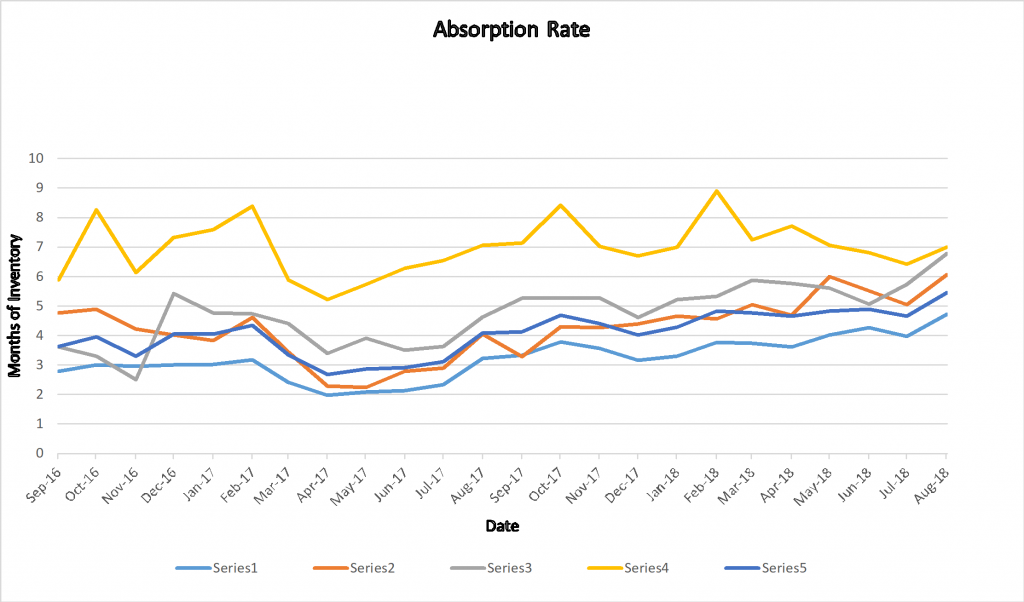
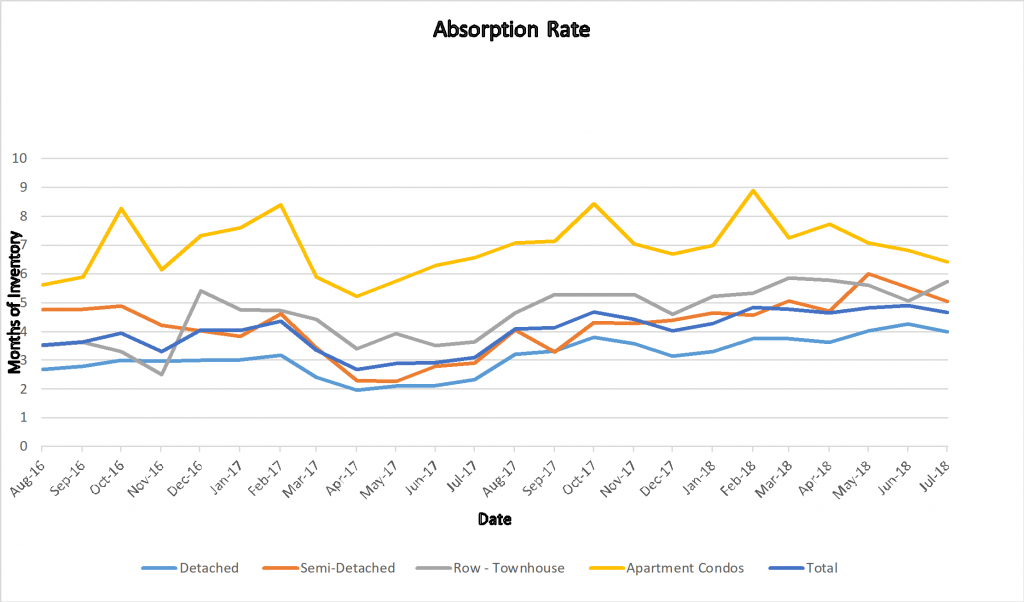
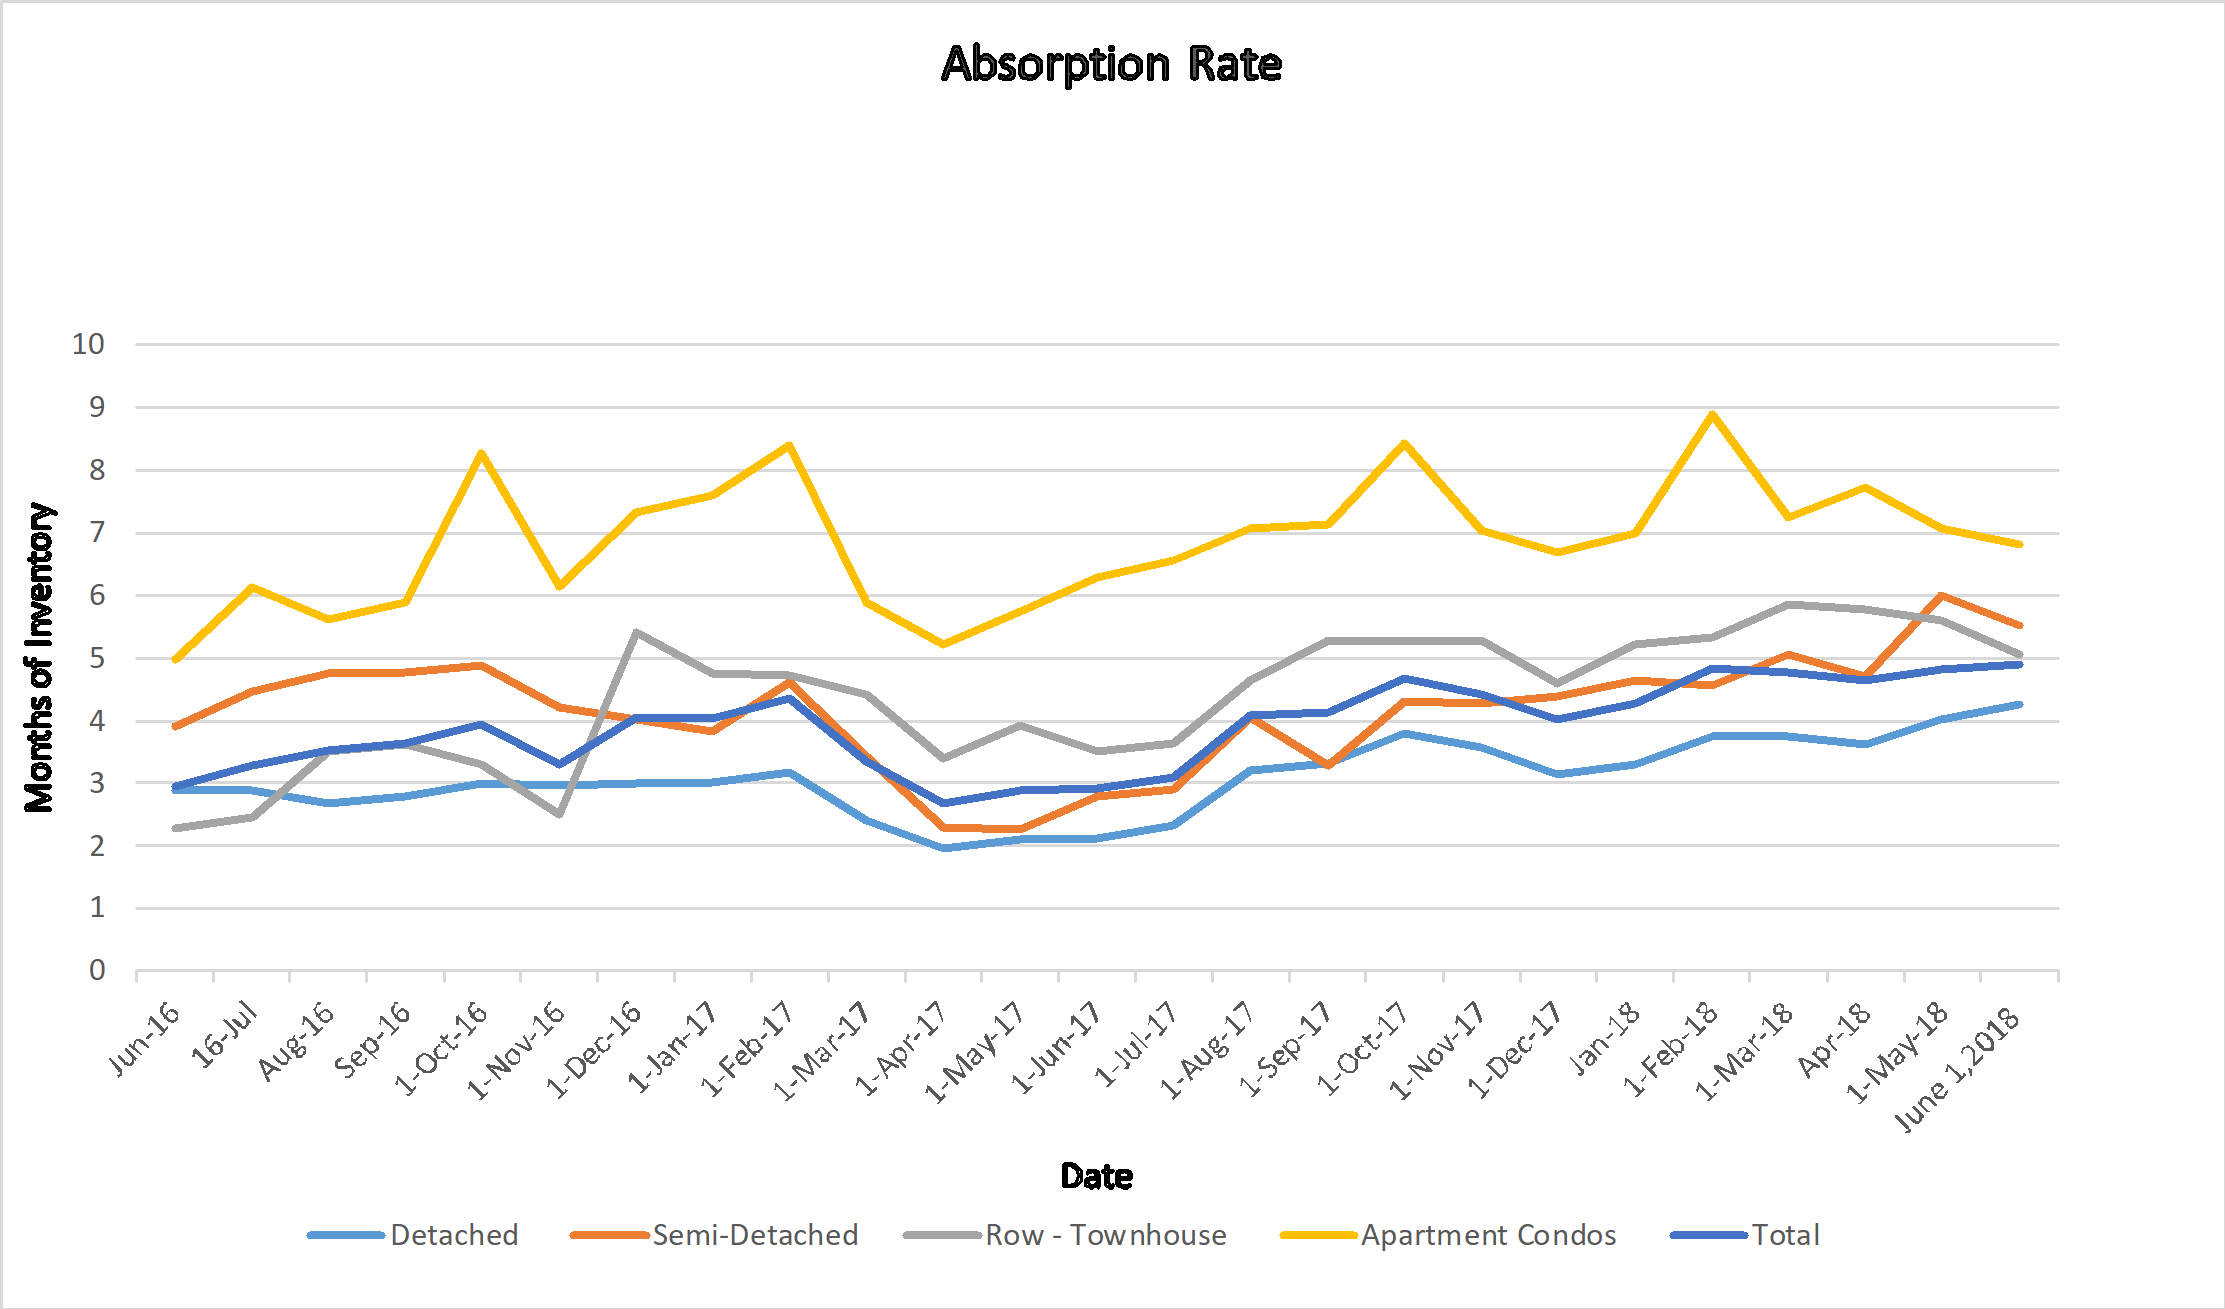
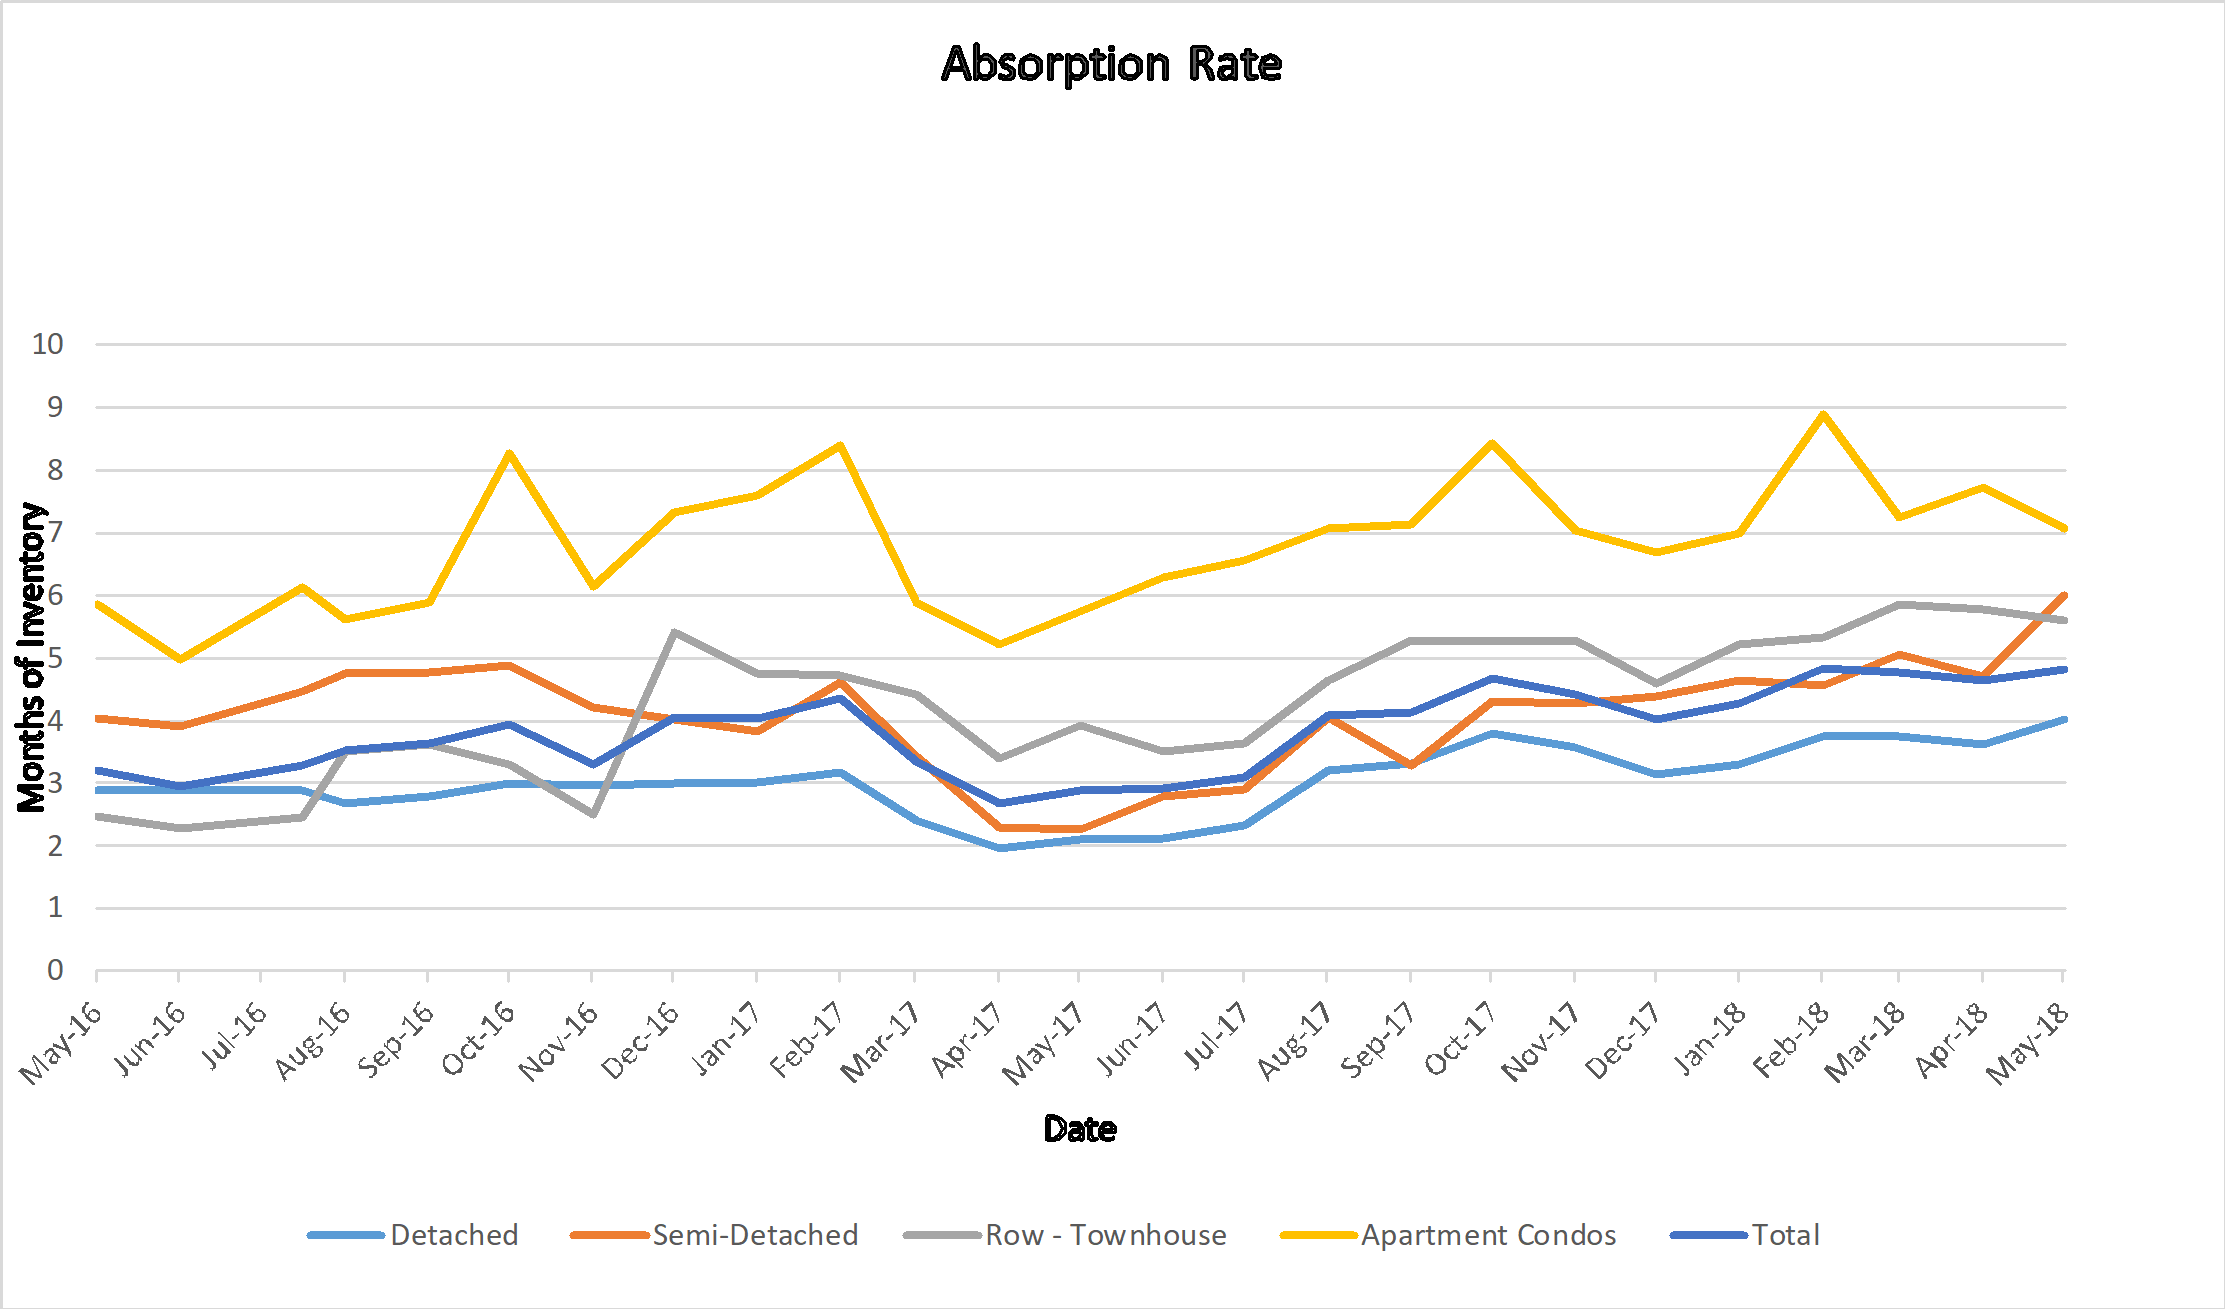
The Absorption rate for November increased in all categories for December.  The number of listings dropped but the number of sales dropped even more.  My concern is that a lot of inventory came off for the holiday season and we may see a ton of listings hit the market in January.  

Nov  2017  Dec  2017  Change
Detached 3.15 3.30 0.15
Semi Detached 4.40 4.64 0.24
Attached – Row 4.60 5.22 0.62
Apartment 6.69 6.99 0.31
Total City 4.01 4.28 0.26


Calgary Listing Inventory

In December all categories saw a decrease in the number of listings.  This is normal for this time of year where people will let their listing expire and then put it back on in the new year.

Inventory Nov  2017  Dec  2017  Change
Detached 2758 2033 -725
Semi Detached 555 441 -114
Attached – Row 861 658 -203
Apartment 1491 1182 -309
Total City 5665 4314 -1351


Calgary Sales:

Sales for December decreased in all categories.   Of interest our sales in all categories exceeded the sales for Dec 2016.

Total sales Dec 2016:  929

Total sales Dec 2017: 1006

Increase of 8.3%


Calgary Sales  Nov  2017  Dec  2017  Change % Change
Detached 875 616 -259 -29.60%
Semi Detached 126 95 -31 -24.60%
Attached – Row 187 126 -61 -32.62%
Apartment 223 169 -54 -24.22%
Total City 1411 1008 -403 -28.56%


Calgary Real Estate Sales Prices:

Prices in December dropped a little in all categories.   The highest decreases were in detached and attached-row houses.

  Sales Prices Nov  2017  Benchmark Price   Dec  2017  Benchmark Price Change
Detached 504,000 499,600 -4,400
Semi Detached 417,800 416,600 -1,200
Attached – Row 303,100 299,500 -3,600
Apartment 258,300 257,700 -600
Total City 436,700 433,200 -3,500


Sales Prices “Year to Date”  

Well, here is the summary for the year 2017.   Small gains in Detached and Semi-Detached homes and a small reduction in Attached Row with a larger decrease in Apartment Condos.  If you have been watching my report for the year the absorption rate for apartment condos has been very high all year.

Sales Prices Jan 1, 2017    Benchmark Price  Dec  2017  Benchmark Price Change

$

% Change
Detached 498,900 499,600 700 0.14%
Semi Detached 406,200 416,600 10,400 2.56%
Attached – Row 303,100 299,500 -3,600 -1.19%
Apartment 266,500 257,700 -8,800 -3.30%
Total City 434,100 433,200 -900 -0.21%

  **Please note that these numbers include only Calgary homes and do change on a community basis and more so for towns.  This report does not include rural properties.  If you would like to find stats on your community just let me know.  If you have any questions about this summary or Real Estate questions please feel free to contact us.

My Prediction for 2018

The big news is that as of yesterday the mortgage rules changed and people will be able to qualify for less mortgage due to the new “Stress Test”

When the government made the same change for 5% Down mortgages we saw little impact in the market so I am predicting little impact on the market due to this.  If anything we will see less sales activity in Detached homes and some buyers will move into attached homes or Townhomes.  Some who could previously qualify for a townhouse may now move into the Apartment Condo sector.  For Calgary if this prediction comes true it could be good as it may balance out the market categories.  Overall I believe that the Calgary Market will continue to pick up momentum through 2018.

Happy New Year, we hope you have an awesome 2018.

Calgary Real Estate Market Snapshot – Dec. 1, 2017

Saturday, December 2nd, 2017

Absorption Rate Dec. 2017

What is really happening in the Calgary Real Estate Market?

Stay ahead of everyone else by following our Monthly Market Snapshot of the Calgary Real Estate Market This shows what’s really happening! The market is driven by supply and demand so here we show the inventory (supply) and sales (demand) and most importantly the relationship between the two and how it affects the price of Calgary Real Estate.  A simple way to keep up to date with how the market is trending and to stay ahead of most! All numbers are taken from the Calgary Real Estate Boards Stats package for Realtors. I have also included some general comments which are simply my opinion.

What is Absorption Rate (Months of Inventory)   (the inventory divided by the number of sales in the last month). What does this mean you might ask?

Buyer’s Market >4.0 Drives prices down
Balanced Market Between 2.4 to 4.0 Prices typically remain stable
Seller’s Market <2.4 Drives prices up

Current Absorption Rate

The Absorption rate for November decreased in all categories except Semi – Detached which rose a little.  In my opinion this is mainly due to listings expiring and not due to sales.  Either way this is good as it is keeping the market fairly balanced. 

Oct  2017  Nov  2017  Change
Detached 3.57 3.15 -0.42
Semi Detached 4.27 4.40 0.13
Attached – Row 5.28 4.60 -0.68
Apartment 7.03 6.69 -0.35
Total City 4.41 4.01 -0.39


Calgary Listing Inventory

In November all categories saw a decrease in the number of listings.  This is normal for this time of year where people will let their listing expire and then put it back on in the new year.

Inventory Oct  2017  Nov  2017  Change
Detached 3246 2758 -488
Semi Detached 611 555 -56
Attached – Row 967 861 -106
Apartment 1639 1491 -148
Total City 6463 5665 -798


Calgary Sales:

Sales for November saw a small decrease overall.  Attached Row homes are the only category to show an increase.  Semi-Detached saw a rather large decrease and it’s my belief that this is simply listings expiring that will be relisted in January.

Of interest Calgary year to date sales are 15% above last year’s sales.

Calgary Sales  Oct  2017  Nov  2017  Change % Change
Detached 908 875 -33 -3.63%
Semi Detached 143 126 -17 -11.89%
Attached – Row 183 187 4 2.19%
Apartment 233 223 -10 -4.29%
Total City 1467 1411 -56 -3.82%


Calgary Real Estate Sales Prices:

Prices for November showed a slight decrease in Calgary.  This in my opinion is mainly due to consumer confidence or lack of it.

  Sales Prices Oct  2017  Benchmark Price   Nov  2017  Benchmark Price Change
Detached 506,200 504,000 -2,200
Semi Detached 419,000 417,800 -1,200
Attached – Row 305,000 303,100 -1,900
Apartment 261,600 258,300 -3,300
Total City 438,900 436,700 -2,200


Sales Prices “Year to Date”  

Sales Prices Jan 1, 2017    Benchmark Price  Nov  2017  Benchmark Price Change

$

% Change
Detached 498,700 504,000 5,300 1.06%
Semi Detached 406,800 417,800 11,000 2.70%
Attached – Row 302,600 303,100 500 0.17%
Apartment 265,000 258,300 -6,700 -2.53%
Total City 433,400 436,700 3,300 0.76%

 **Please note that these numbers include only Calgary homes and do change on a community basis and more so for towns.  This report does not include rural properties.  If you would like to find stats on your community just let me know.

Calgary Real Estate Market Snapshot – Nov. 1, 2017

Thursday, November 2nd, 2017

Aborsption Rate Trend – Supply Vs Demand 

What is really happening in the Calgary Real Estate Market?

Stay ahead of everyone else by following our Monthly Market Snapshot of the Calgary Real Estate Market This shows what’s really happening! The market is driven by supply and demand so here we show the inventory (supply) and sales (demand) and most importantly the relationship between the two and how it affects the price of Calgary Real Estate.  A simple way to keep up to date with how the market is trending and to stay ahead of most! All numbers are taken from the Calgary Real Estate Boards Stats package for Realtors. I have also included some general comments which are simply my opinion.

Absorption Rate’s Explained  (Months of Inventory)   (the inventory divided by the number of sales in the last month). What does this mean you might ask?

Buyer’s Market >4.0 Drives prices down
Balanced Market Between 2.4 to 4.0 Prices typically remain stable
Seller’s Market <2.4 Drives prices up


Current Absorption Rate

The Absorption rate for October stayed almost flat with the exception of Apartment Condos which decreased by 1.38 which is the first sizable decrease we have seen in this sector in a while.  It’s important to note that last month went up by 1.29 so part of this can be just timing of listing coming on and off the market.

  Sept  2017  Oct  2017  Change
Detached 3.79 3.57 -0.21
Semi Detached 4.31 4.27 -0.04
Attached – Row 5.25 5.28 0.03
Apartment 8.42 7.03 -1.38
Total City 4.69 4.41 -0.29


Calgary Listing Inventory

In October all categories stayed flat except for detached homes which saw an decrease of 233 listings and apartment condos which decreased by 129 listings.

Inventory Sept  2017  Oct  2017  Change
Detached 3479 3246 -233
Semi Detached 621 611 -10
Attached – Row 993 967 -26
Apartment 1768 1639 -129
Total City 6861 6463 -398


Calgary Sales:

Sales for October were almost identical to September. Last year sales from Sept to Oct increased by 168 so were a little behind last year.

Calgary Sales  Sept  2017  Oct  2017  Change % Change
Detached 919 908 -11 -1.20%
Semi Detached 144 143 -1 -0.69%
Attached – Row 189 183 -6 -3.17%
Apartment 210 233 23 10.95%
Total City 1462 1467 5 0.34%


 Calgary Real Estate Sales Prices:

I find these numbers interesting as again if in a balanced market prices should remain fairly stable.  In reality every sector showed a slight decrease.  One variable that these numbers do not show is consumer confidence and I think this may have something to do with prices holding.

  Sales Prices Sept  2017    Benchmark Price   Oct  2017  Benchmark Price Change
Detached 508,900 506,200 -2,700
Semi Detached 419,400 419,000 -400
Attached – Row 306,900 305,000 -1,900
Apartment 263,700 261,600 -2,100
Total City 441,500 438,900 -2,600


 Sales Prices “Year to Date”  

Our Year to date numbers are very in alignment with the absorption rate changes.

Sales Prices Jan 1, 2017    Benchmark Price  Oct  2017  Benchmark Price Change

$

% Change
Detached 498,700 506,200 7,500 1.50%
Semi Detached 406,800 419,000 12,200 3.00%
Attached – Row 302,600 305,000 2,400 0.79%
Apartment 265,000 261,600 -3,400 -1.28%
Total City 433,400 438,900 5,500 1.27%


Looking Forward – Again just Gord’s opinion.

Based on the absorption rate we should see stability in the Detached & Semi Detached sectors while we may seem more losses in the Row House & Apartment sectors

However

You may have heard by now that the Fed’s are changing mortgage qualifying rules as of Jan 1, 2018.  This can cause a wide range of changes.

  • In the short term it can push people to buy before the end of the year.
  • When they changed the qualifying process for insured mortgages we saw little change in sales numbers.
  • I heard from one mortgage broker that most banks are already doing this for many types of mortgages so again the impact may be smaller than what some expect
  • If there is an impact and people are able to qualify for less, then this may push some people from detached homes to attached homes and from row housing to the apartment condo sector which in Calgary could bring more balance to our market.
  • Really only time will tell the whole story


**Please note that these numbers include only Calgary homes and do change on a community basis and more so for towns.  This report does not include rural properties.  If you would like to find stats on your community just let us know.  If you have any questions about this summary or Real Estate questions please feel free to contact us.


Calgary Real Estate Market Snapshot – Oct 1, 2017

Monday, October 2nd, 2017

Calgary Absorption Rate

What is really happening in the Calgary Real Estate Market?

Stay ahead of everyone else by following our Monthly Market Snapshot of the Calgary Real Estate Market This shows what’s really happening! The market is driven by supply and demand so here we show the inventory (supply) and sales (demand) and most importantly the relationship between the two and how it affects the price of Calgary Real Estate.  A simple way to keep up to date with how the market is trending and to stay ahead of most! All numbers are taken from the Calgary Real Estate Boards Stats package for Realtors. I have also included some general comments which are simply my opinion.

Absorption Rate (Months of Inventory)   (the inventory divided by the number of sales in the last month). What does this mean you might ask?

Buyer’s Market >4.0 Drives prices down
Balanced Market Between 2.4 to 4.0 Prices typically remain stable
Seller’s Market <2.4 Drives prices up


Absorption Rate

The Absorption rate for September increased in all categories except attached-row homes where it dropped marginally.   The one to note is apartment condos which increased by 1.29 putting us at 8.42 months of inventory.  

  Aug  2017  Sept  2017  Change
Detached 3.32 3.79 0.46
Semi Detached 3.27 4.31 1.04
Attached – Row 5.27 5.25 -0.02
Apartment 7.13 8.42 1.29
Total City 4.13 4.69 0.56

 Calgary Listing Inventory

In September all categories stayed flat except for detached homes which saw an increase of 199 listings.

Inventory Aug  2017  Sept  2017  Change
Detached 3280 3479 199
Semi Detached 585 621 36
Attached – Row 991 993 2
Apartment 1769 1768 -1
Total City 6624 6861 237


Calgary Sales:

Sales for September saw a decrease in all categories except attached-row homes which increased by 1.  A decrease at this time of year is fairly normal and I would classify this as simply seasonal.

Of interest Calgary year to date sales are 7% above last year’s sales.

Calgary Sales  Aug  2017  Sept  2017  Change % Change
Detached 987 919 -68 -6.89%
Semi Detached 179 144 -35 -19.55%
Attached – Row 188 189 1 0.53%
Apartment 248 210 -38 -15.32%
Total City 1602 1462 -140 -8.74%


Calgary Real Estate Sales Prices:

Okay, I will eat my words here.  Last month I predicted that prices would remain fairly even except for attached – row houses and apartment condos which I said should drop.  As you can see below I was wrong however with the absorption rates I again will predict all categories will remain fairly flat with the exception of apartment condos where a decrease is likely.

  Sales Prices Aug   2017Benchmark Price   Sept  2017  Benchmark Price Change
Detached 510,900 508,900 -2,000
Semi Detached 419,600 419,400 -200
Attached – Row 307,000 306,900 -100
Apartment 263,300 263,700 400
Total City 442,300 441,500 -800


Sales Prices “Year to Date”  

Sales Prices Jan 1, 2017    Benchmark Price  Sept  2017  Benchmark Price Change

$

% Change
Detached 498,700 508,900 10,200 2.05%
Semi Detached 406,800 419,400 12,600 3.10%
Attached – Row 302,600 306,900 4,300 1.42%
Apartment 265,000 263,700 -1,300 -0.49%
Total City 433,400 441,500 8,100 1.87%

 **Please note that these numbers include only Calgary homes and do change on a community basis and more so for towns.  This report does not include rural properties.  If you would like to find stats on your community just let me know.  If you have any questions about this summary or Real Estate questions please feel free to contact us.


TSW Real Estate Group


Calgary Real Estate Market Snapshot

Sunday, September 3rd, 2017

What is Really Happening in the Calgary Real Estate Market?

Stay ahead of everyone else by following our Monthly Market Snapshot of the Calgary Real Estate Market This shows what’s really happening! The market is driven by supply and demand so here we show the inventory (supply) and sales (demand) and most importantly the relationship between the two and how it affects the price of Calgary Real Estate.  A simple way to keep up to date with how the market is trending and to stay ahead of most! All numbers are taken from the Calgary Real Estate Boards Stats package for Realtors. I have also included some general comments which are simply my opinion.

Absorption Rate (Months of Inventory)   (the inventory divided by the number of sales in the last month). What does this mean you might ask?

Buyer’s Market >4.0 Drives prices down
Balanced Market Between 2.4 to 4.0 Prices typically remain stable
Seller’s Market <2.4 Drives prices up


Current Absorption Rate

The Absorption rate for August showed a very slight increase for detached homes, and Apartment condos.   Attached (Row) houses showed a larger increase of .64 while Semi-detached (Duplexes) showed a substantial decrease of .79.    

  July 2017 Aug  2017  Change
Detached 3.21 3.32 0.11
Semi Detached 4.05 3.27 -0.79
Attached – Row 4.63 5.27 0.64
Apartment 7.07 7.13 0.06
Total City 4.08 4.13 0.06


Calgary Listing Inventory

In August we saw most categories stay almost the same. The one exception is Apartment Condos and they decreased by 41 listings.  I believe the reason for this is listings expiring and not a sales increase.

Inventory July 2017 Aug  2017  Change
Detached 3268 3280 12
Semi Detached 596 585 -11
Attached – Row 1001 991 -10
Apartment 1810 1769 -41
Total City 6675 6624 -51


Calgary Sales:

August sales remained very consistent to July’s numbers with all being within 35 either way.

Calgary Sales  July 2017 Aug  2017  Change % Change
Detached 1018 987 -31 -3.05%
Semi Detached 147 179 32 21.77%
Attached – Row 216 188 -28 -12.96%
Apartment 256 248 -8 -3.13%
Total City 1637 1602 -35 -2.14%


Calgary Real Estate Sales Prices:

Interestingly enough all categories except Row houses (townhouses) took a small drop this month.

The largest decrease was in apartment condos and my opinion is that due to the high absorption rate this will continue for some time.

  Sales Prices July 2017 Benchmark Price   Aug  2017  Benchmark Price Change
Detached 512,100 510,900 -1,200
Semi Detached 420,800 419,600 -1,200
Attached – Row 306,700 307,000 300
Apartment 266,200 263,300 -2,900
Total City 443,600 442,300 -1,300


Sales Prices “Year to Date”  

Sales Prices Jan 1, 2017    Benchmark Price  Aug  2017  Benchmark Price Change

$

% Change
Detached 498,700 510,900 12,200 2.45%
Semi Detached 406,800 419,600 12,800 3.15%
Attached – Row 302,600 307,000 4,400 1.45%
Apartment 265,000 263,300 -1,700 -0.64%
Total City 433,400 442,300 8,900 2.05%

 **Please note that these numbers include only Calgary homes and  change on a community basis and more so for towns.  This report does not include rural properties.  If you would like to find stats on your community just let me know.  If you have any questions about this summary or Real Estate questions please feel free to contact us.


August 1, 2017 Market Snapshot

Wednesday, August 2nd, 2017

Absorption Rate Graph

What is really happening in the Calgary Real Estate Market?

Stay ahead of everyone else by following our Monthly Market Snapshot of the Calgary Real Estate Market This shows what’s really happening! The market is driven by supply and demand so here we show the inventory (supply) and sales (demand) and most importantly the relationship between the two and how it affects the price of Calgary Real Estate.  A simple way to keep up to date with how the market is trending and to stay ahead of most! All numbers are taken from the Calgary Real Estate Boards Stats package for Realtors. I have also included some general comments which are simply my opinion.

Absorption Rate (Months of Inventory)   (the inventory divided by the number of sales in the last month). What does this mean you might ask?

Buyer’s Market >4.0 Drives prices down
Balanced Market Between 2.4 to 4.0 Prices typically remain stable
Seller’s Market <2.4 Drives prices up

Important Disclaimer:  ***Error***   For those who regularly follow my Market Snapshot you may notice the numbers from last month do not jive with the numbers from this month.  It appears to me that this is a correction reversing last month’s numbers from the Real Estate Board.

The chart below shows the change in Sales Price numbers for June and July, so you can see it’s a numbers correction and not what’s really happening.  Hopefully this is the last error!

These numbers also reflect what I am seeing in the Market with infills rising and townhouses declining in price.


June Prices July Prices Net Change 2 Months
Semi-Detached +39,000 (11,300) +27,700
Row – Townhouses (14,300) +12,700 (1,600)

_______________________________________________________________________________

August Market Snapshot Report 

*** Absorption Rate

The Absorption rate for July saw all categories increase.   This is somewhat normal for this time of year as the majority of summer vacations are taken between July 15th to Aug 15th.  Our scorching weather may have played a factor in this as well.


June 2017 July  2017  Change
Detached 2.33 3.21 0.88
Semi Detached 2.90 4.05 1.15
Attached – Row 3.63 4.63 1.01
Apartment 6.55 7.07 0.52
Total City 3.11 4.08 0.97


Calgary Listing Inventory

In July we saw an increase in all categories except apartment condos.  I’m speculating the only reason we saw a decline in apartment condos is that many of the listings that are not selling are starting to expire.

Inventory June 2017 July  2017  Change
Detached 3224 3268 44
Semi Detached 560 596 36
Attached – Row 1001 1001 0
Apartment 1874 1810 -64
Total City 6659 6675 16


Calgary Sales:

As you can see sales declined in all categories in July.  Once again I believe this change to be mostly seasonal and also partially due to the hot weather.  This is the first month in a while where we have seen such large decreases.

Calgary Sales  June 2017 July  2017  Change % Change
Detached 1385 1018 -367 -26.50%
Semi Detached 193 147 -46 -23.83%
Attached – Row 276 216 -60 -21.74%
Apartment 286 256 -30 -10.49%
Total City 2140 1637 -503 -23.50%


Calgary Real Estate Sales Prices:

For July we saw small increases in price with the exception of the data errors mentioned above.

Moving forward I expect that detached and semi-detached will remain flat, townhouses may decrease a little more and apartment condos will continue to decrease.

  Sales Prices June 2017 Benchmark Price   July  2017  Benchmark Price Change
Detached 509,400 512,100 2,700
Semi Detached 432,100 420,800 -11,300
Attached – Row 294,000 306,700 12,700
Apartment 265,800 266,200 400
Total City 441,500 443,600 2,100


Sales Prices “Year to Date”  


Sales Prices Jan 1, 2017    Benchmark Price  June 2017  Benchmark Price Change

$

% Change
Detached 498,700 512,100 13,400 2.69%
Semi Detached 406,800 420,800 14,000 3.44%
Attached – Row 302,600 306,700 4,100 1.35%
Apartment 265,000 266,200 1,200 0.45%
Total City 433,400 443,600 10,200 2.35%


**Please note that these numbers include only Calgary homes and do change on a community basis and more so for towns.  This report does not include rural properties.  If you would like to find stats on your community just let me know.  If you have any questions about this summary or Real Estate questions please feel free to contact us.

TSW Real Estate Group

Gord Piper & Brent Wilcox


July 1, 2017 Market Snapshot

Wednesday, July 5th, 2017

What is really happening in the Calgary Real Estate Market?

Absorption Rate for 2017


Stay ahead of everyone else by following our Monthly Market Snapshot of the Calgary Real Estate Market This shows what’s really happening! The market is driven by supply and demand so here we show the inventory (supply) and sales (demand) and most importantly the relationship between the two and how it affects the price of Calgary Real Estate.  A simple way to keep up to date with how the market is trending and to stay ahead of most! All numbers are taken from the Calgary Real Estate Boards Stats package for Realtors. I have also included some general comments which are simply my opinion.

Absorption Rate (Months of Inventory)   (the inventory divided by the number of sales in the last month). What does this mean you might ask?

Buyer’s Market >4.0 Drives prices down
Balanced Market Between 2.4 to 4.0 Prices typically remain stable
Seller’s Market <2.4 Drives prices up

___________________________________________________________________________________________________________________________________

Important Disclaimer:   For those who regularly follow my Market Snapshot you may notice the numbers from last month do not jive with the numbers from this month.  It appears to me that the Real Estate Board made some changes to what fits into each category and then made the stats changes retroactive.  This shows up as a large increase in Semi-Detached homes ($39,000) a large decrease in Row homes (14,300) and a decrease in Apartment condos of $5,400.  In my report I am using their new, year to date numbers so you can still see the change from May to June. _____________________________________________________________________________________________________________________________________

*** Absorption Rate

The Absorption rate for June saw all categories increase very slightly.  The highest increase is in the apartment condo market where it increased by .26 which happens to be where we need it the least.

  May  2017 June 2017   Change
Detached 2.13 2.33 0.19
Semi Detached 2.78 2.90 0.12
Attached – Row 3.49 3.63 0.14
Apartment 6.29 6.55 0.26
Total City 2.92 3.11 0.19


Calgary Listing Inventory

In June we saw a fairly large increase in our inventory level. Detached homes were the highest showing an increase of 283 listings.

Inventory May  2017 June 2017  Change
Detached 2941 3224 283
Semi Detached 518 560 42
Attached – Row 949 1001 52
Apartment 1780 1874 94
Total City 6188 6659 471


Calgary Sales:

Can you say consistent?  Sales in June were almost identical in numbers to May. As you can see sales remain strong in the detached sector and weak in the apartment condo sector.

Calgary Sales  May  2017 June 2017  Change % Change
Detached 1378 1385 7 0.51%
Semi Detached 186 193 7 3.76%
Attached – Row 272 276 4 1.47%
Apartment 283 286 3 1.06%
Total City 2119 2140 21 0.99%


Calgary Real Estate Sales Prices:

For June all sectors showed price increased with the exception of Apartment Condos which showed a slight decrease.  I believe that you will continue to see this trend for apartment condos for quite some time as there are several new buildings coming to completion stage and it’s just going to increase our inventory.

  Sales Prices May  2017Benchmark Price          June 2017  Benchmark Price Change
Detached 506,700 509,400 2,700
Semi Detached 427,900 432,100 4,200
Attached – Row 292,400 294,000 1,600
Apartment 266,600 265,800 -800
Total City 439,300 441,500 2,200


Sales Prices “Year to Date”  


Sales Prices Jan 1, 2017    Benchmark Price  June 2017  Benchmark Price Change

$

% Change
Detached 498,700 509,400 10,700 2.15%
Semi Detached 406,800 432,100 25,300 6.22%
Attached – Row 302,600 294,000 -8,600 -2.84%
Apartment 265,000 265,800 800 0.30%
Total City 433,400 441,500 8,100 1.87%

 **Please note that these numbers include only Calgary homes and do change on a community basis and more so for towns.  This report does not include rural properties.  If you would like to find stats on your community just let me know.  If you have any questions about this summary or Real Estate questions please feel free to contact us.


June 1, 2017 Calgary Real Estate Market Snapshot

Monday, June 5th, 2017

What’s Happening in the Calgary Real Estate Market? 


Absorption Rate Calgary

What is really happening in the Calgary Real Estate market?

Stay ahead of everyone else by following our Monthly Market Snapshot of the Calgary Real Estate Market This shows what’s really happening! The market is driven by supply and demand so here we show the inventory (supply) and sales (demand) and most importantly the relationship between the two and how it affects the price of Calgary Real Estate.  A simple way to keep up to date with how the market is trending and to stay ahead of most! All numbers are taken from the Calgary Real Estate Boards Stats package for Realtors. I have also included some general comments which are simply my opinion.

Absorption Rate (Months of Inventory)   (the inventory divided by the number of sales in the last month). What does this mean you might ask?

Buyer’s Market >4.0 Drives prices down
Balanced Market Between 2.4 to 4.0 Prices typically remain stable
Seller’s Market <2.4 Drives prices up

*** Absorption Rate June 1, 2017

As you can see below the absorption rates for the different categories did not change substantially in May.

  • Seller’s Market – Detached and Semi-Detached Homes – No change
  • Balanced Market – Row or Townhouses
  • Buyer’s Market – Apartment Condo’s


  April 2017 May  2017 Change
Detached 2.09 2.13 0.04
Semi Detached 2.25 2.78 0.54
Attached – Row 3.92 3.49 -0.43
Apartment 5.74 6.29 0.55
Total City 2.87 2.92 0.05


Calgary Listing Inventory

June  saw an increase in inventory levels in all categories. This is a very normal trend for May and we can expect more increases as we get into the summer months.

Inventory April 2017 May  2017 Change
Detached 2522 2941 419
Semi Detached 463 518 55
Attached – Row 863 949 86
Apartment 1647 1780 133
Total City 5495 6188 693


Calgary Sales:

Both Single family and Attached Row houses saw a large increase in sales this month.  Semi-Detached saw a sizable decrease and apartment condos saw a small decrease.

Calgary Sales   April 2017 May  2017 Change % Change
Detached 1204 1378 174 14.45%
Semi Detached 206 186 -20 -9.71%
Attached – Row 220 272 52 23.64%
Apartment 287 283 -4 -1.39%
Total City 1917 2119 202 10.54%


Calgary Real Estate Sales Prices: 

Wow, this is the first time in a few years that I can say that all categories saw price increases during the month of May.   While this trend seems nice (for homeowners) I cannot see that this can continue.  Detached homes should continue to increase but Apartment condos should not (and should be going down) with the high absorption rate.

  Sales Prices April 2017 Benchmark Price          May  2017 Benchmark Price Change
Detached 504,100 509,000 4,900
Semi Detached 390,200 393,100 2,900
Attached – Row 305,900 308,300 2,400
Apartment 269,200 271,200 2,000
Total City 439,600 443,800 4,200


Sales Prices “Year to Date”   

Sales Prices Jan 1, 2017    Benchmark Price  May  2017 Benchmark Price Change

$

% Change
Detached 498,300 509,000 10,700 2.15%
Semi Detached 385,400 393,100 7,700 2.00%
Attached – Row 307,900 308,300 400 0.13%
Apartment 269,200 271,200 2,000 0.74%
Total City 435,400 443,800 8,400 1.93%

 Clarification

**Please note that these numbers include only Calgary homes and do change on a community basis and more so for towns.  This report does not include rural properties.  If you would like to find stats on your community just let me know.  If you have any questions about this summary or Real Estate questions please feel free to contact us.


May 1, 2017 Calgary Real Estate Market Snapshot

Tuesday, May 2nd, 2017

What is really happening in the Calgary Real Estate market?

Calgary Real Estate Absorption Rate

Stay ahead of everyone else by following our Monthly Market Snapshot of the Calgary Real Estate Market This shows what’s really happening! The market is driven by supply and demand so here we show the inventory (supply) and sales (demand) and most importantly the relationship between the two and how it affects the price of Calgary Real Estate.  A simple way to keep up to date with how the market is trending and to stay ahead of most! All numbers are taken from the Calgary Real Estate Boards Stats package for Realtors. I have also included some general comments which are simply my opinion.

Absorption Rate (Months of Inventory)   (the inventory divided by the number of sales in the last month). What does this mean you might ask?

Buyer’s Market >4.0 Drives prices down
Balanced Market Between 2.4 to 4.0 Prices typically remain stable
Seller’s Market <2.4 Drives prices up

The absorption rate for April remained fairly flat.  Detached homes changes only by .13%.  Semi detached rate decreased by .04% while attached homes and Townhouses both increased by .5% This leaves us in the following market positions:

  • Sellers Market – Detached and Semi-Detached Homes
  • Balanced Market – Row or Townhouses
  • Buyers Market – Apartment Condo’s
  March 2017 April 2017 Change
Detached 1.97 2.09 0.13
Semi Detached 2.29 2.25 -0.04
Attached – Row 3.38 3.92 0.54
Apartment 5.22 5.74 0.52
Total City 2.68 2.87 0.18


Calgary Listing Inventory

April saw a slight increase in our inventory level in all categories except Semi Detached which remained even.  Increasing inventory is a normal pattern for April as we are approaching the spring market.  Expect our inventory to continue to increase over the next few months.

Inventory March 2017 April 2017 Change
Detached 2312 2522 210
Semi Detached 463 463 0
Attached – Row 764 863 99
Apartment 1575 1647 72
Total City 5114 5495 381

Calgary Sales:

All categories remained flat in sales. Overall we had 11 more sales in April then in March. This again is a fairly normal pattern and I expect this number to start to increase as buyers tend to come out once spring starts to arrive. We are starting to see lots of competing offers again in the detached market.

Calgary Sales   March 2017 April 2017 Change % Change
Detached 1176 1204 28 2.38%
Semi Detached 202 206 4 1.98%
Attached – Row 226 220 -6 -2.65%
Apartment 302 287 -15 -4.97%
Total City 1906 1917 11 0.58%


Calgary Real Estate Sales Prices: 

Prices this month increased marginally in all categories except for Apartment Condos which went down by $500. The increases in the Detached and Semi Detached homes were small and Row Houses actually increased by $1800.  Based on the absorption rate I believe you will continue to see increases in all Detached and Semi Detached Homes, prices should remain flat for Attached-Row houses and a slight decline in apartment condos which are still very much in a buyer’s market position.

  Sales Prices March 2017   2016 Benchmark Price          April 2017 Benchmark Price Change
Detached 503,900 504,100 200
Semi Detached 389,600 390,200 600
Attached – Row 304,100 305,900 1,800
Apartment 269,700 269,200 -500
Total City 439,400 439,600 200


Sales Prices “Year to Date”   

Sales Prices Jan 1, 2017    Benchmark Price  April  2017 Benchmark Price Change

$

% Change
Detached 498,300 504,100 5,800 1.16%
Semi Detached 385,400 390,200 4,800 1.25%
Attached – Row 307,900 305,900 -2,000 -0.65%
Apartment 269,200 269,200 0 0.00%
Total City 435,400 439,600 4,200 0.96%


Price Notes 

**Please note that these numbers include only Calgary homes and do change on a community basis and more so for towns.  This report does not include rural properties.  If you would like to find stats on your community just let me know.  If you have any questions about this summary or Real Estate questions please feel free to contact us.


March 1, 2017 Calgary Real Estate snapshot

Wednesday, March 1st, 2017

The Calgary Real Estate Market in changing.

Detached homes are now in a Seller’s market position

Semi-Detached homes are now into a balanced market position

Row (Townhouses) and Apartment condos are in a buyers market position but have moved drastically into a better market (towards balanced)


Absorption rate for the Calgary Real Estate market for February 2017.

Absorption rate for the Calgary Real Estate market for February 2017.

What is really happening in the Calgary Real Estate market?

Stay ahead of everyone else by following our Monthly Market Snapshot of the Calgary Real Estate Market This shows what’s really happening! The market is driven by supply and demand so here we show the inventory (supply) and sales (demand) and most importantly the relationship between the two and how it affects the price of Calgary Real Estate.  A simple way to keep up to date with how the market is trending and to stay ahead of most! All numbers are taken from the Calgary Real Estate Boards Stats package for Realtors. I have also included some general comments which are simply my opinion.

Absorption Rate (Months of Inventory)   (the inventory divided by the number of sales in the last month). What does this mean you might ask?

Buyer’s Market >4.0 Drives prices down
Balanced Market Between 2.4 to 4.0 Prices typically remain stable
Seller’s Market <2.4 Drives prices up

*** Absorption Rate***  

The absorption rate for all of Calgary decreased quite substantially this month.  Not a lot of listings going on market but more importantly a large increase in sales is driving this.  Detached homes have now gone into a Seller’s Market position,  Attached-Row & Apartment condos are still in a buyer’s market and Semi-detached is in a balanced market.


December   2016 January  2017 Change
Detached 3.17 2.41 -0.75
Semi Detached 4.61 3.44 -1.17
Attached – Row 4.73 4.41 -0.32
Apartment 8.40 5.88 -2.53
Total City 4.34 3.35 -0.99


Calgary Listing Inventory

February saw a slight increase in our inventory level in all categories.  This is a normal pattern for February as were approaching the spring market.  Normal trends would predict that over the next few months we will continue to see more listings so a further increase in inventory.

Inventory December   2016 January  2017 Change
Detached 1849 1990 141
Semi Detached 383 437 54
Attached – Row 610 679 69
Apartment 1269 1387 118
Total City 4112 4493 381


Calgary Sales:

Wow.  Every Category saw a large increase in sales in February.  The smallest increase was in Attached-row houses (townhouses) and they still increased over Jan by 19.38%   It is normal for us to see an increase in sales from Jan to Feb but this is a large increase which the Calgary Market has been waiting for, for some time.


Calgary Sales   December   2016 January  2017 Change % Change
Detached 584 825 241 41.27%
Semi Detached 83 127 44 53.01%
Attached – Row 129 154 25 19.38%
Apartment 151 236 85 56.29%
Total City 947 1342 395 41.71%


Calgary Real Estate Sales Prices: 

Prices are consistent with our Absorption rate with Detached and Semi Detached prices rising while Attached-Row houses and apartment condos decreased a little more as they are still in a buyer’s market position.   My predictions for the next few months is more of the same trends.

  Sales Prices December   2016 Benchmark Price  January  2017 Benchmark Price Change
Detached 500,400 501,900 1,500
Semi Detached 384,600 386,300 1,700
Attached – Row 307,100 305,900 -1,200
Apartment 269,900 269,200 -700
Total City 437,400 438,100 700


Sales Prices “Year to Date”   


Sales Prices Jan 1, 2017    Benchmark Price  January  2017 Benchmark Price Change

$

% Change
Detached 498,300 501,900 3,600 0.72%
Semi Detached 385,400 386,300 900 0.23%
Attached – Row 307,900 305,900 -2,000 -0.65%
Apartment 269,200 269,200 0 0.00%
Total City 435,400 438,100 2,700 0.62%

Price Sensitivity

**Please note that these numbers include only Calgary homes and do change on a community basis and more so for towns.  This report does not include rural properties.  If you would like to find stats on your community just let me know.  If you have any questions about this summary or Real Estate questions please feel free to contact us.