Posts Tagged ‘calgary real estate prices’

Calgary Real Estate Market Snapshot- May 1, 2018

Wednesday, May 2nd, 2018

What is really happening in the Calgary Real Estate Market?


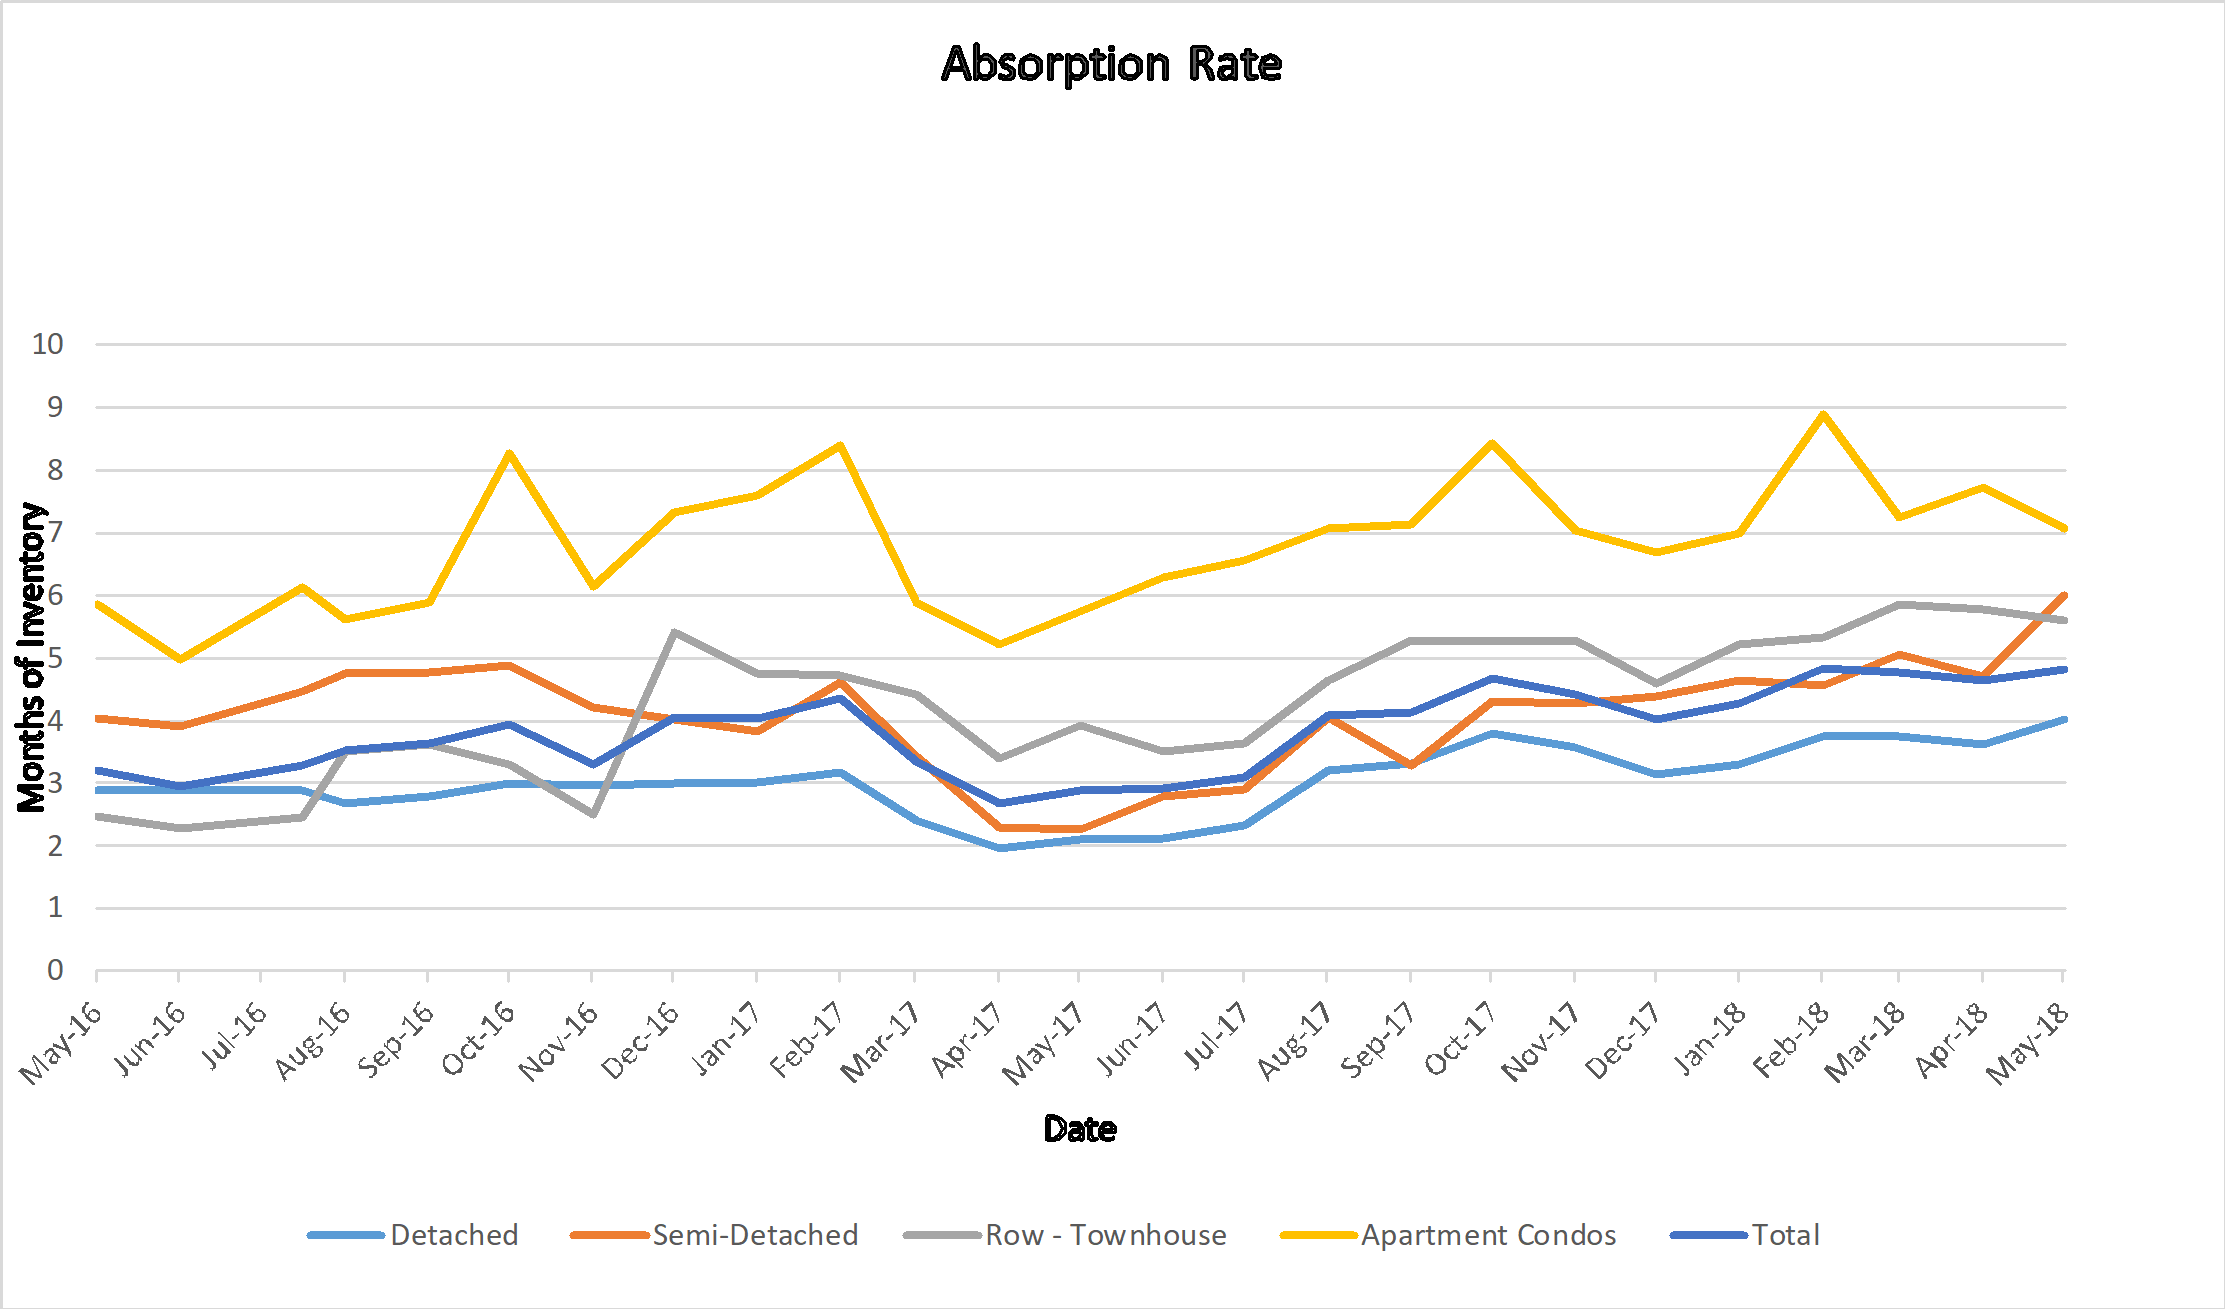
Months of housing inventory for last 2 years.


What is really happening in the Calgary Real Estate Market?

Stay ahead of everyone else by following our Monthly Market Snapshot of the Calgary Real Estate Market, This shows what’s really happening! The market is driven by supply and demand so here we show the inventory (supply) and sales (demand) and most importantly the relationship between the two and how it affects the price of Calgary Real Estate.  A simple way to keep up to date with how the market is trending and to stay ahead of most! All numbers are taken from the Calgary Real Estate Boards Stats package for Realtors. I have also included some general comments which are simply my opinion.

Absorption Rate (Months of Inventory – the inventory divided by the number of sales in the last month). What does this mean you might ask?

Buyer’s Market >4.0 Drives prices down
Balanced Market Between 2.4 to 4.0 Prices typically remain stable
Seller’s Market <2.4 Drives prices up


April end  Absorption Rate

For the month of April we had some larger changes here.  Semi-Detached increased by 1.3, Detached increased by .4, while apartment condos decreased by .65 which has been drastically needed.  In my opinion we can be thankful that our inventory to sales is staying somewhat balanced considering the lull in sales.

End of Mar 2018    Apr 2018    Change
Detached 3.61 4.01 0.40
Semi Detached 4.70 6.00 1.30
Attached – Row 5.77 5.60 -0.17
Apartment 7.72 7.06 -0.65
Total City 4.64 4.82 0.19


Calgary Listing Inventory

In April, our inventory increased in all Sectors. This is totally expected at this time of year.  This trend is anticipated until the end of June as more people list their homes in Spring.

Inventory Mar 2018    Apr 2018    Change
Detached 3063 3642 579
Semi Detached 677 756 79
Attached – Row 941 1075 134
Apartment 1690 1851 161
Total City 6371 7324 953


Calgary Sales:

While our monthly numbers are trending upwards in all categories except Semi-detached these stats don’t show the comparison to last year.  Compared to last year Jan to April end we are down in Sales by 19.6%

As pointed out last month this can be due to a number of factors including but not limited to:

  • Weather
  • Mortgage rules changes from Jan 1
  • Calgary’s economy
  • Consumer lack of confidence.


Calgary Sales  Mar 2018    Apr 2018    Change % Change
Detached 848 908 60 7.08%
Semi Detached 144 126 -18 -12.50%
Attached – Row 163 192 29 17.79%
Apartment 219 262 43 19.63%
Total City 1374 1518 144 10.48%


Calgary Real Estate Sales Prices:

Prices in April showed very little change for all categories.  All categories increased with the exception of Apartment Condos and based on the absorption rate this will continue for some time.

  Sales Prices Mar 2018    Benchmark Price   Apr 2018   Benchmark Price Change
Detached 503,800 504,500 700
Semi Detached 418,800 420,000 1,200
Attached – Row 297,600 300,000 2,400
Apartment 257,100 256,700 -400
Total City 435,600 436,500 900


Sales Prices “Year to Date”  

Sales Prices Jan 1, 2018    Benchmark Price  Apr 2018   Benchmark Price Change

$

% Change
Detached 499,600 504,500 4,900 0.98%
Semi Detached 416,600 420,000 3,400 0.82%
Attached – Row 299,500 300,000 500 0.17%
Apartment 257,700 256,700 -1,000 -0.39%
Total City 433,200 436,500 3,300 0.76%


**Please note that these numbers include only Calgary homes and do change on a community basis and more so for towns.  This report does not include rural properties.  If you would like to find stats on your community or if you have any questions about this summary or about Real Estate in general, please feel free to contact us.
 

Calgary Real Estate Market Snapshot – Dec. 1, 2017

Saturday, December 2nd, 2017

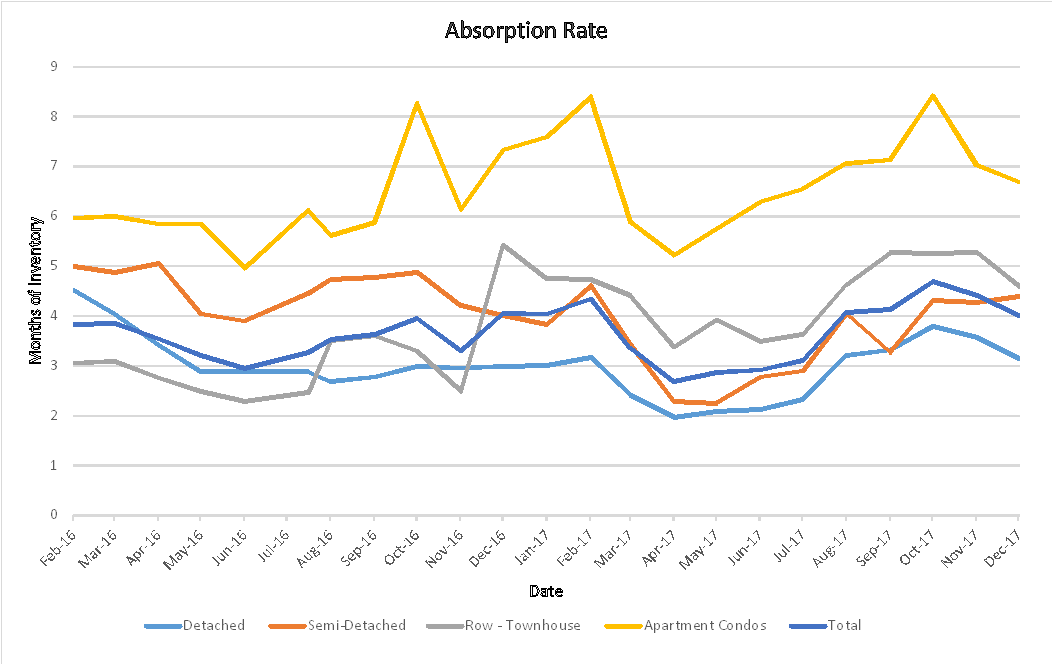
Absorption Rate Dec. 2017

What is really happening in the Calgary Real Estate Market?

Stay ahead of everyone else by following our Monthly Market Snapshot of the Calgary Real Estate Market This shows what’s really happening! The market is driven by supply and demand so here we show the inventory (supply) and sales (demand) and most importantly the relationship between the two and how it affects the price of Calgary Real Estate.  A simple way to keep up to date with how the market is trending and to stay ahead of most! All numbers are taken from the Calgary Real Estate Boards Stats package for Realtors. I have also included some general comments which are simply my opinion.

What is Absorption Rate (Months of Inventory)   (the inventory divided by the number of sales in the last month). What does this mean you might ask?

Buyer’s Market >4.0 Drives prices down
Balanced Market Between 2.4 to 4.0 Prices typically remain stable
Seller’s Market <2.4 Drives prices up

Current Absorption Rate

The Absorption rate for November decreased in all categories except Semi – Detached which rose a little.  In my opinion this is mainly due to listings expiring and not due to sales.  Either way this is good as it is keeping the market fairly balanced. 

Oct  2017  Nov  2017  Change
Detached 3.57 3.15 -0.42
Semi Detached 4.27 4.40 0.13
Attached – Row 5.28 4.60 -0.68
Apartment 7.03 6.69 -0.35
Total City 4.41 4.01 -0.39


Calgary Listing Inventory

In November all categories saw a decrease in the number of listings.  This is normal for this time of year where people will let their listing expire and then put it back on in the new year.

Inventory Oct  2017  Nov  2017  Change
Detached 3246 2758 -488
Semi Detached 611 555 -56
Attached – Row 967 861 -106
Apartment 1639 1491 -148
Total City 6463 5665 -798


Calgary Sales:

Sales for November saw a small decrease overall.  Attached Row homes are the only category to show an increase.  Semi-Detached saw a rather large decrease and it’s my belief that this is simply listings expiring that will be relisted in January.

Of interest Calgary year to date sales are 15% above last year’s sales.

Calgary Sales  Oct  2017  Nov  2017  Change % Change
Detached 908 875 -33 -3.63%
Semi Detached 143 126 -17 -11.89%
Attached – Row 183 187 4 2.19%
Apartment 233 223 -10 -4.29%
Total City 1467 1411 -56 -3.82%


Calgary Real Estate Sales Prices:

Prices for November showed a slight decrease in Calgary.  This in my opinion is mainly due to consumer confidence or lack of it.

  Sales Prices Oct  2017  Benchmark Price   Nov  2017  Benchmark Price Change
Detached 506,200 504,000 -2,200
Semi Detached 419,000 417,800 -1,200
Attached – Row 305,000 303,100 -1,900
Apartment 261,600 258,300 -3,300
Total City 438,900 436,700 -2,200


Sales Prices “Year to Date”  

Sales Prices Jan 1, 2017    Benchmark Price  Nov  2017  Benchmark Price Change

$

% Change
Detached 498,700 504,000 5,300 1.06%
Semi Detached 406,800 417,800 11,000 2.70%
Attached – Row 302,600 303,100 500 0.17%
Apartment 265,000 258,300 -6,700 -2.53%
Total City 433,400 436,700 3,300 0.76%

 **Please note that these numbers include only Calgary homes and do change on a community basis and more so for towns.  This report does not include rural properties.  If you would like to find stats on your community just let me know.

Calgary Real Estate Market Snapshot – Oct 1, 2017

Monday, October 2nd, 2017

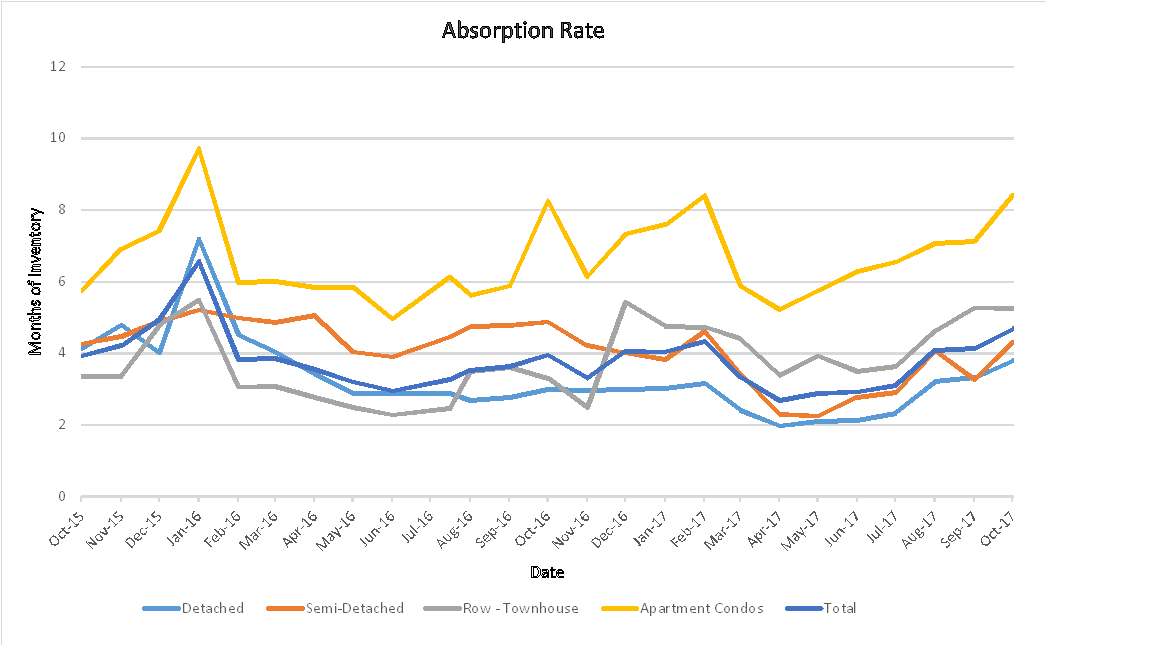
Calgary Absorption Rate

What is really happening in the Calgary Real Estate Market?

Stay ahead of everyone else by following our Monthly Market Snapshot of the Calgary Real Estate Market This shows what’s really happening! The market is driven by supply and demand so here we show the inventory (supply) and sales (demand) and most importantly the relationship between the two and how it affects the price of Calgary Real Estate.  A simple way to keep up to date with how the market is trending and to stay ahead of most! All numbers are taken from the Calgary Real Estate Boards Stats package for Realtors. I have also included some general comments which are simply my opinion.

Absorption Rate (Months of Inventory)   (the inventory divided by the number of sales in the last month). What does this mean you might ask?

Buyer’s Market >4.0 Drives prices down
Balanced Market Between 2.4 to 4.0 Prices typically remain stable
Seller’s Market <2.4 Drives prices up


Absorption Rate

The Absorption rate for September increased in all categories except attached-row homes where it dropped marginally.   The one to note is apartment condos which increased by 1.29 putting us at 8.42 months of inventory.  

  Aug  2017  Sept  2017  Change
Detached 3.32 3.79 0.46
Semi Detached 3.27 4.31 1.04
Attached – Row 5.27 5.25 -0.02
Apartment 7.13 8.42 1.29
Total City 4.13 4.69 0.56

 Calgary Listing Inventory

In September all categories stayed flat except for detached homes which saw an increase of 199 listings.

Inventory Aug  2017  Sept  2017  Change
Detached 3280 3479 199
Semi Detached 585 621 36
Attached – Row 991 993 2
Apartment 1769 1768 -1
Total City 6624 6861 237


Calgary Sales:

Sales for September saw a decrease in all categories except attached-row homes which increased by 1.  A decrease at this time of year is fairly normal and I would classify this as simply seasonal.

Of interest Calgary year to date sales are 7% above last year’s sales.

Calgary Sales  Aug  2017  Sept  2017  Change % Change
Detached 987 919 -68 -6.89%
Semi Detached 179 144 -35 -19.55%
Attached – Row 188 189 1 0.53%
Apartment 248 210 -38 -15.32%
Total City 1602 1462 -140 -8.74%


Calgary Real Estate Sales Prices:

Okay, I will eat my words here.  Last month I predicted that prices would remain fairly even except for attached – row houses and apartment condos which I said should drop.  As you can see below I was wrong however with the absorption rates I again will predict all categories will remain fairly flat with the exception of apartment condos where a decrease is likely.

  Sales Prices Aug   2017Benchmark Price   Sept  2017  Benchmark Price Change
Detached 510,900 508,900 -2,000
Semi Detached 419,600 419,400 -200
Attached – Row 307,000 306,900 -100
Apartment 263,300 263,700 400
Total City 442,300 441,500 -800


Sales Prices “Year to Date”  

Sales Prices Jan 1, 2017    Benchmark Price  Sept  2017  Benchmark Price Change

$

% Change
Detached 498,700 508,900 10,200 2.05%
Semi Detached 406,800 419,400 12,600 3.10%
Attached – Row 302,600 306,900 4,300 1.42%
Apartment 265,000 263,700 -1,300 -0.49%
Total City 433,400 441,500 8,100 1.87%

 **Please note that these numbers include only Calgary homes and do change on a community basis and more so for towns.  This report does not include rural properties.  If you would like to find stats on your community just let me know.  If you have any questions about this summary or Real Estate questions please feel free to contact us.


TSW Real Estate Group


July 1, 2017 Market Snapshot

Wednesday, July 5th, 2017

What is really happening in the Calgary Real Estate Market?

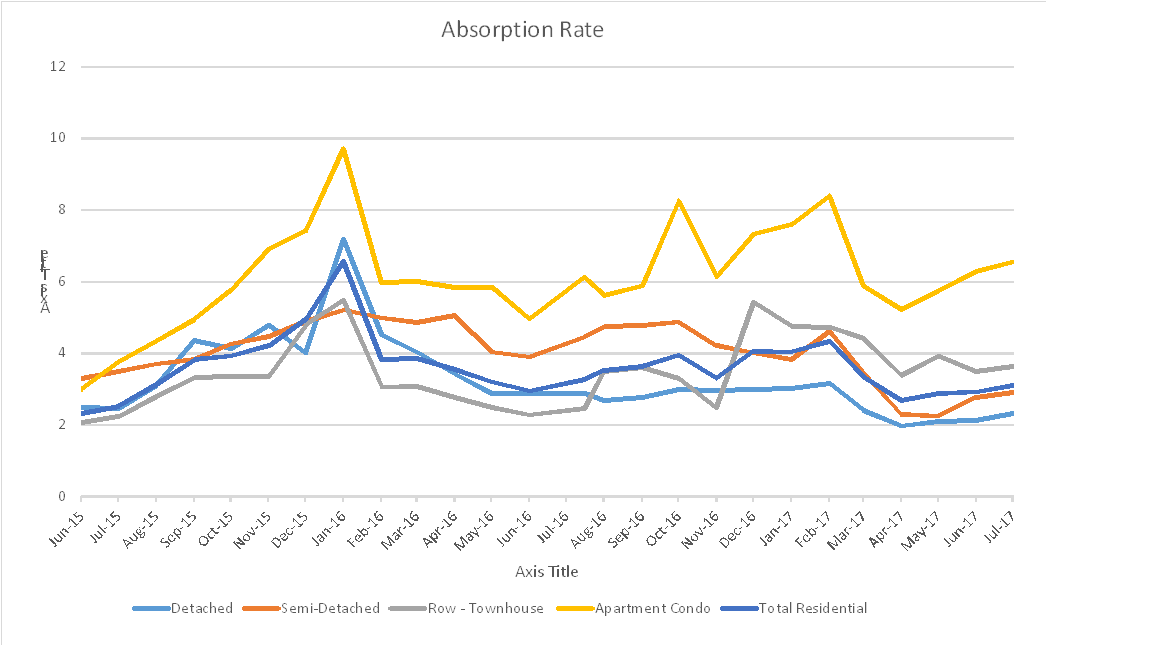
Absorption Rate for 2017


Stay ahead of everyone else by following our Monthly Market Snapshot of the Calgary Real Estate Market This shows what’s really happening! The market is driven by supply and demand so here we show the inventory (supply) and sales (demand) and most importantly the relationship between the two and how it affects the price of Calgary Real Estate.  A simple way to keep up to date with how the market is trending and to stay ahead of most! All numbers are taken from the Calgary Real Estate Boards Stats package for Realtors. I have also included some general comments which are simply my opinion.

Absorption Rate (Months of Inventory)   (the inventory divided by the number of sales in the last month). What does this mean you might ask?

Buyer’s Market >4.0 Drives prices down
Balanced Market Between 2.4 to 4.0 Prices typically remain stable
Seller’s Market <2.4 Drives prices up

___________________________________________________________________________________________________________________________________

Important Disclaimer:   For those who regularly follow my Market Snapshot you may notice the numbers from last month do not jive with the numbers from this month.  It appears to me that the Real Estate Board made some changes to what fits into each category and then made the stats changes retroactive.  This shows up as a large increase in Semi-Detached homes ($39,000) a large decrease in Row homes (14,300) and a decrease in Apartment condos of $5,400.  In my report I am using their new, year to date numbers so you can still see the change from May to June. _____________________________________________________________________________________________________________________________________

*** Absorption Rate

The Absorption rate for June saw all categories increase very slightly.  The highest increase is in the apartment condo market where it increased by .26 which happens to be where we need it the least.

  May  2017 June 2017   Change
Detached 2.13 2.33 0.19
Semi Detached 2.78 2.90 0.12
Attached – Row 3.49 3.63 0.14
Apartment 6.29 6.55 0.26
Total City 2.92 3.11 0.19


Calgary Listing Inventory

In June we saw a fairly large increase in our inventory level. Detached homes were the highest showing an increase of 283 listings.

Inventory May  2017 June 2017  Change
Detached 2941 3224 283
Semi Detached 518 560 42
Attached – Row 949 1001 52
Apartment 1780 1874 94
Total City 6188 6659 471


Calgary Sales:

Can you say consistent?  Sales in June were almost identical in numbers to May. As you can see sales remain strong in the detached sector and weak in the apartment condo sector.

Calgary Sales  May  2017 June 2017  Change % Change
Detached 1378 1385 7 0.51%
Semi Detached 186 193 7 3.76%
Attached – Row 272 276 4 1.47%
Apartment 283 286 3 1.06%
Total City 2119 2140 21 0.99%


Calgary Real Estate Sales Prices:

For June all sectors showed price increased with the exception of Apartment Condos which showed a slight decrease.  I believe that you will continue to see this trend for apartment condos for quite some time as there are several new buildings coming to completion stage and it’s just going to increase our inventory.

  Sales Prices May  2017Benchmark Price          June 2017  Benchmark Price Change
Detached 506,700 509,400 2,700
Semi Detached 427,900 432,100 4,200
Attached – Row 292,400 294,000 1,600
Apartment 266,600 265,800 -800
Total City 439,300 441,500 2,200


Sales Prices “Year to Date”  


Sales Prices Jan 1, 2017    Benchmark Price  June 2017  Benchmark Price Change

$

% Change
Detached 498,700 509,400 10,700 2.15%
Semi Detached 406,800 432,100 25,300 6.22%
Attached – Row 302,600 294,000 -8,600 -2.84%
Apartment 265,000 265,800 800 0.30%
Total City 433,400 441,500 8,100 1.87%

 **Please note that these numbers include only Calgary homes and do change on a community basis and more so for towns.  This report does not include rural properties.  If you would like to find stats on your community just let me know.  If you have any questions about this summary or Real Estate questions please feel free to contact us.


Feb 1, 2017 Calgary Real Estate Market Snapshot

Wednesday, February 1st, 2017

What is really happening in the Calgary Real Estate market?

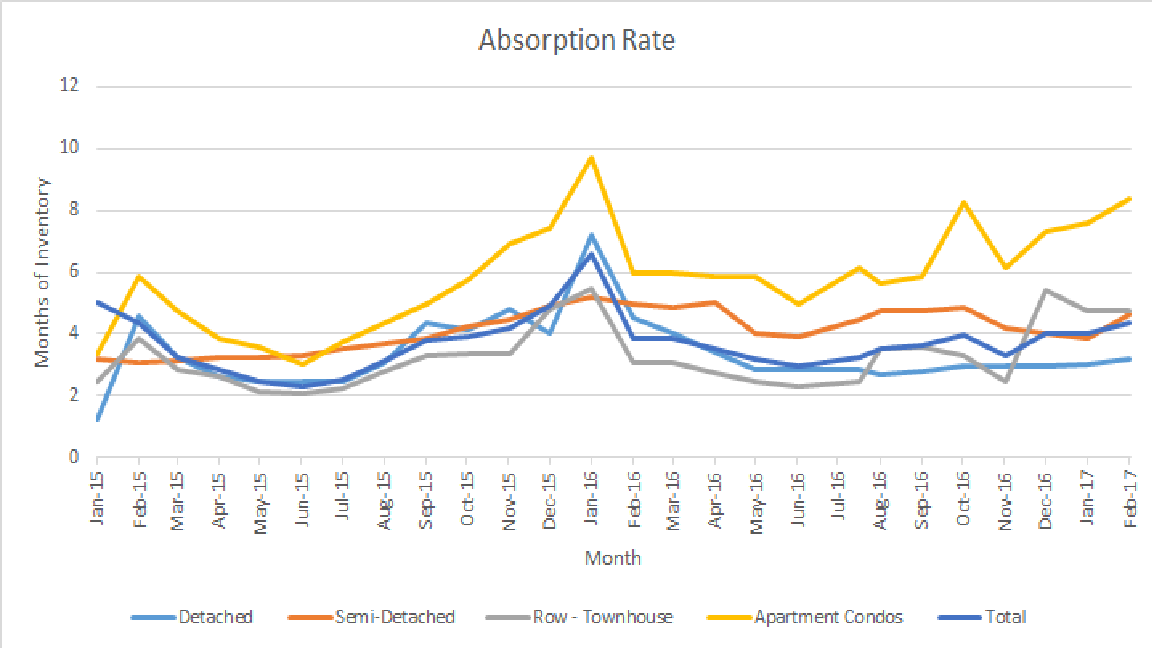
Feb 2017

Stay ahead of everyone else by following our Monthly Market Snapshot of the Calgary Real Estate Market This shows what’s really happening! The market is driven by supply and demand so here we show the inventory (supply) and sales (demand) and most importantly the relationship between the two and how it affects the price of Calgary Real Estate.  A simple way to keep up to date with how the market is trending and to stay ahead of most! All numbers are taken from the Calgary Real Estate Boards Stats package for Realtors. I have also included some general comments which are simply my opinion.

Absorption Rate (Months of Inventory)   (the inventory divided by the number of sales in the last month). What does this mean you might ask?

Buyer’s Market >4.0 Drives prices down
Balanced Market Between 2.4 to 4.0 Prices typically remain stable
Seller’s Market <2.4 Drives prices up


*** Absorption Rate***  

The absorption rate for all of Calgary increased this month meaning listings outpaced sales.   Detached Homes and Row Homes (Townhouses) increased marginally and we saw larger increases in Semi-Detached and apartment condos.

December   2016 January  2017 Change
Detached 3.01 3.17 0.16
Semi Detached 3.83 4.61 0.78
Attached – Row 4.75 4.73 -0.02
Apartment 7.59 8.40 0.81
Total City 4.04 4.34 0.31


Calgary Listing Inventory

January saw an increase of listings over December and this is to be expected as very few people want to list during the holidays.  Normal trends would predict that over the next few months we will continue to see more listings so a further increase in inventory.

Inventory December   2016 January  2017 Change
Detached 1719 1849 130
Semi Detached 368 383 15
Attached – Row 570 610 40
Apartment 1108 1269 161
Total City 3765 4112 347


Calgary Sales:

January saw an increase in sales in all categories except Semi Detached which is down by 13 sales.  This increase is fully expected as there are always more people buying in January than in December. What comes as a surprise to me is that the increase over December is only 14 more sales.  Personally I thought the increase would be more substantial.  The interesting and possibly good news here is that our sales were up 24% from January of 2016.

Calgary Sales   December   2016 January  2017 Change % Change
Detached 571 584 13 2.28%
Semi Detached 96 83 -13 -13.54%
Attached – Row 120 129 9 7.50%
Apartment 146 151 5 3.42%
Total City 933 947 14 1.50%


Calgary Real Estate Sales Prices: 

Prices did not change substantially this month.   Detached homes made the largest gain.  I find it surprising that Apartment Condos gained a little this month.  With such a high absorption rate I would predict apartment condos will lose more in the upcoming months.

  Sales Prices December   2016 Benchmark Price  January  2017 Benchmark Price Change
Detached 498,300 500,400 +2,100
Semi Detached 385,400 384,600 -800
Attached – Row 307,900 307,100 -800
Apartment 269,200 269,900 +700
Total City 435,400 437,400 2,000


Sales Prices “Year to Date”   – Same as Above 


 **Please note that these numbers include on Calgary homes and do change on a community basis and more so for towns.  This report does not include rural properties.  If you would like to find stats on your community just let me know.  If you have any questions about this summary or Real Estate questions please feel free to contact us.


February Calgary Real Estate Market Snapshot

Tuesday, March 1st, 2016

Find out what is really happening in the Real Estate Market. Stay ahead of everyone else by following our Monthly Market Snapshot of the Calgary Real Estate Market. This shows what’s really happening! The market is driven by supply and demand so here we show the inventory (supply) and sales (demand) and most importantly the relationship between the two and how it affects the price of Calgary Real Estate.  A simple way to keep up to date and ahead of most!

Below are the details along with a few comments, all numbers were taken from the Calgary Real Estate Boards Stats package for Realtors.

Calgary Listing Inventory

In February our total inventory of listings in Calgary increased in all 3 categories.  This is very typical for this time of year as many sellers wait until after the holiday season to list their homes.  This seasonal trend should continue for the next few months.

Inventory Jan 2016 Feb 2016 Change
Detached 2546 2943 397
Attached 1223 1336 113
Apartment 1253 1402 149
Total City of Calgary 5022 5681 659


Calgary Sales:

Sales in all categories Increased in February.   This again is seasonal and it’s important to note that this Feb we are 6.63% under sales for Feb 2015.

Sales Jan 2016 Feb 2016 Change % of Change
Detached 465 691 226 48.60%
Attached 170 268 98 57.65%
Apartment 129 168 39 30.23%
Total City of Calgary 764 1127 363 47.51%


Calgary Real Estate Sales Prices:  

Prices for all detached and attached homes showed decreases in February.  Apartment Condos showed a slight increase in price.  This may be because apartment condos have been showing price decreases for several months.


  Sales Prices Jan   2015

Benchmark Price 

Feb  2016

Benchmark Price

Change
Detached 509300 504400 -4900
Attached 345600 338900 -6700
Apartment 281900 283600 1700
Total City of Calgary 447300 445000 -2300


Sales Prices “Year to Date”   

Year to date prices

Sales Prices Dec 31, 2015   Benchmark Price  Feb  2016

Benchmark Price

Change

$

% Change
Detached 508700 504400 -4300 -0.85%
Attached 351400 338900 -12500 -3.56%
Apartment 285500 283,600 -1,900 -0.67%
Total City of Calgary 448800 445000 -3800 -0.85%


Absorption Rate (Months of Inventory)   (the inventory divided by the number of sales in the last month). What does this mean you might ask?

Buyer’s Market >4.0 Drives prices down
Balanced Market Between 2.8 to 4.0 Prices typically remain stable
Seller’s Market <2.8 Drives prices up


*** Absorption Rate***   

In my opinion this is the most critical number to look at.  Of interest the trend reversed this month.  The last several months our Absorption rate has been increasing and this is the first time in several months that it decreased.  Does this mean the market has changed – I would not be so quick and would suggest that one month does not make a trend so let’s watch.

Absorption Rate   Jan   2015 Feb  2016 Change
Detached 5.48 4.26 -1.22
Attached 7.19 4.99 -2.21
Apartment 9.71 8.35 -1.37
Total City of Calgary 6.57 5.04 -1.53


Price Sensitivity

It is also important to note that homes in the lower price ranges are still moving much quicker than homes in the higher price ranges.

**Please note that these numbers do change on a community basis and more so for towns.  This report does not include rural properties.  If you would like to find stats on your community just let me know.  If you have any questions about this summary or Real Estate questions please feel free to contact us.

If you know anyone else who might enjoy seeing our monthly summary please share.

TSW Real Estate Group

Calgary Real Estate Market Snapshot, March 1, 2015

Tuesday, March 3rd, 2015

Stay ahead of the curve by following our Monthly Market Snapshot of the Calgary Real Estate Market. This shows what’s really happening in the Calgary Real Estate Market. The market is driven by supply and demand so here we show the inventory (supply) and sales (demand) and the effect on the price of Calgary Real Estate. A simple way to keep up to date and ahead of most!

Below are the details along with a few comments, all numbers were taken from the Calgary Real Estate Boards Stats package for Realtors.

Want to see stats specific to your Community? Register for our Market Report at http://www.calgaryareasolds.com/

Find out what your Neighbor’s home sold for – Register for our Market Report at http://www.calgaryareasolds.com/


Calgary Real Estate Stats have changed.

The Calgary Real Estate Board just changed the operating system for Realtors and with that the monthly Stats categories have changed as well. Here is the categories.

Old Categories New Categories What’s changed
Single Family Home Detached Does not include attached homes
Condo Townhouse Attached Now includes Attached Homes
Condo Apartment Apartment Condos Same


What this means is simply that attached homes are now taken out of the Single family category and lumped in with the townhouse category. There are a few other classification changes but they are very small and won’t show in the stats. This will affect a few of the numbers below.


Oil Prices and the impact on the Calgary Real Estate Market.

I am certainly not going to predict the future here as I am not an expert in the Oil Industry. What I find interesting is that in what I have been reading there seems to be two sides

  • Optimists are predicting that we will be back to at least the 60 – 70 dollar oil by mid year
  • The pessimists are saying that we will be low forever or years anyway


My Stats summary below will show you the facts of what has happened to date and some short term predictions. Please note that the market shifted very fast and when oil prices rebound the market can shift very quickly in the other direction. The big question is when? And if you have the answer to that please share it with me.


Now onto the Stats Market Snapshot


Calgary Listing Inventory: Yes, listings are up again in all categories this month. In Feb we usually see an increase from January and will typically see listing numbers increase in the next 3 to 4 months.


Inventory Jan 2015 Feb 2015 Change
Detached 2359 2830 +471
Attached 950 1190 +240
Apartment 1117 1276 +159
Total City of Calgary 4426 5296 +870


Calgary Sales:

While we are down considerably from last year’s sales the sales increased substantially over January. What I noticed is that first 2 weeks of Feb were similar to January the last 2 weeks picked up.

Sales Jan 2015 Feb 2015 Change % Change
Detached 535 739 +204 +38.1%
Attached 190 261 +71 +37.3%
Apartment 155 217 +62 +40.0%
Total City of Calgary 880 1217 +337 +39.3%


Calgary Real Estate Sales Prices:

Prices in all categories decreased this month. The largest decrease is in Apartment condos which have the highest inventory compared to sales. This trend will continue as long as the absorption rates stay where they are.

Sales Prices Jan 2014 Benchmark Price Feb 2015 Benchmark Price Change
Detached 518,600 516,000 -2,600
Attached 356,000 354,600 -1,800
Apartment 298,700 296,000 -2,700
Total City of Calgary 459,100 456,300 -2,800


Sales Prices “Year to Date”

Year to date prices – Again, all categories decreased but none substantially.

Sales Prices Dec 31, 2014 Benchmark Price Feb 2015 Benchmark Price Change

$

% Change
Detached 518,600 516,000 -$2,600 -.5%
Attached 356,200 354,600 -$2,200 -.61%
Apartment 300,400 296,000 -$4,400 -1.45%
Total City of Calgary 459,500 456,300 -$3,200 -.7%


Absorption Rate (Months of Inventory)  (the inventory divided by the number of sales in the last month). What does this mean you might ask?

Buyer’s Market >4.0 Drives prices down
Balanced Market Between 2.8 to 4.0 Prices typically remain stable
Seller’s Market <2.8 Drives prices up


*** Absorption Rate:

The absorption rate decreased for all categories. What this means is that the relation to sales over inventory decreased. This change put detached homes back into a balanced market while all other categories stayed in a Buyers Market.

Absorption Rate Jan 2015 Feb 2015   Change
Detached 4.41 3.83 -.58
Attached 5.0 4.56 -.44%
Apartment 7.21 5.88 -1.33%
Total City of Calgary 5.03 4.35 -.68%


**Please note that these numbers do change on a community basis and more so for towns. If you would like to find stats on your community just let me know. If you have any questions about this summary, the attached stats package or any Real Estate questions please feel free to contact us.


Calgary Real Estate Market Snapshot Sept 2014

Friday, October 3rd, 2014

Stay ahead of the curve by following our Monthly Market Snapshot of the Calgary Real Estate Market.  This shows what’s really happening in the Calgary Real Estate Market.  The market is driven by supply and demand so here we show the inventory (supply) and sales (demand) and the effect on the price of Calgary Real Estate.   A simple way to keep up to date and ahead of most!  The Calgary housing market is deeply  entrenched is a Sellers Market however is slowly changing and is moving toward a balanced market.

Below are the details along with a few comments, all numbers were taken  from the Calgary Real Estate Boards Stats package for Realtors.

Want to see stats specific to your Community?  Register for our Market Report at http://www.calgaryareasolds.com/


Calgary Listing Inventory: Inventory levels for Single Family homes decreased while everything else increased this month. Typically this time of year we show increases in inventory. Single family home inventory went down which is not normal. I believe the reason is that we still have a large backlog of buyers waiting for the perfect home to come on the market, especially in the starter home price range.


Inventory Aug 2014 Sept 2014     Change
Single Family Home 3021 2961 -60
Condo Townhouse 437 552 +115
Condo Apartment 1056 1081 +25
Total 4514 4594 +80


Calgary Sales:

Sales in September decreased marginally in all categories. Sales numbers decreasing is very normal at this time of year.  It is critical to note that even though the sales are decreasing we are still substantially above our sales for 2013.

Sales Aug 2014 Sept 2014     Change % Change
Single Family Home 1477 1398 -79 -5.3
Condo Townhouse 338 318 -20 -5.9
Condo Apartment 452 432 -20 -4.4
Total 2267 2148 -119 -5.2


Calgary Real Estate Sales Prices:

In September, the benchmark price increased for all categories. Based on the inventory change, prices are likely to increase moderately for a few more months as we move from a seller’s market to a more balanced market. If you have been following my reports you will notice the increases are continuing to get smaller every month.

Sales Prices Aug 2014 Benchmark Price Sept   2014   Benchmark Price Change
Single Family Homes 512,300 512,800 +500
Condo Townhouse 328,300 330,200 +1900
Condo Apartment 298,200 298,800 +600


Sales Prices “Year to Date”

Year to date prices – Prices have increased in all categories. Good news if you are a homeowner.

Sales Prices Dec 31 2013 Benchmark Price Sept 2014 Benchmark Price Change$ % Change
Single Family Homes 472,200 512,800 +40,600 +8.6
Condo Townhouse 307,100 330,200 +23,100 +7.5
Condo Apartment 278,600 298,800 +20,200 +7.3


Absorption Rate (Months of Inventory)  (the inventory divided by the number of sales in the last month). What does this mean you might ask?

Buyer’s Market >4.0
Balanced Market Between 2.8 to 4.0
Seller’s Market <2.8


Absorption Rate:

This month the absorption rate increased in all categories. For Single Family homes the ratio went up even though our inventory decreased – this is because sales decreased more. Condo Townhouses took the largest jump of .45, I believe this is just catching up as last month it went opposite of everything else.

Absorption Rate Aug 2014 Sept 2014   Change
Single Family Homes 2.05 2.11 +.06
Condo Townhouse 1.29 1.74 +.45
Condo Apartment 2.33 2.50 +.17
Total Calgary 1.99 2.14 +.15


**Please note that these numbers do change on a community basis and more so for towns. If you would like to find stats on your community just let me know. If you have any questions about this summary, the attached stats package or any Real Estate questions please feel free to contact us.


If you know anyone else who might enjoy seeing our monthly summary please feel free to share

August 2014, Calgary Real estate Market Snapshot

Monday, September 1st, 2014

Stay ahead of the curve by following our Monthly Market Snapshot of the Calgary Real Estate Market.  This shows what’s really happening in the Calgary Real Estate Market.  The market is driven by supply and demand so here we show the inventory (supply) and sales (demand) and the effect on the price of Calgary Real Estate.   A simple way to keep up to date and ahead of most!  The Calgary housing market is deeply  entrenched is a Sellers Market however is showing slow signs of moving toward a balanced market.

Below are the details along with a few comments, all numbers were taken  from the Calgary Real Estate Boards Stats package for Realtors.

Want to see stats specific to your Community?  Register for our Market Report at http://www.calgaryareasolds.com/


Calgary Listing Inventory: Inventory levels decreased for marginally in all categories. While this is typical for this time of year the challenge is we are starting with a low inventory so a decrease can push us back towards a stronger Seller’s market. I believe the reason is that we still have a large backlog of buyers waiting for the perfect home to come on the market, especially in the starter home price range.

Inventory July 2014 Aug 2014 Change
Single Family Home 3056 3021 -35
Condo Townhouse 536 437 -99
Condo Apartment 1070 1056 -14
Total 4662 4514 -148


Calgary Sales:

Sales in August decreased marginally in all categories except apartment condos. Sales numbers decreasing is very normal at this time as people are focused on summer vacations.  Apartment condos increased and I believe that’s simply that last month they decreased more than the other categories.

Sales July 2014 Aug 2014 Change % Change
Single Family Home 1553 1477 -76  
Condo Townhouse 339 338 -1  
Condo Apartment 444 452 +8  
Total 2336 2267 -69  


Calgary Real Estate Sales Prices:

In August, the benchmark price increased for all categories. Based on the inventory change, prices are likely to increase for a few more months as we move from a seller’s market to a more balanced market. If you have been following my reports monthly the increase is smaller than what we have been seeing.

Sales Prices July 2014

Benchmark Price

Aug 2014

Benchmark Price

Change
Single Family Homes 511,600 512,300 +700
Condo Townhouse 327,000 328,300 +1,300
Condo Apartment 298,100 298,200 +100


Sales Prices “Year to Date”

Year to date prices – same as above, Prices have increased in all categories. Good news if you are a homeowner.

Sales Prices Dec 31 2013 Benchmark Price Aug 2014Benchmark Price Change

$

% Change
Single Family Homes 472,200 512,300 40,100 +8.5
Condo Townhouse 307,100 328,300 21,200 +6.9
Condo Apartment 278,600 298,200 19,600 +7.0


Absorption Rate (Months of Inventory)  (the inventory divided by the number of sales in the last month). What does this mean you might ask?

Buyer’s Market >4.0
Balanced Market Between 2.8 to 4.0
Seller’s Market <2.8


Absorption Rate:

This month the absorption rate increased for single family homes while it decreased for Townhouses and Apartment Condos. This I find interesting as we have been moving from a strong seller’s market towards a buyer’s market (although slowly). My only explanation here is that there is still a backlog of buyers especially in the starter home price ranges putting more pressure on Condos and Townhouses.


Absorption Rate July 2014 Aug 2014   Change
Single Family Homes 1.97 2.05 +.08
Condo Townhouse 1.58 1.29 -.29
Condo Apartment 2.40 2.33 -.07
Total Calgary 1.99 1.99

**Please note that these numbers do change on a community basis and more so for towns. If you would like to find stats on your community just let me know. If you have any questions about this summary, the attached stats package or any Real Estate questions please feel free to contact us.


If you know anyone else who might enjoy seeing our monthly summary please feel free to share.

June 2014, Calgary Real Estate Market Snapshot

Tuesday, July 1st, 2014

Stay ahead of the curve by following our Monthly Market Snapshot of the Calgary Real Estate Market.  This shows what’s really happening in the Calgary Real Estate Market.  The market is driven by supply and demand so here we show the inventory (supply) and sales (demand) and the effect on the price of Calgary Real Estate.   A simple way to keep up to date and ahead of most!  The Calgary housing market is deeply  entrenched is a Sellers Market with very little supply and strong demand.  In June we started seeing a slight shift towards a buyers market but we have a long way to go.

Below are the details along with a few comments, all numbers were taken  from the Calgary Real Estate Boards Stats package for Realtors.

Want to see stats specific to your Community?  Register for our Market Report at http://www.calgaryareasolds.com/


Calgary Listing Inventory: Inventory levels increased this month in all categories except townhouses. Increasing inventory levels is very normal at this time of year as many sellers wait until spring to sell. I am actually surprised that the levels did not increase more than they did.

Inventory May 2014   June 2014 Change
Single Family Home 2947 3128 +181
Condo Townhouse 576 523 -53
Condo Apartment 1051 1071 +20
Total 4574 4722 +148


Calgary Sales:

Sales in June decreased in all categories except for Townhouses which increased slightly. Sales numbers decreasing is very normal at this time as people start to go on summer vacations. The increase in sales in Townhouse is most likely that there is still a pent up demand and people were just waiting for the right one to come on the market.

Sales May 2014   June 2014     Change % Change
Single Family Home 2027 1769 -258 -14.5%
Condo Townhouse 410 427 +17 +3.9
Condo Apartment 511 474 -37 -7.8%
Total 2948 2670 -278 -10.4%


Calgary Real Estate Sales Prices:

In June, the benchmark price increased for all categories. Based on the inventory change, prices are likely to increase for a few more months as we move from a seller’s market to a more balanced market.

Sales Prices May 2014   Benchmark Price June 2014     Benchmark Price Change
Single Family Homes 504,300 509,700 +5,400
Condo Townhouse 321,400 326,000 +4,600
Condo Apartment 295,400 299,700 +4,300


Sales Prices “Year to Date”

Year to date prices – same as above, Prices have increased in all categories. Good news if you are a homeowner.

Sales Prices Dec 31 2013 Benchmark Price June 2014   Benchmark Price Change$ % Change
Single Family Homes 472,200 509,700 +37,500 +7.94
Condo Townhouse 307,100 326,000 +18,900 +6.15
Condo Apartment 278,600 299,700 +21,100 +7.58


Absorption Rate (Months of Inventory)  (the inventory divided by the number of sales in the last month). What does this mean you might ask?

Buyer’s Market >4.0
Balanced Market Between 2.8 to 4.0
Seller’s Market <2.8


Absorption Rate: For the third month in a row our absorption rate has increased. This indicates that the market is changing and we are moving towards a balanced market. Please note that we are so deep in a Seller’s market that it will take us a few more months of this trend to reach a balanced market state. My prediction is that this trend will continue and by September or October we will be approaching a balanced market – maybe sooner for apartment condos.

Absorption Rate May 2014   June 2014   Change
Single Family Homes 1.45 1.77 +.32
Condo Townhouse 1.40 1.22 -.18
Condo Apartment 2.06 2.26 +.20
Total Calgary 1.55 1.77 +.22

**Please note that these numbers do change on a community basis and more so for towns. If you would like to find stats on your community just let me know. If you have any questions about this summary, the attached stats package or any Real Estate questions please feel free to contact us.


If you know anyone else who might enjoy seeing our monthly summary please feel free to pass this on. Gord, Eric & Brent